|
Archives 12/30/01, 1/1/02, 1/2/02, 1/3/02, 1/4/02, 1/7/02, 1/8/02, 1/09/02, 1/10/02, 1/11/02, 1/14/02, 1/15/02, 1/16/02, 1/17/02, 1/18/02, 1/22/02, 1/23/02, 1/24/02, 1/25/02, 1/28/02, 1/29/02, 1/30/02, 1/31/02, 2/1/02, 2/4/02, 2/5/02, 2/06/02, 2/7/02, 2/9/02, 2/11/02, 2/12/02, 2/13/02, 2/14/02, 2/16/02, 2/19/02, 2/20/02, 2/21/02, 2/23/02, 2/25/02, 2/26/02, 2/27/02, 2/28/02, 3/1/02, 3/04/02, 3/05/02, 3/06/02, 3/7/02, 3/10/02,3/11/02, 3/12/02, 3/13/02, 3/14/02, 3/15/02, 3/18/02, 3/19/02, 3/20/02, 3/21/02, 3/22/02, 3/25/02, 3/26/02, 3/28/02, 3/30/02 4/1/02, 4/2/02, 4/3/02, 4/4/02, 4/6/02, 4/8/02, 4/9/02, 4/10/02, 4/11/02, 4/13/02, 4/15/02, 4/16/02, 4/17/02, 4/18/02, 4/20/02, 4/22/02, 4/23/02,4/24/02,4/25/02, 4/26/02, 4/27/02, 4/29/02, 4/30/02 5/01/02, 5/2/02, 5/4/02, 5/6/02, 5/07/02, 5/8/02, 5/09/02, 5/10/02, 5/13/02, 5/14/02, 5/15/02, 5/16/02, 5/17/02, 5/20/02, 5/21/02, 5/22/02, 5/23/02, 5/24/02, 5/28/02, 5/29/02, 5/30/02 6/01/02, 6/3/02, 6/4/02, 6/5/02, 6/6/02, 6/7/02, 6/10/02, 6/11/02, 6/12/02, 6/13/02, 6/14/02, 6/17/02, 6/18/02, 6/19/02, 6/20/02, 6/22/02, 6/24/02, 6/25/02, 6/26/02, 6/27/02, 6/30/02 7/1/02, 7/4/02, 7/5/02, 7/11/02, 7/14/02, 7/15/02, 7/16/02, 7/17/02, 7/18/02, 7/19/02, 7/22/02, 7/23/02, 7/24/02, 7/25/02, 7/27/02, 7/29/02, 7/30/02 8/1/02, 8/3/02, 8/5/02, 8/6/02, 8/7/02, 8/8/02, 8/10/02, 8/12/02, 8/13/02, 8/14/02, 8/15/02, 8/16/02, 8/19/02, 8/20/02, 8/21/02, 8/22/02, 8/23/02, 8/26/02, 8/27/02, 8/28/02, 8/29/02, 8/30/02 9/3/02, 9/4/02, 9/5/02. 9/6/02, 9/9/02, 9/10/02, 9/11/02, 9/12/02, 9/13/02, 9/16/02, 9/17/02, 9/18/02, 9/19/02, 9/20/02, 9/23/02, 9/24/02, 9/25/02, 9/26/02, 9/27/02, 9/30/02 10/1/02, 10/2/02, 10/3/02, 10/4/02, 10/7/02, 10/8/02, 10/9/02, 10/10/02, 10/11/02, 10/14/02, 10/15/02, 10/16/02, 10/17/02, 10/18/02, 10/21/02, 10/22/02, 10/23/02, 10/24/02, 10/25/02, 10/28/02, 10/29/02, 10/30/02, 10/31/02 11/1/02, 11/4/02, 11/5/02, 11/6/02, 11/7/02, 11/8/02, 11/11/02, 11/12/02, 11/13/02, 11/14/02, 11/15/02, 11/18/02, 11/19/02, 11/20/02, 11/21/02, 11/22/02, 11/25/02, 11/26/02, 11/27/02, 11/29/02 12/2/02,
12/3/02, 12/4/02,
12/5/02 1/1/03, 1/2/03, 1/03/03, 1/6/03, 1/7/03, 1/8/03, 1/9/03, 1/10/03, 1/13/03, 1/14/03, 1/15/03, 1/16/03, 1/17/03, 1/21/03, 1/22/03, 1/23/03, 1/24/03, 1/27/03, 1/28/03, 1/29/03, 1/30/03, 1/31/03 2/3/03, 2/4/03, 2/5/03, 2/6/03, 2/7/03, 2/10/03, 2/11/03, 2/12/03, 2/13/03, 2/14/03, 2/18/03, 2/19/03, 2/20/03, 2/21/03, 2/24/03
 Doc's view of the Street. |
The Anals of Stock ProctologyPublished weeknights by
8:30PM Happy Acres, Florida Time The American
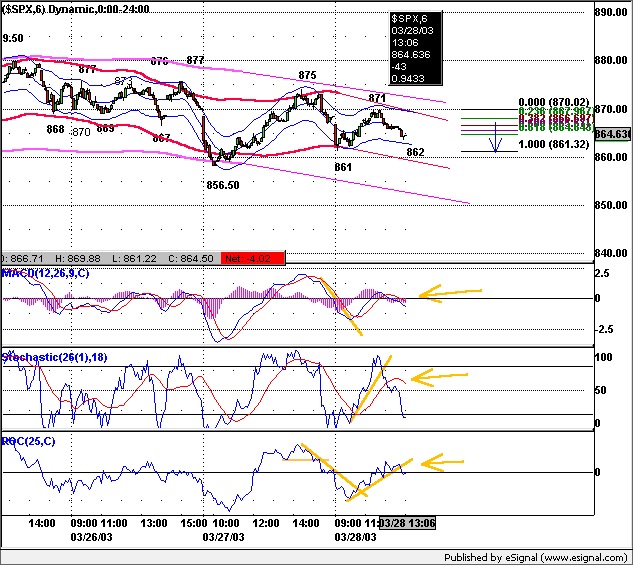
Academy of Stock Proctology and Is your subscription up for renewal? If you want to renew, do nothing, unless your credit card has expired. Please be sure your credit card info is current. If your credit card has expired, you must enter the new expiration date in your Paypal account in order for your subscription to be processed. If you subscribed via Paypal, your subscription will be renewed for one year on the 90 day anniversary of your sign-up and your credit card will be charged. If you want to cancel, use the button at the bottom of the page. This applies only if you subscribed through Paypal. Mailed-in subscriptions are for 1 year. If you subscribed by prior contribution, I will send you a notice before your subscription expires. If you have any questions, see the subscription page and FAQ's. If you can't find the answer, email me. Big Fine Print Doc does not make trading recommendations. This update reports time cycle estimates and centered moving average projections based on the Hurst cycle analysis method, and other techniques. This publication is for entertainment and educational purposes only. Doc assumes no responsibility for the accuracy or inaccuracy of the estimates and projections presented. The market may or may not meet the projections. Stoolies should thoroughly familiarize themselves with the methodology before trading based on this method. Those who do not have the time or inclination to develop a trading strategy based on testing and research should not trade. Trade at your own risk. Yadda yadda. How's your motha? More disclaimers at the bottom of the page. Intraday Updates 2/26/03 1:00 PM 1 day cycle low is still forming with a late revised cmap of 826, down from 830. The extension of the low suggests more weakness. The 3 day cycle is topping out. Normally we'd look for a swup, but yesterday's orgiastic buying may have exhausted demand. I wouldn't be surprised if it just drifted lower. Hell, after yesterday, nothing would surprise me. Chart below. Get regular updates throughout the day in Stooltrading. Next Stooltrading update at 2:15. 9:15 AM Fucutures are down but have bounced back from their early morning lows of just over 830. The downside cmap form the overnight session is 832.50, with 5 hour and 1 day cycle lows due around10:30 and 12:00. Always be flexible by an hour or so with those time projections. One caveat. The 3 day cycle upside cmap on the fucutures is 846. Doesn't have to get their, but that's the number. Severe weakness in AM will cancel that, but if the pullback is mild, the 1 day cycle up phase could reach that level. Chart below. Get regular updates throughout the day in Stooltrading. Intraday Tuesday - The first half followed the game plan with early weakness into a 5 hour low just after 10 AM, and a 1 day cycle low retest at 12:30. After an hour of basing, one or more buy programs kicked in for a hockey stick ramp job that blew out short cycle cmaps, turning into a wild short squeeze in the last half hour and going out on the high tick. Squeezes like that are often followed by a gap down. We won't know until the fucutures players have their fun overnight. Whatever happens on the open, the early going should see some softness. Lows are due at 10:00 and 11:30. Could retest the high after that. Chart below. Get regular updates throughout the day in Stooltrading. Pre Market Update at 9:15 AM NY time. Get StoolieSignal Special offer here only! The cycle map below is en estimate of how the market might behave over the next few hours. Should the pattern be broken, the map should be redrawn to fit the actual. Cmaps and times shown are guidelines only. Cycles vary in wavelength and amplitude. Directional changes within an hour of the expected turn and a few points of the cmap should be respected. The indicators rule. Times and prices are the projected cycle highs and lows with cmaps. 5-8 Day Cycle______ 2-3 Day Cycle_______ 5 Hr-1 Day Cycle
Tuesday's
Markets Fumble! 2/25/03 The bears were driving for the score, got down to the one and....fumbled again. The bulls were backed up to the goal line but they have a lightning passing offense, a quarterback who is a threat to throw a bomb at any time, and a helluva two minute drill. Not to mention that they have a deep bench, with strong reserves. Plus, playing in New York, they always have home field advantage, and millions of obnoxious loud mouthed fans. To make things worse, they own the networks broadcasting the games. Bunch of damn homers. Makes it tough on a bear. The chart below gives you an idea of why this market has been so frustrating for bears fans. According to the linear regression channel, the trend has been in our favor since early November. Arena football season opened on January 27, and in spite of playing on the smaller field, the trend was the same. The problem is that the slope of the field is so flat that it feels like the bulls are winning. They're not but that can change at any time, what with home field advantage and the refs in their pocket. (The bastards cheat while we're trying to play fair.) If, for instance, they can push the ball past the 850 yard line, they should be able to take it down the field to the 900. Until that happens, the bears are still in control of the game, but the game is on the line, and the bears have had a tendency to choke under pressure. If the bulls fumble on this two minute drill when the game resumes Wednesday morning, then the bears will almost surely be able to drive to the 800 yard line. But if the bulls don't cough it up, they'll have the Big Mo. Yes sports fans, it's a real nail biter of a ball game. Neither side has the players to keep the big mo for long. The bulls have trouble getting past the 850, and the bears, while they can get it in the red zone, never seem to be able to score. If you're betting, take the short yardage, and the points.
The forecast path below suggests the 6-7 week cycle (green) top is in but could be retested, with the 10-13 week cycle (red) still heading lower into mid March, but possibly at a more shallow slope than shown.
Fed Turdsday Releases Monetary Review Doc's Pooper Scooper. Be a Johnny Applestool! Help spread the Stool! Feel free to repost snippets from the Anals on message boards around the web. Just give a link back! Many tanks - Doc The Feed did nothing, allowing overnight repos to expire for a net drain of $2.75 billion. There are no other expirations until Turdsday's 28 day repos. Total Feed remains in the middle of the year long 6% growth channel, at a level it first reached three months ago. Al and his henchmen are in a relatively neutral stance in comparison to 2001. Stoolie paranoia regarding the Feed is misplaced. Al's hands are tied by the creeping inflation signals, along with the threat of a resumption of the dollar decline and the accompanying capital flight. Two
trends are evident on the Feed Index, which is the total Fed holdings of
loans and securities. One is the 10% growth trend beginning in May of
2001. The blue channel going back to last December suggests a 5% growth rate. Look at the 4 week moving
average (brown line) and compare it with the slope of the two larger
channels for an indication for whether the slope of short term growth is
slower or faster than the 2 longer term trends. The longer term in the Feedometer trend remains down, suggesting that Al is less inclined to pump excess Feed into the system to jam the markets. Over the last several weeks the trend is flat. This again is evidence of inaction and neutrality by the Feed. Seasonal 401k flows are keeping the market afloat, not the Feed. The liquidity situation is not that bearish at the moment. Uncle Buck holds the key. If foreign investors stay put, the market can remain somewhat stable or rally a bit. If the dollar starts down it means foreign investors are pulling out. Stocks would drop with Uncle Buck. The
Feedometer theoretically measures excess Feed available for bond or stock
market jamming. Al selects a trend level he feels is needed to reflatulate
the economy. The Feedometer measures the difference between the apparent
trend target, and actual day to day Feeding (Fastow Feedometer), as well
as a four week moving average (Slowmo Feedometer). A break above the gold trendline might indicate a more aggressive jamming policy. 10 Year Bonds rose and yields fell,
hitting downside short cycle cmaps of 3.75. However the 13 week cycle cmap
may be as low as 3.65. A test of the October low is possible. Long Term 2/21/03-
The 6 month and 10-12 month cycles will continue to oppose each other as the
10-12 month cycle tops out and the 6 month bottoms. This will lead to a months
long extension of the trading range as the long waves bottom. They should begin
to turn up after the next 10-12 month cycle low in the second half of
2003. Dow Inflatables- In
spite of all the waffling, the 10-13 week cmap still appears to be pointed
at 7400. The 4-7 week cycles composite oscillator is topping out and the 10-13 week cycle oscillator remains flat in negative territory, indicative
of mild trending. If you want something to worry about, how about this? A
close above8000 would turn most indications higher, suggesting an up
phase that could last for several more weeks, and an upturn in the 6 month
cycle that would delay the next downleg for months. All of Doc's daily cycle charts
are powered by METASTOCK Portfolio Sphincters Index (SPX) and Sentiment Cycle Chart Short Term Cycles The short cycle oscillator is turning down in the distribution (aka overbought) zone, signaling that the top is forming in the 6-7 week cycle. The timing is also about right, now 31 days from the last high. Upside cmaps were hit but a retest is possible. The problem is that there are a slew of conflicting indications. A move through the 850 area would signal an extension of the up phase and a probable upturn in the 6 month cycle. The 6-7 week cycle oscillator on the chart below extended its uptrend, suggesting that this swup is not over yet. The 17 day rate of change is still in an uptrend as well, also indicating that the up phase is still in force. Until these two indicators begin to turn, bears cannot relax, especially with an upturn in some longer cycle indicators. Using protection is always a good idea, especially so under current conditions. We have seen the damage that can be done to shorts when the bulls run the squeeze play. The 855 area is a logical line of demarcation for short covering buy stops. Given the fact that everybody sees that, it will trigger a vicious short squeeze. 10-13 Week Cycle Roughly 3 to 6 weeks should remain in the 10-13 week cycle down phase, whether it's a shallow trough or steeper decline. The problem is that the cycle oscillators have turned up and the 6 month cycle oscillator is on the cusp. The 29 day ROC is still in a mild downtrend and this is ordinarily indicative of distribution. The configurations of the cycles on the price charts suggest the indicators may bounce around at a low level while the cycle continues to downtrend, but if all turn up together, the down phase is over. Remaining short at that point would be hazardous to your health. The preliminary downside cmap for this cycle is still below 800 but subject to change either way. One or two big down days this week will push the target lower. Waffling around would leave it unchanged. An extension of today's rally would pull the cmap higher and raise the nasty possibility that the low is behind us. Sentiment VIX declined. (up on the inverted scale chart). Touching the inner channel line, then reversing, indicates a short term top, or confirms a downtrend. The next significant intermediate cycle low should reach at least 50-60. Extending into the low 30's, then reversing, would signal an intermediate top.
The 17 day rate of change is a proxy for the
6-7 week cycle. The 29 day rate of change is a proxy for the 10-13 week
cycle. The blue line overlaid on the price chart is the 10-13 week cycle
oscillator, while the red line is the 6-7 week cycle oscillator. The VIX
is a measure of implied options volatility reflecting relative fear or
complacency. It is plotted below on an inverse scale to better show the
relationship to the price chart. The "Stool Bands" may reflect
either 6 month or 10-12 month cycles. Long Term View 2/21/03 Linear Regression Analysis- The rally off the July-October lows was the first to fail to reach the upper regression projections within 4 months of breaking the lower channel in the bear market. The 1 year regression is sloping down more sharply than at any time throughout this bear. Using METASTOCK, Doc took the 12 month regression channel with the time span fixed at one year, and moved it across the entire chart. In no prior 12 month period was the down slope as sharp as it is now. Having failed to break this 1 year regression channel, the market may be in a period of extended and accelerated decline. The last line of defense was the long term central regression projection. The lower blue projection line has been a congestion area since July, delineating shport on the way down. The 1 year center regression line also indicated an area of shport.
Long term cycle configurations are shown on the chart below. Keep in mind that the longer the nominal cycle length the greater the variance in the actual length of the cycle. The 18 month cycle can range from 12 to 24 months. The nominal 4 year cycle can be 3 years. It can be five years. Four years, give or take a few months has been most typical, especially in the latter half of the twentieth century, but a 3 year cycle is not uncommon. In the first half of the century, cycles frequently lasted 3 or 5 years. Hurst called them "nominal" cycles because cycles vary in length. Looking at charts going back 100 years or more you can see that a 1 year variance is not uncommon for the 4 year cycle. Doc has reformulated the long term forecast taking into account recent price action. The 3-4 year cycle low appeared to be between the April and September 2001 lows. Reconsidering the action of last July-October, that was more likely the 3-4 year cycle low. The 4 year cycle actual price high was in January 2002. As opposed to the price high, the wave high is where the upper edgeband of the wave envelope contacts the upper band of the next longer wave. That was from last November, when speculative fever was at its peak, through early January, when we saw a second wave of speculative frenzy. The degree of speculative mania during the 3 month trading range in the fourth quarter of 2002 was consistent with a major 4 year cycle top. Cats, dogs, and pigs could fly. Doc now thinks this speculative 4 year cycle top could extend though mid year of 2003, and that repeated bursts of manic speculation such as we saw this week, will continue. Because of the sharp descent in the secular trend, the final high of the 3-4 year cycle will be lower than the high reached in January. The 3-4 year cycle is irrelevant for practical purposes. The power of the secular trend has suppressed it. The dominant cycle in recent years has been the nominal 18 month cycle. This cycle has a typical variance of 6 months, so that it can last from one to two years. The July-October double bottom was an 18 month cycle low. The 18 month cycle wave high is ideally due around mid-year but the price high was in December at 940. The current projection puts the wave high in mid-year 2003 around 880. After that, this cycle should turn relentlessly lower. The 2002 lows should be broken in the third or fourth quarter of this year. At the current secular trend rate of decline, the mid year 2004 low extrapolates to around 600. In the event of a panic low an extreme of 525 is possible. Currently the 10-12 month cycle is completing a top. The 6 month cycle is making a low. Churning is the typical result when these two cycles juxtapose. The 12 month cycle should be dominant, so that the general tilt will be slightly toward the downside. This should result in the up phase of the 6 month cycle playing out as a swup. But there could be huge swings within the channel. Doc thinks it will be necessary to focus on shorter term cycles for trading purposes. The third quarter of 2003 looks like a period with a high probability of extended decline. The 6, 10-12, and 18 month cycles all project to be in down phases during that period. As noted in this space last week, the index had moved to the bottom of the 18 month channel. The 13 week cycle down phase was expected to last into March or early April but with limited downside. This week's action reaffirmed that the remainder of the down phase should be shallow. That will only change if we see a big downturn this week. Even if that were to occur, a low below 780 is highly unlikely over the next two to four months. After one or more weak rallies following "successful retests" of the lows, there will be another 20% killer wave down in the second half of 2003. Check out the symmetry of the bubble's inflation and deflation. (Subject to
change without notice. Dealer title, tax, and tags not included. Consult
your local directory for prices in your area. Past performance is not necessary
to be a Wall Street analcyst.) The Cycle Conditions tables include cycle phase and a wild guess as to number of periods to the next turn, in days for the shortest cycles, weeks (W) or months (M) for the longer ones. This is a fluid exercise, in other words, the projections are likely to be wrong, but they force us to be vigilant for key turning points, and frequently work well enough to prevent costly misreadings. SPX Cycle Conditions as of 2/25/03
PTT - Periods Till Turn Suctor Watch and Stoolwethers- Updated each morning between 8 AM and 9:00 AM NY time. Nasgap Charts The Nas has been stronger than the SPX, but cycle direction and timing will be similar. In the interest of publishing the Anals earlier in the evening Doc is presenting the charts and data without commentary, as it is largely redundant relative to the SPX commentary above. Cycle Chart Long Term View 2/21/03 The Nas is stronger than the broad market, typical of the speculation during periods of major cycle tops. The 12 month cycle is forming a top. Both the 18 month and 3-4 year cycle highs appear due in the second quarter of 2003. The 3-4 year cycle low would be due no earlier than mid 2004 and possibly not until 2005. Ultimately the 3-4 year cycle low should be around 400, or below on a selling panic. After the following bull phase, the next bear phase will end with the Nasdaq folding, and the bigger stocks going over to the NYSE, perhaps in 2008 or 2009. Looks like the venerable Amex will be closed much sooner.
Nasdaq Cycle Conditions as of 2/25/03
PTT
- Periods Till Turn Suctor Watch and Stoolwethers- Updated each morning between 8 AM and 9:00 AM NY time. Long Bong Hit - See top of page. Golden Stool 2/25/03 PM Gold dipped.
Intermediate cmaps suggest that it could dip as low as 340 before a bottom
is in. Long term upside cmaps have come down, now at only
375 - 385.
The 9 month cycle oscillator looks like a top but the down phase should be
sideways. Doc
thinks accumulation has renewed, but that a trading range of 340-385 could
last many months.
Long Term 2/21/03- Doc projects gold to recover and make new highs in the second
half of 2003. HUI Dumpty dipped again. Short cycles have turned back down. Intermediate cycles are bottoming but cmaps declined slightly, with a low of 127 possible. This should be the last shakeout before another rally. Nice of them to back up the train to pick up stragglers. HUI Cycle Conditions as of 2/25/03
Long Term 2/21/03- After consolidating for a few months, HUI is expected to break out to the upside near mid-year.
Uncle Buck's Illness Uncle Buck was little changed after wild swings in the pre-market and early going Tuesday. He likes hanging around 100. Odd, considering the index is a basket of other currencies. Round numbers should be totally irrelevant. Opposed cycles could keep Buck locked in a range for weeks or months. The upside cmap on the 13 week cycle is 101. Shorter cycle downside cmaps are 99. Chart as of 2/25/03 close Uncle B and SPX (gray line on chart)
usually move together because Uncle Buck's index measures the flow of
capital into and out of US paper assets. The relative magnitude of the
moves varies and wide divergences are followed by convergence.
Central banks intervening to buy dollars are not
going to help stock prices, and cannot drive sustainable advances in the
dollar.
Longer Term 2/21/03 Buck is going much lower but perhaps not until the second
half of 2003. In the meantime he could churn around 100.
Here's another case where the 6 month and 10-12 month cycles may oppose
for a couple of months, leading to a trading range. Get StoolieSignal Special offer here only! Suctor Watch and Stoolwethers- Now posted on separate page. Updated each morning between 8 AM and 9:00 AM NY time. See you in Intraday Stool. Dr. Stepan N. Stool Share your thoughts on the Stool Pigeons Wire.
Renewals Thank you for subscribing to the Anals of Stock Proctology. Your trial subscription will run for 90 days. At the end of that period your subscription will renew automatically, unless you cancel. If you wish to cancel your subscription use the button below. If you want to renew your subscription do nothing. Your subscription will renew and your credit card or Paypal bank account will be charged. If you want to renew, be sure your credit card information in your Paypal account is current. Paypal will not renew your subscription if the card has expired!
Explanation of Intraday Commentary-Build charts at http://www.livecharts.com. For custom time bars insert a comma after symbol and number of minutes, e.g. compx,90. This will give you a bar chart of the Nas with 90 minutes per bar. The one day cycle is usually most clear with 8 minute bars and 26/18 stochastics. It varies from day to day. Sometimes 6 minutes works best. Experiment to find the best fit for your trading style, and the market's dominant frequency at the time. The goal here is primarily to monitor the condition of the 8 and 13 day cycles. I typically use 90 minute bars with 26/18 stochastics for the 13 day cycle proxy on the indices during regular trading hours. Other cycles use 26/18 stochastics with the following: 8 days- 60 minute bars On the 24 hour futures charts, use a time per bar approximately 3 to 4 times the above number of minutes, to represent the cycles listed above. About centered moving average projections. ABBREVIATIONS: cma: centered moving average |


 Long Term


![[Most Recent HUI from www.kitco.com]](http://www.weblinks247.com/indexes/idx24_hui_en_2.gif)
![[Most Recent XAU from www.kitco.com]](http://www.weblinks247.com/indexes/idx24_sp500_en_2.gif)
![[Most Recent Quotes from www.kitco.com]](http://kitconet.com/charts/metals/gold/t24_au_en_usoz_2.gif)