|
Archives 12/30/01, 1/1/02, 1/2/02, 1/3/02, 1/4/02, 1/7/02, 1/8/02, 1/09/02, 1/10/02, 1/11/02, 1/14/02, 1/15/02, 1/16/02, 1/17/02, 1/18/02, 1/22/02, 1/23/02, 1/24/02, 1/25/02, 1/28/02, 1/29/02, 1/30/02, 1/31/02, 2/1/02, 2/4/02, 2/5/02, 2/06/02, 2/7/02, 2/9/02, 2/11/02, 2/12/02, 2/13/02, 2/14/02, 2/16/02, 2/19/02, 2/20/02, 2/21/02, 2/23/02, 2/25/02, 2/26/02, 2/27/02, 2/28/02, 3/1/02, 3/04/02, 3/05/02, 3/06/02, 3/7/02, 3/10/02,3/11/02, 3/12/02, 3/13/02, 3/14/02, 3/15/02, 3/18/02, 3/19/02, 3/20/02, 3/21/02, 3/22/02, 3/25/02, 3/26/02, 3/28/02, 3/30/02 4/1/02, 4/2/02, 4/3/02, 4/4/02, 4/6/02, 4/8/02, 4/9/02, 4/10/02, 4/11/02, 4/13/02, 4/15/02, 4/16/02, 4/17/02, 4/18/02, 4/20/02, 4/22/02, 4/23/02,4/24/02,4/25/02, 4/26/02, 4/27/02, 4/29/02, 4/30/02 5/01/02, 5/2/02, 5/4/02, 5/6/02, 5/07/02, 5/8/02, 5/09/02, 5/10/02, 5/13/02, 5/14/02, 5/15/02, 5/16/02, 5/17/02, 5/20/02, 5/21/02, 5/22/02, 5/23/02, 5/24/02, 5/28/02, 5/29/02, 5/30/02 6/01/02, 6/3/02, 6/4/02, 6/5/02, 6/6/02, 6/7/02, 6/10/02, 6/11/02, 6/12/02, 6/13/02, 6/14/02, 6/17/02, 6/18/02, 6/19/02, 6/20/02, 6/22/02, 6/24/02, 6/25/02, 6/26/02, 6/27/02, 6/30/02 7/1/02, 7/4/02, 7/5/02, 7/11/02, 7/14/02, 7/15/02, 7/16/02, 7/17/02, 7/18/02, 7/19/02, 7/22/02, 7/23/02, 7/24/02, 7/25/02, 7/27/02, 7/29/02, 7/30/02 8/1/02, 8/3/02, 8/5/02, 8/6/02, 8/7/02, 8/8/02, 8/10/02, 8/12/02, 8/13/02, 8/14/02, 8/15/02, 8/16/02
|
The Anals of Stock ProctologyPublished weeknights by
8:30PM Happy Acres, Florida Time The American Academy of Stock Proctology and Is your subscription up for renewal? If you want to renew, do nothing, unless your credit card has expired. Please be sure your credit card info is current. If your credit card has expired, you must enter the new expiration date in your Paypal account in order for your subscription to be processed. If you subscribed via Paypal, your subscription will be renewed for one year on the 90 day anniversary of your sign-up and your credit card will be charged. If you want to cancel, use the button at the bottom of the page. This applies only if you subscribed through Paypal. Mailed-in subscriptions are for 1 year. If you subscribed by prior contribution, I will send you a notice before your subscription expires. If you have any questions, see the subscription page and FAQ's. If you can't find the answer, email me. PM Update 8/20/02 12:45 PM Terms and methodology Doc does not make trading recommendations. This update reports intraday time cycle estimates and centered moving average projections based on the Hurst cycle analysis method. Doc assumes no responsibility for the accuracy or inaccuracy of these estimates and projections. The market may or may not meet these projections. New stoolies should thoroughly familiarize themselves with the methodology before trading based on this method. There is no free lunch. Those who do not have the time or inclination to develop a trading strategy based on testing and research should not trade. Trade at your own risk. They stopped 'em dead where they had to to keep the bear case alive and kicking. The 1 day cycle should be in a down phase for the remainder of the day. The 5 and 8 day cycles have topped out but the down phase will be short. The 5 day cycle low is actually due today, but the 8 day cycle down phase could run into Friday with any luck. Initial cmaps for the 5-8 day cycles are preliminary minimums. Will know more after the first down is finished.
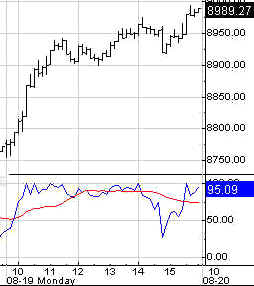
AM Update 8/20/02 9:15 AM Terms and methodology Fucutures are choppy, but a 1 day cycle low appears to be in on the all sessions charts. This is consistent with the 1 day cycle low put in yesterday around 3 PM. That does not mean we'll get big ups here. Instead. Doc is looking for churning as the 8 day cycle tops out, possibly in concert with the 13 day and 4 week cycles. Today is terribly important. If we see some weakness and churning, it is likely to be the beginning of the top building process. If not, more pain for bears lies ahead. The process will take days and weeks to play out. Patience will be required.
When You Fall In Love, And They Call Your Stock Away (8/19/02) They are getting close, but this ain't horse shoes. And, as much as I don't like it either, bears need to face facts. This is at least a six month cycle up phase which could lead to either months of sideways range-bound trading, or a continuation of this beam-me-up nonsense. Of course the fundamentals suck! If you hang your hat there as the basis for shorting the market, you are going to get burned. A huge pool of liquidity was built up on the way down. It's not enough to get the market back to where it was, but it's enough to get it part way there and there's more in the pipeline, regardless of what Al does. M3 and MZM are growing like Kudzu. Lots of call writers had their stocks called away. They're buying in stock to replace it. The corpses are announcing buybacks left and right. Even if they don't do it, the portfolio sphincters will, in anticipation of the corpses eating themselves into smaller bite size pieces. And of course, shorts are covering in droves. Furthermore, it's nearly 4 years since the last 4 year cycle low. Did you know that from a technical perspective, it's impossible to tell a big bear market rally apart from the first leg of a bull market? They both go up pretty much uninterrupted for four to six weeks. Only after the next cycle do you know for sure. Not that it matters. Any six month cycle up phase in a bear market has the potential to wipe out shorts and put players. We've been through this drill before. And not just in this bear market. Yes, we are still in a secular bear market. In the last secular bear market, the Dow went up 50% in 1970 and 1971. It went up by a third in 1972. Don't kid yourselves. Bear markets can look and act just like bull markets for long periods of time. For sure they are dysfunctional, but when liquidity is there to go into stocks, it can do it, REGARDLESS OF FUNDAMENTALS. In the middle of the worst depression in US history, as the US banking system was collapsing, the market doubled between July 1932 and 1933. It then retraced 3/4 of that in 9 months before FDR closed the banks for a couple of weeks in March of 1933. the market then took off in a bull move that laster FOUR YEARS, fercryinoutloud! That's right, it never broke the 1932 low, even though the US stayed in the grips of the Depression for 8 more years. So was the rally in 1932 the last bear market rally or the first rally in the 1932 to 37 bull market? What the hell difference does it make? It's all semantics, "bull market," "bear market rally." A six month cycle up phase can kill a short seller regardless of what phase the four year cycle or the K Wave are in. The question comes up, should I be long. Doc thought long and hard about that today and came up with this thought which he posted in Intraday Stool. Speaking personally for himself Doc said, "Never give in--never, never, never, never, in nothing great or small, large or petty, never give in except to convictions of honour and good sense. Never yield to force; never yield to the apparently overwhelming might of the enemy!" OK, so it's not original. Of course, Doc is a bear by birth and religion. If he were a neutral trader he'd look at the market now as being to late to go long, and too close to a 4 and 6-7, and possibly 10-13 week cycle high. He would wait patiently for the shortest cycle oscillators to correct some, regardless of whether the averages went flat or pulled back. Then as those indicators corrected, he might take a swing at doing a short term trade out of an 8 day cycle low on the hourly charts. Beyond that, he would dare not tread. As for the very short run, Doc thinks the market went up Monday because covered call writers were out there buying stock that got called away, and everybody else was in the Hamptons. That's a 1 day phenomenon. Some cycles' upside cmaps were hit at days end. If the market is ever going to pull back, Tuesday's the day. The Feed added $3.25 billion in 3 day repos. There were no expirations. $2 billion in 28 day repos expire Tuesday. How much of that the Fed rolls may be an important signal. Lately they have not been refunding 28 day repos in full. The Feed Index, which is the total
of all the Fed's paper holdings, is hugging the lower line of the 10%
growth channel, after hovering around it for several weeks. The gold lines
indicate that Al is in some kind of cautious, no-growth, holding pattern
over the last two months. Unless the total Feed continues to creep up
along the lower green channel line, the Index will signal a major policy
shift. For now, this may simply be a tactical pause. They are keeping us
in suspense. The Feedometer, which theoretically measures excess Feed available for jamming the market, is sitting dead on the center of its recent downtrend. This is an uncertain indication, which could go either way. Cynics would say that since the market did just fine today, Al will drain tomorrow. Of course, we all know that the Fed doesn't intervene in the markets in any way, nor do the markets dictate or even influence the Fed's Open "Market" Operations. The Fed is only interested in fighting inflation, and acting as lender of last resort. Right?
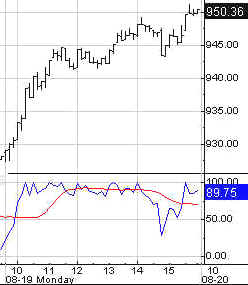
Portfolio Sphincters Index (SPX) and Sentiment
The VIX (aka the Fear Gauge) fell to 31.57. It is now in the upper channel of the inverted scale Stool Bands which are flattening, and could be in the process of turning higher. Is it a safe bet that the topping process has begun? No, not until we know for certain where those Stool Band projections are headed. That will take a few days and a reading of less than 30, at least. The superimposed 6-7 and
10-13 week cycle ozzies are skyrocketing. No turn there yet. The ROC's are
both strong. If the 29 day ROC goes above zero, Doc suspects the market
will go much higher, probably to the top of the long term channel at 1070.
And it might not take long. If a short term top forms at current levels
there's a shot that the market could top out between here and the central
regression line. The 10-12 month cycle oscillator is bottoming. The six month cycle is heading up. The 10-13 week cycle is heading up. Short cycles are in topping zones, but don't pull back. The cycle config is identical to last October. There's just one difference. The market is stronger this time around, tacking on 20% in four weeks, versus 15 % over four weeks off the September low. This could be the four year cycle upturn or it could simply be symptomatic of an out of control financial system in a derivatives meltup. If that's the case, it should start to be reversed, immediately, like, tomorrow would be good. The cmap projections have a
great deal of uncertainty due to the rapidity of this turn. The 13 day and
4 week cycles should top out here and now. The shape of their downturn
will tell us what we need to know about what lies beyond.
Fiber Nacho Upchuck levels. The Cycle Conditions tables include cycle phase and a wild guess as to number of periods to the next turn, in days for the shortest cycles, weeks (W) or months (M) for the longer ones. This is a fluid exercise, in other words, the projections are likely to be wrong, but they force us to be vigilant for key turning points, and frequently work well enough to prevent costly misreadings. SPX Cycle Conditions as of 8/19/02
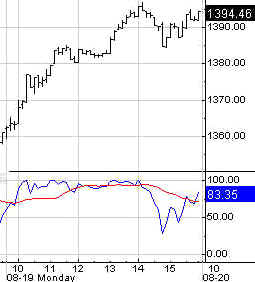
PTT - Periods Till Turn Nasgap Charts The 6 month cycle oscillator rose and the slower 10-12 month cycle oscillator, like the SPX, also flattened out of its downward trajectory. The first very preliminary upside cmap for the 6 month cycle high is 1445. These cycles are represented by the dark blue and light green channels on the price portion of the chart. Shorter term oscillators raced higher and the 29 day rate of change is now poised to move above the zero line, which if it occurs will affirm that the rally is going to have staying power. The slope of the phase is still not clear. It's positive, but we don't know how positive. The top of the 6 month cycle channel (Blue) and 10-12 month channel (green) could be right here. Short cycle cmaps are pointing to a top here at 1400.
The 10-13 week and short cycle oscillators rose again. They haven't
said "sell" yet. Bears are not out of the woods by a long
shot.
Fiber Nacho Reflux Levels: Busy busy. 1410 is a biggie. Nasdaq Cycle Conditions as of 8/19/02
PTT
- Periods Till Turn Golden Stool Gold stocks
got a little ahead of themselves and pulled back. Looks like they will
have to do more base building in the 110-15 area. The 13 day cycle
downside cmap is 113. AM Edition Features (Previous) These features are in morning edition, published around 9 AM ET US, or the Saturday Weak End Edition, published, uh, let's see, Saturday! Doc believes a major turn
is beginning. Uncle Buck's Illness Buck is overbought but will
try to retest high. Department of Yes, We Have No Inflation No inflation? Even economically sensitive
industrial metals prices turned up yesterday. This is a sign that the
explosion in broad money supply from the reignited mortgage bulge is
having the expected effect on the economy. As this liquidity flows into
the system everything moves (stock prices first, economic data last, but
not far behind.). Is it real economic activity or just a burst of
inflation. As always, your stock proctologist thinks it's Number Two. the 10-13 week cycle is
overbought as the center line of the trend is tested. Financials- 10-13 week
cycle getting overbought as major resistance (trend centerline) is tested. Consumer- Also testing
major resistance. Drugs- Also testing
resistance. Homebuilders- The bubble
meets resistance. Energy- Also meets
resistance. No surprise- Trannies lag. Retail bumping into major
resistance. SOX- Testing upper edge of
major trend channel. Soft Where- also testing
major downtrend channel. Nutworkers- Much weaker
sideways up phase. Internut- Testing long term
trend centerline. Telecoms- looks like
sideways up phase. AhOL- Major
reversal, or major fakeout? Citicrap-
10-13 week cycle entering top zone. CSCO-
Testing downtrend channel- Fannie heads
for top of channel. GE- Topping
out or breaking out. GM- Triangle
reversal just a fake? IBM- Heading
for major trend centerline INTC- Too
late to emerge from base? Some signs say go, others not. Mr. Bill-
Most signs point to upside breakout. WMT- Minor
resistance at 56 but should make 60. See you in Intraday Stool. Dr. Stepan N. Stool Share your thoughts on the Stool Pigeons Wire.
Renewals Welcome, and thank you for subscribing to the Anals of Stock Proctology. Your trial subscription will run for 90 days. At the end of that period your subscription will renew automatically, unless you cancel. If you wish to cancel your subscription use the button below. If you want to renew your subscription do nothing. Your subscription will renew and your credit card or Paypal bank account will be charged. If you want to renew, be sure your credit card information in your Paypal account is current. Paypal will not renew your subscription if the card has expired! Again, thanks for subscribing!
Explanation of Intraday Commentary-Build charts at http://www.livecharts.com. For custom time bars insert a comma after symbol and number of minutes, e.g. compx,90. This will give you a bar chart of the Nas with 90 minutes per bar. The one day cycle is usually most clear with 8 minute bars and 26/18 stochastics. It varies from day to day. Sometimes 6 minutes works best. Experiment to find the best fit for your trading style, and the market's dominant frequency at the time. The goal here is primarily to monitor the condition of the 8 and 13 day cycles. I typically use 90 minute bars with 26/18 stochastics for the 13 day cycle proxy on the indices during regular trading hours. Other cycles use 26/18 stochastics with the following: 8 days- 60 minute bars On the 24 hour futures charts, use a time per bar approximately 3 to 4 times the above number of minutes, to represent the cycles listed above. ABBREVIATIONS: cma: centered moving average |
||||||||||||||||||||||||||||||||||||||||||||||||||||||||||||||||||||||||||||||||||||||||||||||||||||||||||||||||||||||

![[Most Recent HUI from www.kitco.com]](http://www.weblinks247.com/indexes/idx24_hui_en_2.gif)
![[Most Recent XAU from www.kitco.com]](http://www.weblinks247.com/indexes/idx24_sp500_en_2.gif)
![[Most Recent Quotes from www.kitco.com]](http://kitconet.com/charts/metals/gold/t24_au_en_usoz_2.gif)