|
10 Minute Bar Charts 6/20/02 Dow Jokes Inflatables
Archives 12/30/01, 1/1/02, 1/2/02, 1/3/02, 1/4/02, 1/7/02, 1/8/02, 1/09/02, 1/10/02, 1/11/02, 1/14/02, 1/15/02, 1/16/02, 1/17/02, 1/18/02, 1/22/02, 1/23/02, 1/24/02, 1/25/02, 1/28/02, 1/29/02, 1/30/02, 1/31/02, 2/1/02, 2/4/02, 2/5/02, 2/06/02, 2/7/02, 2/9/02, 2/11/02, 2/12/02, 2/13/02, 2/14/02, 2/16/02, 2/19/02, 2/20/02, 2/21/02, 2/23/02, 2/25/02, 2/26/02, 2/27/02, 2/28/02, 3/1/02, 3/04/02, 3/05/02, 3/06/02, 3/7/02, 3/10/02,3/11/02, 3/12/02, 3/13/02, 3/14/02, 3/15/02, 3/18/02, 3/19/02, 3/20/02, 3/21/02, 3/22/02, 3/25/02, 3/26/02, 3/28/02, 3/30/02 4/1/02, 4/2/02, 4/3/02, 4/4/02, 4/6/02, 4/8/02, 4/9/02, 4/10/02, 4/11/02, 4/13/02, 4/15/02, 4/16/02, 4/17/02, 4/18/02, 4/20/02, 4/22/02, 4/23/02,4/24/02,4/25/02, 4/26/02, 4/27/02, 4/29/02, 4/30/02 5/01/02, 5/2/02, 5/4/02, 5/6/02, 5/07/02, 5/8/02, 5/09/02, 5/10/02, 5/13/02, 5/14/02, 5/15/02, 5/16/02, 5/17/02, 5/20/02, 5/21/02, 5/22/02, 5/23/02, 5/24/02, 5/28/02, 5/29/02, 5/30/02 6/01/02, 6/3/02, 6/4/02, 6/5/02, 6/6/02, 6/7/02, 6/10/02, 6/11/02, 6/12/02, 6/13/02, 6/14/02, 6/17/02, 6/18/02, 6/19/02
|
The Anals of Stock ProctologyPublished weeknights by
8:30PM Happy Acres, Florida Time The American Academy of Stock Proctology and PM Update 6/21/02 1 PM Terms and methodology Doc does not make trading recommendations. This update reports intraday time cycle estimates and centered moving average projections based on the Hurst cycle analysis method. Doc assumes no responsibility for the accuracy or inaccuracy of these estimates and projections. The market may or may not meet these projections. New stoolies should thoroughly familiarize themselves with the methodology before trading based on this method. There is no free lunch. Those who do not have the time or inclination to develop a trading strategy based on testing and research should not trade. Trade at your own risk. On the other hand, if you made any extra this week on account of The Stool, send it in! The averages are assaulting their 5 day cycle cmaps (which I adjusted down a bit) and a bottom is due today. However, in a trending market, these could melt like butter. For swing traders, I'd be inclined to overstay until there's clear evidence that the trend has reversed to the upside, such as a higher low and higher high, but that would depend on your time horizon. The 1 day and 5 hour cycle low timing is really difficult today. The problem is the trending. I'd focus on the price points of the cmaps and see how the market acts. Doc's perstalsis tic remote viewer feels that the market needs a good cleanout before a reversal to the upside can happen. The market still has a way to go over the next few weeks.
AM Update 6/21/02 9 AM Terms and methodology We're looking at a possible 5 day cycle low today that may or may not derail the downside express. A 5 hour cycle low appears to have been due at the close yesterday and a 1 day low is due around 11-11:30. Cmaps are slightly below yesterdays lowest levels. The problem is knowing whether the 5 hour or 1 day cycle will be dominant. The 11:30 time frame could also be a 5 hour cycle high. We'll just have to let the market tell us. Still have a low confidence level in the 5 day cmaps. If the first hour is weaker than the 1 day cmaps, then the 5 day projections will move down. Doc's peristalsis tic remote viewer says the market will be weaker than projections. Doc senses a spike in bear fear of jam this morning which he takes as a contrary indicator.
Chicken or Egg? (6/20/02) The poodits have finally caught on to the idea that the weakening dollar and declining stock market have something to do with one another. Doc told you a few months back that Uncle Buck is the stock market and vice versa. Both are liquidity meters measuring capital flows into and out of US assets. But here's how Abbottand Costello, Bob PissAnt and the rest of the gang over at Crapvision describe it. Foreigners are selling their stocks because the dollar is going down. Now, I know these people are mindless shills, but really... Give Dr. Stool a break. Stocks are dollar denominated assets. They are bought and sold for dollars. When foreigners sell stocks because the US markets are no longer a good deal, they bring the money home to Europe and Japan or wherever, and convert the dollars back into local currencies. The dollar began weakening at the same time as the stock market. Both made their final peaks in late March. In spite of the fact that the Crapvision crew just discovered it, this dollar weakness is not new. It is the reflection, not the cause, of the foreign selling of US stocks which began at the end of March. As the urgency to get out of stocks accelerates, stocks and the dollar will collapse together, the asset price deflation will spread to other sectors, and it gradually does become a self reinforcing process. But to attribute stock price weakness to dollar weakness is exactly backwards. As an aside, foreign money is not a factor in the housing market, but it is a factor in the Treasury and GSE securities markets which feed the housing bubble. Dollar weakness will indeed cause foreign selling in those markets which will ultimately trigger the implosion of the housing bubble. But make no mistake. Declining stock prices are the first manifestation of the decline and are the primary trigger for the chain reaction which lies ahead. The ocean of dollars is merely the mechanism of transmission. The Feed was neutral again today adding $2.5 billion in 7 day repos, while retiring $2.75 billion in overnight repos from Tuesday. They also rolled $5 billion in 28 day repos. On Thursday we reconcile our Total Feed estimate to the Fed's H4.1 release, which reflects the impact of matched sale purchase deals done during the week, not reported in the Fed's daily reports. It shows that the Fed's holdings of loans and securities dropped by $11 billion. No surprise to stoolies, but the drop was not quite as large as we had anticipated, based on the daily data. The total Feed is still at the trend
level which has triggered furious pumping in the last 15 months. The
question is, why didn't they pump yesterday and today? The Fed may be
changing tactics here, as the last few jams have had virtually no effect.
You can fool some of the people all of the time and all of the people some
of the time, but you can't fool all the people all the time. The jams
don't work any more, and the flood of dollars around the world has made
Uncle Buck real sick. Is Al willing to cut the stock market loose? The Slow Feedometer, which is the
17 day average of the daily excess Feed available to jam the market,
rolled over. Feeding had been effective in supporting the market since
last November. Beginning in May, that was no longer the case. Foreign
capital flight and massive distribution of stocks by corpses and their
officers, coupled with the the sheeple having been fooled one time too
many, are overwhelming forces. The jamming pushed bonds up over the last
couple of weeks, but could not help stocks. Capital flight may have
reached the point where bond prices start moving down as well. M1 was down in the week ended
June 10, again no surprise to stoolies following the Feed Index. The
amazing thing is that in spite of the Feed's furious pumping over the last
6 months, M1 is down on the year. Money is being destroyed faster than the
Fed can create it. That flushing sound you hear is the stock market
toilet. MZM is a broad measure of money
which includes money market funds. The effect of GSE money creation
through the MMF's is included in this measure. After enjoying a brief
spurt in April and May, the week ended June 10th reflects a 2 week stall.
The annual growth rate over the last 3 months is at 5%, compared with
20-25% growth last year. The credit bubble is clearly losing momentum, in
spite of record low interest rates. Credit demand is waning. The bubble is
in its final hours. Disaster looms. Money fund assets, the proverbial cash on the sidelines that Maria constantly reminds us about, have been shrinking since January. Where's the money going? It's getting flushed somewhere.
The liquidity picture is bad and is poised to get a lot worse as capital flight out of the US begins to accelerate.
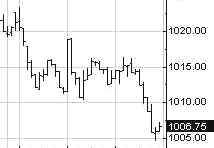
Portfolio Sphincters Index (SPX) and Sentiment The Sphincters Index dropped 14, right to the fibo level of 1006. The 17 day rate of change, which represents the 6-7 week cycle, is hugging its smoother in negative territory. The 6-7 week oscillator superimposed on the price chart, rose again after flashing a buy signal Wednesday. An up phase is under way in that cycle. Like Doc always says, "If this is the up phase, I can't wait to see the down." This only means "up" relative to the next larger cycle. If the larger cycles are falling hard, the up phase will be crushed, perhaps after a bounce off a test of last week's low. The 10-13 week cycle oscillator (navy) turned down again, as expected. Doc felt the upturn was only a blip because the timing wasn't right for a low in that cycle. It was probably the secondary reaction high in the 10-13 week cycle. The implication is that the 5-6 month and 10-12 month cycles are in the final, near vertical stage of their down phase, and will put relentless pressure on stocks for several more weeks. The 29 day rate of change is still in a flat pattern in negative territory, indicating a stable downtrend. A breakout from the range would be a powerful signal. The VIX rose to 32.50. On the inverted scale chart, VIX is nearing the intermediate buy signal band. Extreme fear tends to persist for several days at a 10-12 month cycle low. The current position is moving in that direction, but could be weeks away. The trend channel is accelerating down and a signal will not be generated until the index drops below the blue band for several days and then reverses. The final extremes at the bottom could be as low, or lower, than the levels reached in September. It does not pay to anticipate. The low will not be recognizable until after the turn. The blue channel lines are the extension of a linear
regression channel from the February and May 2001 highs. The 6 month cycle
oscillator remains close to an upturn, but close doesn't count. It must be a
definitive crossover. Anything less is just a tease. If the indicator turns, it has to be
respected and if it turns down again that too must be respected. But that also applies if it remains
in a flat trend at this level. That would indicate trending. The trading
stoolicator shows that the key trading cycle remains down. The short cycle oscillator
is beginning a downturn. The 10-13 week cycle oscillator is trending
gradually lower. The price action staged a classic return to the
scene of the crime (reaction rally to the point of breakdown), and is returning
to the direction of the trend. The centered moving average projections for
this cycle are 940-45. The drop on Thursday was a fiber nacho 61.8%
from Tuesday's high. Next stop on the way down is is 984. The Cycle Conditions tables include cycle phase and a wild guess as to number of periods to the next turn, in days for the shortest cycles, weeks (W) or months (M) for the longer ones. This is a fluid exercise, in other words, the projections are likely to be wrong, but they force us to be vigilant for key turning points, and frequently work well enough to prevent costly misreadings. SPX Cycle Conditions as of 6/20/02
PTT - Periods Till Turn Nasgap Charts The Nasgap
stunk out the joint for another 32 points to a new closing low of 1464 on
this leg. The 6 month
cycle time series may is beginning to accelerate down. The 10-13 week cycle
oscillator and the trading stoolicator may be doing likewise. The
Nascrap 100... what can you say? How about, next stop 1000? 1439 is
the next fibo number below last weeks low. I suspect it will just gap
that, but who knows. Maybe it will hold for a day or two. Nasdaq Cycle Conditions as of 6/20/02
PTT
- Periods Till Turn AM Edition Features (Previous) There are early signs that
a low in bond yields may be forming at the lower channel band. SOX- All
signs still point down, however, the 380-90 level may be temporary
support. Software
Index- The indicators are ideally positioned to signal a breakdown and
further severe losses. This pattern is common through virtually all tech
and telecom sectors. Small craps
are at a support level. Certain "interests" with a lot at stake
will fight to hold this level. Wally got to
resistance and reversed. We'll want to watch the 29 day rate of change and
10-13 week cycle indicator for signs that the intermediate sideways up
phase is over. Interestingly,
the same comment that I made for Wally applies to Mr. Bill. The key 10-13
week cycle indicators are very close to confirming a downturn, with the
stock having run up to multiple cycle channel resistance lines. MMM, a
mid-cap with only 391 million shares outstanding, is the most important
stock in the entire universe because it has the highest weighting in the
Dow. Looking at 10-13 week cycle mo (29 day r.o.c.) I'm going to stick my
neck out and say the top is in (with a stop at 131). JPM is the
stock stoolies most love to hate. It's in a downtrend and the short cycle
ozzie just reversed from the top zone. One of these days it's going to
have a big break. It has a bizarre trading pattern, but the conditions for
a break appear to be building. IBM. Speaks
for itself. A number of
stoolies like to play with fire, EMLX being a key example. The fire just
went out. Henceforth and forevermore, if you would like to request a "stock o'der", please post your request in Dear Dr. Stool. If you have not already registered for the message board, please do so. The only required info is user name and password which you choose yourself, and your email address, which you can keep private by selecting the keep private option. Doc looks forward to featuring your ideas. We've had some good ones! Uncle Buck's Illness
Uncle B is into major support. You can expect a concerted effort by
central banks to hold it here. There's no sign whatsoever that it will
work. Never has before. Golden Stool Doc is a
little skeptical about this recovery in the gold stocks. That's probably a
bullish sign. I'd like to see the ozzies turn positive again before
jumping back on the bandwagon. The long term trend however, is intact and
powerful. For long term holders who bought last year, the short term
gyrations are irrelevant. See you in Intraday Stool. Dr. Stepan N. Stool Let me know what you think on the Stool Pigeons Wire. Welcome To New Subscribers Welcome, and thank you for subscribing to the Anals of Stock Proctology. You may note some subtle differences in style now that this is no longer a free service. The perspective is still bearish, but it will have a more balanced approach than my message board ravings. You won't see me screaming "BUY" about anything except perhaps gold, but you will see stronger indications of areas and times when I think it might be a good idea to avoid being short. And I promise that I will lose my temper from time to time to keep you entertained! There's also a new feature, Doc's By Request Stock O' The Day. If you have a stock you're interested in, send an email to [email protected], naming the stock, and why you think Doc should look at it, in 25 words or less. 26 words, and you're disqualified! Those that look interesting, Doc will try to feature here within the next day or two. If you have suggestions about other features you'd like to see, send them along to [email protected]. Again, thanks for subscribing!
Explanation of Intraday Commentary-Build charts at http://www.livecharts.com. For custom time bars insert a comma after symbol and number of minutes, e.g. compx,90. This will give you a bar chart of the Nas with 90 minutes per bar. The one day cycle is usually most clear with 8 minute bars and 26/18 stochastics. It varies from day to day. Sometimes 6 minutes works best. Experiment to find the best fit for your trading style, and the market's dominant frequency at the time. The goal here is primarily to monitor the condition of the 8 and 13 day cycles. I typically use 90 minute bars with 26/18 stochastics for the 13 day cycle proxy on the indices during regular trading hours. Other cycles use 26/18 stochastics with the following: 8 days- 60 minute bars On the 24 hour futures charts, use a time per bar approximately 3 to 4 times the above number of minutes, to represent the cycles listed above. ABBREVIATIONS: cma: centered moving average |
|||||||||||||||||||||||||||||||||||||||||||||||||||||||||||||||||||||||||||||||||||||||||||||||||||||||||||||||

![[Most Recent XAU from www.kitco.com]](http://www.weblinks247.com/indexes/idx24_nasdaq_en_2.gif)
![[Most Recent XAU from www.kitco.com]](http://www.weblinks247.com/indexes/idx24_sp500_en_2.gif)
![[Most Recent Quotes from www.kitco.com]](http://kitconet.com/charts/metals/gold/t24_au_en_usoz_2.gif)
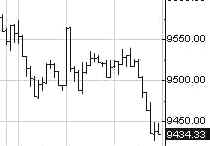
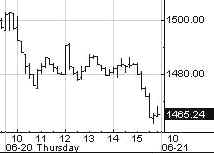
 The
Dow ended down 130 at 9434. It came unglued in the afternoon, and the
Dow's stage managers, who most assuredly are heavily short, stepped
aside. Institutions are fully invested, foreigners are pulling out, and
the Sheeple are no longer dutifully sending in new money. The Feed even
appears to have surrendered. It's all downhill from here, barring a
miracle.
The
Dow ended down 130 at 9434. It came unglued in the afternoon, and the
Dow's stage managers, who most assuredly are heavily short, stepped
aside. Institutions are fully invested, foreigners are pulling out, and
the Sheeple are no longer dutifully sending in new money. The Feed even
appears to have surrendered. It's all downhill from here, barring a
miracle.