|
10 Minute Bar Charts 7/22/02 Dow Jokes Inflatables
Archives 12/30/01, 1/1/02, 1/2/02, 1/3/02, 1/4/02, 1/7/02, 1/8/02, 1/09/02, 1/10/02, 1/11/02, 1/14/02, 1/15/02, 1/16/02, 1/17/02, 1/18/02, 1/22/02, 1/23/02, 1/24/02, 1/25/02, 1/28/02, 1/29/02, 1/30/02, 1/31/02, 2/1/02, 2/4/02, 2/5/02, 2/06/02, 2/7/02, 2/9/02, 2/11/02, 2/12/02, 2/13/02, 2/14/02, 2/16/02, 2/19/02, 2/20/02, 2/21/02, 2/23/02, 2/25/02, 2/26/02, 2/27/02, 2/28/02, 3/1/02, 3/04/02, 3/05/02, 3/06/02, 3/7/02, 3/10/02,3/11/02, 3/12/02, 3/13/02, 3/14/02, 3/15/02, 3/18/02, 3/19/02, 3/20/02, 3/21/02, 3/22/02, 3/25/02, 3/26/02, 3/28/02, 3/30/02 4/1/02, 4/2/02, 4/3/02, 4/4/02, 4/6/02, 4/8/02, 4/9/02, 4/10/02, 4/11/02, 4/13/02, 4/15/02, 4/16/02, 4/17/02, 4/18/02, 4/20/02, 4/22/02, 4/23/02,4/24/02,4/25/02, 4/26/02, 4/27/02, 4/29/02, 4/30/02 5/01/02, 5/2/02, 5/4/02, 5/6/02, 5/07/02, 5/8/02, 5/09/02, 5/10/02, 5/13/02, 5/14/02, 5/15/02, 5/16/02, 5/17/02, 5/20/02, 5/21/02, 5/22/02, 5/23/02, 5/24/02, 5/28/02, 5/29/02, 5/30/02 6/01/02, 6/3/02, 6/4/02, 6/5/02, 6/6/02, 6/7/02, 6/10/02, 6/11/02, 6/12/02, 6/13/02, 6/14/02, 6/17/02, 6/18/02, 6/19/02, 6/20/02, 6/22/02, 6/24/02, 6/25/02, 6/26/02, 6/27/02, 6/30/02 7/1/02, 7/4/02, 7/5/02, 7/11/02, 7/14/02, 7/15/02, 7/16/02, 7/17/02, 7/18/02, 7/19/02
|
The Anals of Stock ProctologyPublished weeknights by
8:30PM Happy Acres, Florida Time The American Academy of Stock Proctology and Is your subscription up for renewal? If you want to renew, do nothing. If you subscribed via Paypal, your subscription will be renewed for one year on the 90 day anniversary of your sign-up and your credit card will be charged. If you want to cancel, use the button at the bottom of the page. This applies only if you subscribed through Paypal. Mailed-in subscriptions are for 1 year. If you subscribed by prior contribution, I will send you a notice before your subscription expires. If you have any questions, see the subscription page and FAQ's. If you can't find the answer, email me. PM Update 7/23/02 12:45 PM Terms and methodology The 1 day cycle may not be an issue here. Right now I'm focusing on a 4-5 hour wave the bottom of which appears due around 2:30, and the ending of the 8 day cycle which is due today, but will it? I have no idea. Nor do I have any idea if the 5 hour cycle will really bounce. Let's just say I doubt it. The 8 day cycle low projections are stable since this morning. The low is due today. Doc does not make trading recommendations. This update reports intraday time cycle estimates and centered moving average projections based on the Hurst cycle analysis method. Doc assumes no responsibility for the accuracy or inaccuracy of these estimates and projections. The market may or may not meet these projections. New stoolies should thoroughly familiarize themselves with the methodology before trading based on this method. There is no free lunch. Those who do not have the time or inclination to develop a trading strategy based on testing and research should not trade. Trade at your own risk. On the other hand, if you made any extra this week on account of The Stool, send it in!
AM Update 7/23/02 9:00 AM Terms and methodology The overnight fucutures rally is fizzling just before 9 AM. Those wild and crazy Europeans sure had things cooking there for awhile. Since the futures are back near where they started last night, Doc will ignore them and base the projections below on yesterday's market action. Looking for lower lows again today, in concert with an 8 day cycle low that's a bit overdue. Doc will be out of the office for a few hours, so the projections are proven wrong is wrong, he'll be hanging out there for awhile, heh heh. No excuses this time!
Street Discovers Fundamental Truths 7/22/02 The buzzwords around the Street these days are that the stock market is decoupled from the economy and and that the market is irrational. Yeah, so? The problem is that the poodits would have you think that this is something new, when nothing could be farther from the truth. The markets are ALWAYS irrational, and when they seem to have some relationship to the economy it's an accident. Stocks go up when there's excess liquidity, in other words, when money is burning a hole in people's pockets. They go down when there isn't enough liquidity and both the corpses, mental institutions, and households need to liquidate to meet day to day obligations, or to preserve something for an impoverished retirement. It just so happens that sometimes the economy is growing while liquidity is increasing, so stocks go up. That's when the analcysts think the market is rational and coupled with the economy. Let's just say that's a perceptual illusion, because the two chains of events happen to be concurrent. Sometimes liquidity is increasing while the economy is contracting. Stocks go up. At other times, the economy is nominally growing while it is choking for liquidity, like now. Stocks go down. There are also times when the economy is choking, and so is the market. I guess the poodits would be happy then. That's part of the reason now why some erstwhile bulls are beginning to make noises that the economy is going to double dip. Because that theory gives them a rationale for the market's behavior. Hey boys and girls, whatever floats your boat. We all know that emotions are involved, and that at extremes the market and emotions stretch like a bungee cord. Sometimes the bungee snaps back and sometimes the bungee breaks. This could be one of those times when it breaks. Wall Street and the investment industry are trotting out the same old tired advice day after day, after day. Don't panic, diversify, review your portfolio, re-evaluate your goals. Now what the hell does that mean, re-evaluate your goals? The poodits are doing everything in their power to keep the public in the market, thereby assuring that the bungee will continue to stretch and stretch and stretch without relief. What they are doing is self defeating. Because, unless enough people take money out, there will not be enough liquidity built up to generate a big rally. The problem, which none of the financial infomercial media outlets bothers to address, is that the poodits of whom the questions are asked all get paid only if they keep control of the money. That's why, with every leg down in this bear market, they say "don't panic," and with every rally they say, "the bottom is in." Because if they lose control of the money, they lose their livelihood. It is why their advice is always bad. They get paid to lie, not tell the truth. So, now, are we close to the bottom or not? There are conflicting indications. As the market dives, there's actually no clear sign that the bottom is any closer than it was last week. That's not to say it isn't, just that the signs Doc watches aren't quite there yet. It's going at least a little lower, and a very short cycle low is due by Wednesday. But there could also be yet one more subsequent plunge before this intermediate wave is finished. Finally, it pays to keep in mind that the 1929-32 bear market lasted 35 months from high to low, that there were 7 distinct waves down, and that the market lost 90% of its value. So if you are thinking we are looking at extremes here, think again. The Feed added a net of only $750 million today using $3.5 billion in 3 day repos to refund $2.75 billion in weekend repos. Nothing is maturing tomorrow. Look for another Feed tomorrow. Not hat it will matter. The Feed still has room to jam, and
more than enough reason. But so far Al is sitting on his you know what.
His moves have been incredibly small, under the circumstances. Last summer the Fed pumped for 2
1/2 months to no avail. Then after September 11 they opened the
flood gates. It took another two weeks for the market to turn. This summer
looks like a replay. Al's been feeding for two months, all for naught.
Expect the floodgates to open any day now. This time the catalyst won't be
a terrorist strike. This time it will be financial chaos. The problem now
is that the Feeding tubes, i.e. the Gang of 22 primary dealers are almost
certainly themselves impaired. We are in a dangerous and unpredictable
situation.
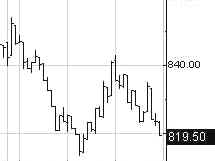
Portfolio Sphincters Index (SPX) and Sentiment The Sphincters Index spewed another 28, breaking below 820. The drop sent the cmaps lower again, to the mid 700s, as they stay one step ahead of the collapse. The 17 day rate of change, which represents the 6-7 week cycle, suffered another smash down. It is nearing the level reached at the September low. The superimposed 6-7 week cycle oscillator (red) continued to head down. The 29 day rate of change also dove to within a hair of the September low. This indicator should stabilize and turn up ahead of price when the 10-13 week cycle turns. The 10-13 week cycle oscillator (navy) broke to another new low for this move. All momentum based indicators are in gear to the downside, and they are all in a position to break the September lows, which could signal an all out crash. The VIX rose to 48.23, having hit the outer edge of the Stool Band projection channel on the inverted scale chart. At a major low, extreme fear readings normally persist for several days. A buy signal is generated when the index drops below the blue band and then reverses. Look back at the September low, when VIX remained outside the channel for 5 days before reversing. At this point it looks like it will meet or exceed the extremes reached in September. The problem with this, or any other sentiment indicator, is that we won't know where the extreme is until after the index finally turns. The chart should be read just as you would a stock price chart. The trend is your friend, and we have no idea whatsoever, what is truly extreme on this index. Hell, 99.99% of us can't even explain how the damn thing is constructed. So don't hang your hat on this indicator. At best, it's confirmation. The blue channel lines are the extension of a linear
regression channel from the September 2000 and March 2002 highs. The 6 month cycle
oscillator broke back below its lag line. The trading
stoolicator did the same, triggering renewed sell signals after last
week's hesitation. The short cycle oscillator dropped
sharply and has reached the levels which have generated bounces in the
past. In this environment, a bounce is by no means a sure thing this time.
The 10-13 week cycle oscillator also continued its fall at an
accelerated rate.
The indicators are in gear to the downside. There is no sign of an upturn
in the market. The next fiber nacho
dump level is a really big one - 800. After that 750-60 The Cycle Conditions tables include cycle phase and a wild guess as to number of periods to the next turn, in days for the shortest cycles, weeks (W) or months (M) for the longer ones. This is a fluid exercise, in other words, the projections are likely to be wrong, but they force us to be vigilant for key turning points, and frequently work well enough to prevent costly misreadings. SPX Cycle Conditions as of 7/22/02
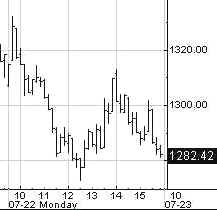
PTT - Periods Till Turn Nasgap Charts The Nasty
finally dropped out of its sideways up phase, losing 36 to 1283. The
decline should reaccelerate from here. The
10-13 week cycle oscillator is beginning to roll over again, and has
room to drop. The short cycle oscillator fell hard for the second day. Cmaps now point to 1200
or below, with the 5-6 month cycle cmap pointing to as low as 1100. The Nasty
is suspended between fiber nacho barf levels of 1300 and 1235-45. Those
numbers act as magnets. 1235-40 also has gravity in its favor. So does
1200. Nasdaq Cycle Conditions as of 7/22/02
PTT
- Periods Till Turn AM Edition Features (Previous) These features are in morning edition, published around 9 AM ET US, or the Saturday Weak End Edition, published, uh, let's see, Saturday!. The collapse in bond yields has just been reaffirmed by downturns in the oscillators. The next step is a retest of the October lows.
The washing
out of the dirty SOX has barely begun. It's still in a sideways up phase
aka "spin cycle.". Aerospace-
In the war against terrorism, seems more ships, tanks and planes are not
the answer. Should this collapse have been a surprise? Not based on this
chart, which showed months of distribution preceding this debacle. Bonkers-
There was also plenty of warning that the financials were about to break
down, and no sign yet of even a short term low, let alone a major low. In
all these broken charts, time will be needed for base building before a
new uptrend can begin.. Con-sumer
stocks keep breaking down trend channels in a stunning collapse, leaving
us to wonder whether the bungee has stretched too far for a snapback. Note
again, the ample warning of impending weakness. Having broken the major
channel, this would be a logical place to make a stand, but we'll have to
let the indicators guide us. Retail is
the same story. The Drug
Index is one of the reasons Doc raised the question of the end of
innovation. It just continues to break down through channel projections. Homebuilders-
Bubble? What bubble? Fear not. Value Line is super bullish on builders. HMOs. Doc's
theory is that levels formerly known as support act will like accelerants
in this bear market. The HMOs are at an important level formerly known as
support so it will be interesting to see if the theory holds up. Most tech
groups like Networkers illustrate the principle of the sideways up phase.
There's another breakdown ahead. Telecoms are
still in a sideways up phase in an orderly decline. So is this the first
sign of trend repair, or just prelude to another step down? Give it a few
weeks. Energy
stocks. This is a crash, plain and simple. There is big big trouble here.
What is it? We'll know soon enough. You sell
what you can, especially Wally. JPM just
broke below its descending major channel. Where's the support? Where's the
Dover Sole? GM- What had
been a linear trend just accelerated. Mr. Bill illustrates
what happens when you break down a long sideways up phase. Next comes the
assault on the lower edge of the long term trend channel. That will be
broken too. IBM- Another
sideways up phase, which, when it ends, will lead to the break down of the
major downtrend channel. GE is headed
for the bottom of its long term channel in the low 20's and will break it
before this is all over. Fannie has
FINALLY broken down from the enormous top which began forming in November
2001. Henceforth and forevermore, if you would like to request a "stock o'der", please post your request in Dear Dr. Stool. If you have not already registered for the message board, please do so. The only required info is user name and password which you choose yourself, and your email address, which you can keep private by selecting the keep private option. Doc looks forward to featuring your ideas. We've had some good ones! Uncle Buck's Illness Buck is "swuppin."
Golden Stool Is that a good
buy signal in the 10-13 week cycle mo (29 day rate of change). If not, HUI
is headed back to 105. Gold's getting crushed this morning. It doesn't
look good. See you in Intraday Stool. Dr. Stepan N. Stool Let me know what you think on the Stool Pigeons Wire. Renewals Welcome, and thank you for subscribing to the Anals of Stock Proctology. Your trial subscription will run for 90 days. At the end of that period your subscription will renew automatically, unless you cancel. If you wish to cancel your subscription use the button below. If you want to renew your subscription do nothing. Your subscription will renew and your credit card or Paypal bank account will be charged. Again, thanks for subscribing!
Explanation of Intraday Commentary-Build charts at http://www.livecharts.com. For custom time bars insert a comma after symbol and number of minutes, e.g. compx,90. This will give you a bar chart of the Nas with 90 minutes per bar. The one day cycle is usually most clear with 8 minute bars and 26/18 stochastics. It varies from day to day. Sometimes 6 minutes works best. Experiment to find the best fit for your trading style, and the market's dominant frequency at the time. The goal here is primarily to monitor the condition of the 8 and 13 day cycles. I typically use 90 minute bars with 26/18 stochastics for the 13 day cycle proxy on the indices during regular trading hours. Other cycles use 26/18 stochastics with the following: 8 days- 60 minute bars On the 24 hour futures charts, use a time per bar approximately 3 to 4 times the above number of minutes, to represent the cycles listed above. ABBREVIATIONS: cma: centered moving average |
|||||||||||||||||||||||||||||||||||||||||||||||||||||||||||||||||||||||||||||||||||||||||||||||||||||||||||||||

![[Most Recent XAU from www.kitco.com]](http://www.weblinks247.com/indexes/idx24_nasdaq_en_2.gif)
![[Most Recent XAU from www.kitco.com]](http://www.weblinks247.com/indexes/idx24_sp500_en_2.gif)
![[Most Recent Quotes from www.kitco.com]](http://kitconet.com/charts/metals/gold/t24_au_en_usoz_2.gif)
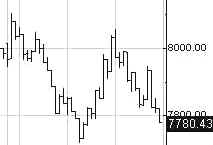
 Another
day, another meltdown, as the Dow Jokes, formerly known as the Dow
Inflatables, lost another 235 points to settle at 7785. With the key 10-13 week trading cycle entering its 13th week,
the cycle low could come at any time this week. Or it could extend
beyond the normal 13 weeks. Look at the chart at left. What if, I say what
if, the cycle low was actually the first week in July? Yecchh.
Another
day, another meltdown, as the Dow Jokes, formerly known as the Dow
Inflatables, lost another 235 points to settle at 7785. With the key 10-13 week trading cycle entering its 13th week,
the cycle low could come at any time this week. Or it could extend
beyond the normal 13 weeks. Look at the chart at left. What if, I say what
if, the cycle low was actually the first week in July? Yecchh.