|
Archives 12/30/01, 1/1/02, 1/2/02, 1/3/02, 1/4/02, 1/7/02, 1/8/02, 1/09/02, 1/10/02, 1/11/02, 1/14/02, 1/15/02, 1/16/02, 1/17/02, 1/18/02, 1/22/02, 1/23/02, 1/24/02, 1/25/02, 1/28/02, 1/29/02, 1/30/02, 1/31/02, 2/1/02, 2/4/02, 2/5/02, 2/06/02, 2/7/02, 2/9/02, 2/11/02, 2/12/02, 2/13/02, 2/14/02, 2/16/02, 2/19/02, 2/20/02, 2/21/02, 2/23/02, 2/25/02, 2/26/02, 2/27/02, 2/28/02, 3/1/02, 3/04/02, 3/05/02, 3/06/02, 3/7/02, 3/10/02,3/11/02, 3/12/02, 3/13/02, 3/14/02, 3/15/02, 3/18/02, 3/19/02, 3/20/02, 3/21/02, 3/22/02, 3/25/02, 3/26/02, 3/28/02, 3/30/02 4/1/02, 4/2/02, 4/3/02, 4/4/02, 4/6/02, 4/8/02, 4/9/02, 4/10/02, 4/11/02, 4/13/02, 4/15/02, 4/16/02, 4/17/02, 4/18/02, 4/20/02, 4/22/02, 4/23/02,4/24/02,4/25/02, 4/26/02, 4/27/02, 4/29/02, 4/30/02 5/01/02, 5/2/02, 5/4/02, 5/6/02, 5/07/02, 5/8/02, 5/09/02, 5/10/02, 5/13/02, 5/14/02, 5/15/02, 5/16/02, 5/17/02, 5/20/02, 5/21/02, 5/22/02, 5/23/02, 5/24/02, 5/28/02, 5/29/02, 5/30/02 6/01/02, 6/3/02, 6/4/02, 6/5/02, 6/6/02, 6/7/02, 6/10/02, 6/11/02, 6/12/02, 6/13/02, 6/14/02, 6/17/02, 6/18/02, 6/19/02, 6/20/02, 6/22/02, 6/24/02, 6/25/02, 6/26/02, 6/27/02, 6/30/02 7/1/02, 7/4/02, 7/5/02, 7/11/02, 7/14/02, 7/15/02, 7/16/02, 7/17/02, 7/18/02, 7/19/02, 7/22/02, 7/23/02, 7/24/02, 7/25/02, 7/27/02, 7/29/02, 7/30/02 8/1/02, 8/3/02, 8/5/02, 8/6/02, 8/7/02, 8/8/02, 8/10/02, 8/12/02, 8/13/02, 8/14/02, 8/15/02, 8/16/02, 8/19/02, 8/20/02, 8/21/02, 8/22/02, 8/23/02, 8/26/02, 8/27/02, 8/28/02, 8/29/02, 8/30/02 9/3/02, 9/4/02, 9/5/02. 9/6/02, 9/9/02, 9/10/02, 9/11/02, 9/12/02, 9/13/02, 9/16/02, 9/17/02, 9/18/02, 9/19/02, 9/20/02, 9/23/02, 9/24/02, 9/25/02, 9/26/02, 9/27/02, 9/30/02 10/1/02, 10/2/02, 10/3/02, 10/4/02, 10/7/02, 10/8/02, 10/9/02, 10/10/02, 10/11/02, 10/14/02, 10/15/02, 10/16/02, 10/17/02, 10/18/02, 10/21/02, 10/22/02, 10/23/02, 10/24/02, 10/25/02, 10/28/02, 10/29/02, 10/30/02, 10/31/02 11/1/02, 11/4/02, 11/5/02, 11/6/02, 11/7/02, 11/8/02, 11/11/02, 11/12/02, 11/13/02, 11/14/02
|
The Anals of Stock ProctologyPublished weeknights by
8:30PM Happy Acres, Florida Time The American
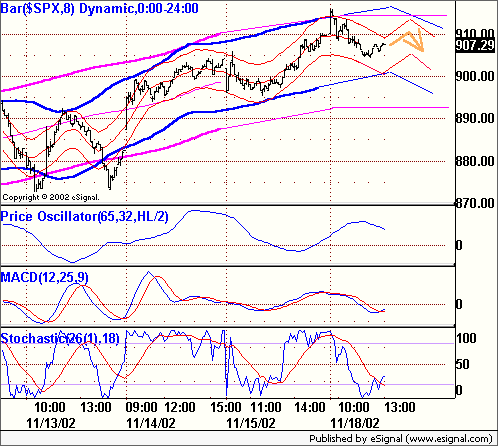
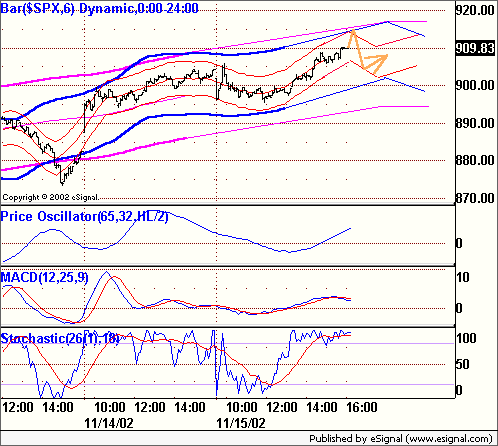
Academy of Stock Proctology and Is your subscription up for renewal? If you want to renew, do nothing, unless your credit card has expired. Please be sure your credit card info is current. If your credit card has expired, you must enter the new expiration date in your Paypal account in order for your subscription to be processed. If you subscribed via Paypal, your subscription will be renewed for one year on the 90 day anniversary of your sign-up and your credit card will be charged. If you want to cancel, use the button at the bottom of the page. This applies only if you subscribed through Paypal. Mailed-in subscriptions are for 1 year. If you subscribed by prior contribution, I will send you a notice before your subscription expires. If you have any questions, see the subscription page and FAQ's. If you can't find the answer, email me. Doc does not make trading recommendations. This update reports time cycle estimates and centered moving average projections based on the Hurst cycle analysis method. This publication is for entertainment and educational purposes only. Doc assumes no responsibility for the accuracy or inaccuracy of the estimates and projections presented. The market may or may not meet the projections. Stoolies should thoroughly familiarize themselves with the methodology before trading based on this method. Those who do not have the time or inclination to develop a trading strategy based on testing and research should not trade. Trade at your own risk. Yadda yadda. How's your motha? Be a Johnny Applestool! Help spread the Stool! Feel free to repost snippets from the Anals on message boards around the web. Just give a link back! Many tanks - Doc Mid Day Update 11/18/02 1 PM Doc did such a good job on the cycle map posted Saturday, perhaps he should quit while a head. Because sooner or later he will look like an ass. The SPX followed the orange line, right to the tip of the arrow. Now what? A weak (so far) 5 hour and 1 day cycle up phase is under way. Highs are due at 2:45 and tomorrow's open, but if the highs come sooner, bigger cycles are rolling over. Doc believes that to be the case as both the 5 and 8 day cycle ozzies are rolling over. The upside cmaps for those cycles based on intraday charts are around 915-916. Doc doesn't know whether those highs will be retested. As long as there's no new high, no harm done. Here's what the PM might look like. There are several plausible scenarios. This is the one Doc likes best at the moment. 5-8 Day Cycle______ 2-3 Day Cycle_______ 5 Hr-1 Day Cycle
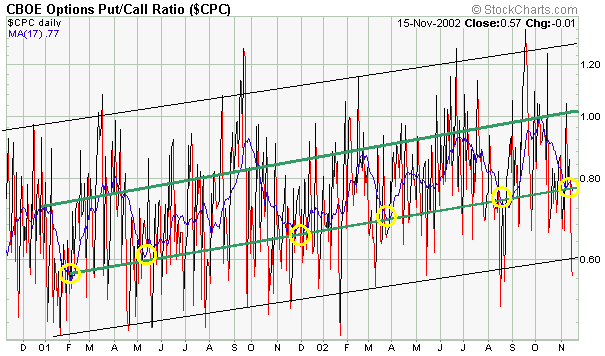
Pre Market Outlook (11/18/02) 9:15 AM With the fucutures at 917 Doc will stick with the outlook posted Saturday. Bears Suicidal (11/15/02) It's scary out there. It feels like the market wants to go higher. Panic reigns in the Stool Army. Several of its generals have abandoned the troops. Our admirals are jumping ship. Mutiny is in the air. Our Native American chieftains call out, "We're the Facawi." Our options waste away to nothing. Gloom, and defeatism are rampant. Our losses mount. That's the good news. Successful trading is counter intuitive. Feelings may be the best contrary indicator we have. Why do we "feel" this way? Simply because it seems like the market has been going up endlessly, refusing to pull back. Our minds tend to project the immediate past indefinitely into the future. Especially when the immediate past has been a one way street for 5 weeks. This kind of pervasive black mood is the mirror of what we felt in the beginning of October. It is the very same feeling the bulls felt at that time. Despair. But when we look at the indicators what do we see? Long term price trends are unbroken. Long term sentiment trends are likewise intact, with sentiment reaching the trend extremes normally seen at tops. The suffering we currently feel is consistent with that kind of price and sentiment extreme. Putzcall with 17 Day Moving
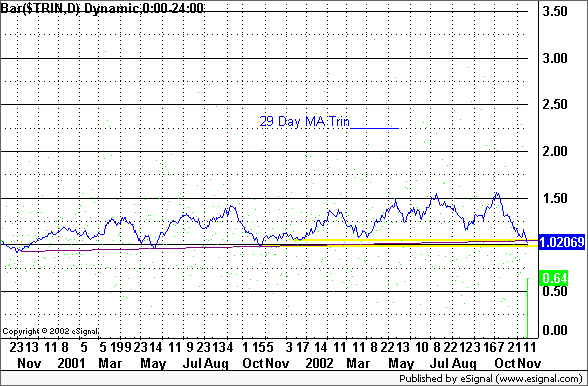
Average 29 Day Moving Average of TRIN
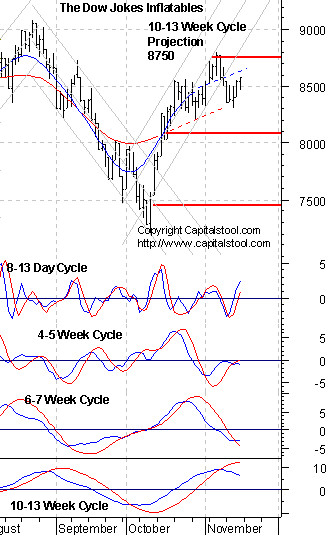
(aka Dickarms) The next few weeks and months are going to have their share of pain, certainly. Could this be the kind of top we saw in August, or the kind we saw from last December to March? Monday may hold the answer. A blowoff reversal day would be nice, but we may not get it. The longer they can hold near current levels this week, the better the chances of a trading range lasting months. We should be prepared for that. It seems like the more likely scenario, and might look like the cycle maps below. An immediate reversal and decline is less likely, and a breakout to new highs is the least probable outcome. In any event, the worst should be over within a day or two, as the resetting of options arbitrages is completed.
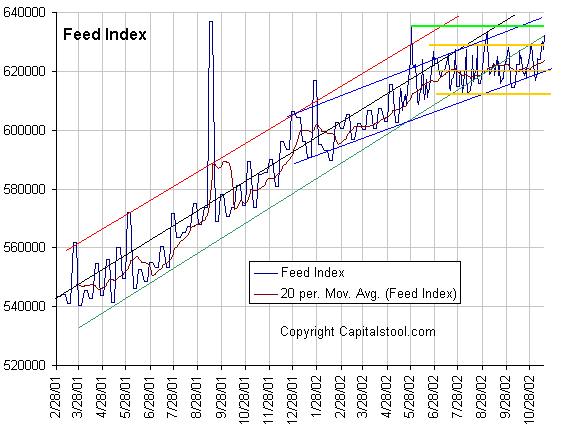
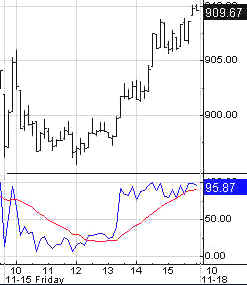
The Feed did $5.25 billion in weekend repos, with no expirations Friday. The $40 billion payment for the new Treasury Notes did not disrupt the stock market, after all. In the end the bond market bore the brunt. It was a brutal week there with yields rising 25 bp's. A total of $11.5 billion in short term repos will be expiring on Monday. There's no bout a doubt it now, Feed fans. Feed is busting out all over after Friday's massive jam job. It didn't help the markets, although the selloff in the bond market surely would have been worse had not Al pumped as much as he did last week Since November 5, the day before the auctions, the Feed added a staggering $15.75 billion net to the coffers of the Gang of 22. Need I point out to you that both the stock and bond markets are lower than they were on November 5? So what good is all this Feeding? And what happens Monday with an $11.5 billion rollover coming up? Three
trends are evident on the Feed Index, which is the total Fed holdings of
loans and securities. One is the 10% growth trend beginning in May of
2001. Feed growth has recently been at or below the lower boundary of that
trend. The blue channel going back to last December suggests that Al may
now be targeting an 8% growth rate. Then there's the golden box which says
he's stopped growing Feed altogether over the last five months. The Feedometer shows that the pumping began in late October, after the stock market had already moved. Three weeks of pumping has bought the Fed nothing. Further pumping is likely to be increasingly unproductive and even counter productive if the bond boys believe it's inflationary. The PPI increase announced Thursday is certainly going to get them thinking, to say nothing of the strength in gold. The
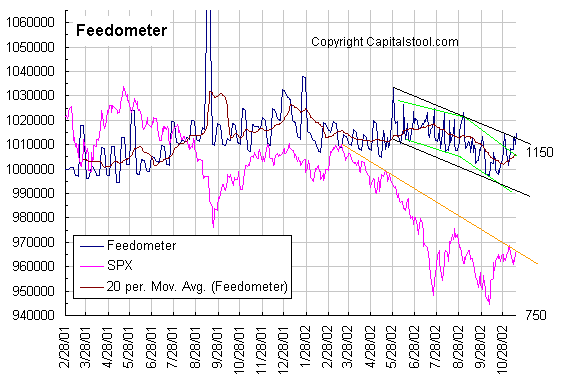
Feedometer theoretically
measures excess Feed available for bond or stock market jamming. The wild
volatility in the bond market continued. Yields closed above the
opening gap, but near the day's low. This looks like a sideways down
phase in the 10-13 week cycle. The 6 and 12 month cycle oscillators are strengthening.
It should take 4-6 more weeks before yields stage an upside breakout, but
whenever they move above 4.80, the long term trend turn will be confirmed.
Bond yields could be winding up for a powerful and lasting move up. We
should know for sure by the end of the year.
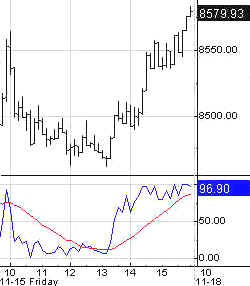
Intraday Outlook - 1 day cycle projections of 909 were hit at Friday's close. We are however still looking at projections of 910 to 925 on the 5 and 8 day cycle charts. We can assume that on balance there were more call than put exercises, and the players will want to reinstitute the covered writes. Needless to say, naked writers will be in the market buying as well. This would be a setup for a blowoff on Monday morning. Expect a lot of volatility and irregular cyclicality. Doc will look for a high of 915-925 in the AM, and a retest in the afternoon. The cycle map is drawn on the low side of the projection. If they blow off to 925, it wouldn't change the big picture. Doc will make changes based on Monday AM futures, if called for. 5-8 Day Cycle______ 2-3 Day Cycle_______ 5 Hr-1 Day Cycle
All of Doc's
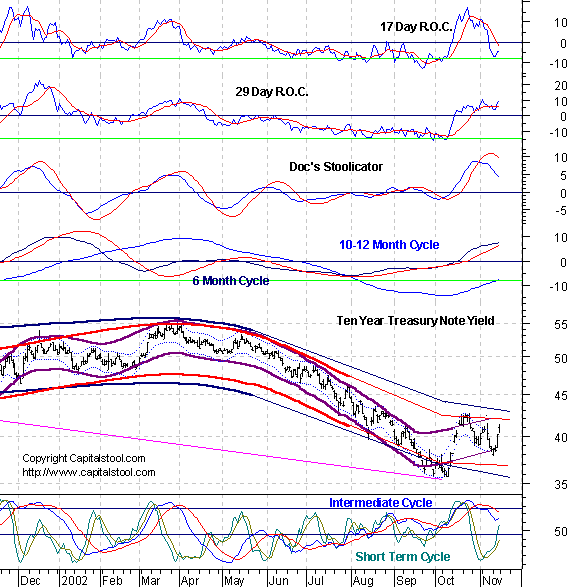
daily cycle charts are powered by METASTOCK Portfolio Sphincters Index (SPX) and Sentiment Sentiment and Momentum Indicators
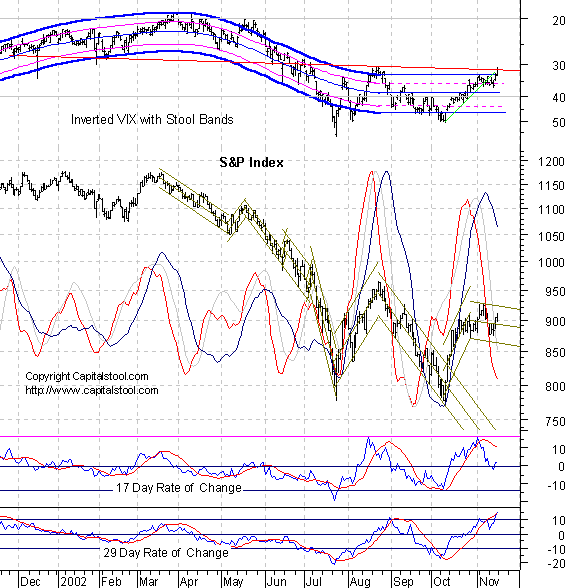
The 17 day rate of change is a proxy for the
6-7 week cycle. the 29 day rate of change is a proxy for the 10-13 week
cycle. The dark blue overlaid line is the 10-13 week cycle
oscillator, while the red line is the 6-7 week cycle oscillator. The VIX
is a measure of implied options volatility reflecting relative fear or
complacency. It is plotted below on an inverse scale to better show the
relationship to the price chart. The "Stool Bands may reflect either
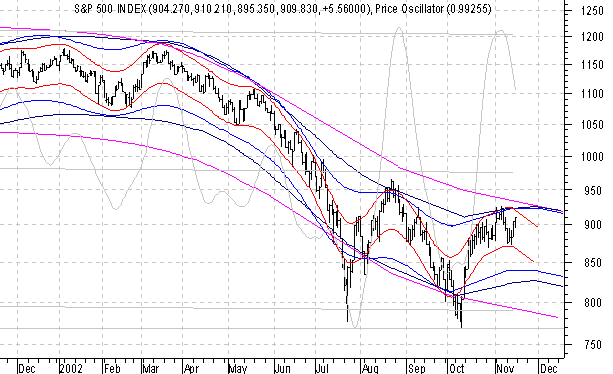
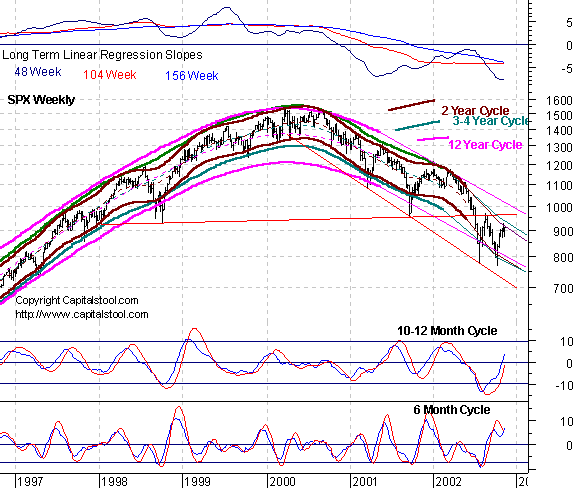
6 month or 10-12 month cycles. Short Term Cycles The 8-13 day cycles remain in an up phase which could end at any time this week. The cmap based on daily charts is 920. Normally, following an absolute high, we see a bounce or two to complete a distribution top. The 6-7 week cycle is now uncertain. The only clear cycles are the 8-13 day waves. After this one peaks, perhaps at a double top, look for at least one more wave to complete the complex intermediate top. 10-13 Week Cycle A double top on the 10-13 week cycle now looks probable. The cycle indicators are heading down, but the 29 day rate of change continues to plow higher. This indicator often lags by a few days at the top. The cycle low is due in late December or early January. The balance of November looks sideways, then down in December, but it now looks like this 10-13 week cycle may not carry past the October low. For that we may have to wait through another 10-13 week cycle. VIX The VIX continued its blowoff, and is now equal to where it was at the August high. If it continues higher, the Stool bands will follow. Bullish confidence is building. This is consistent with a 6 month cycle top. Cycle Chart Long Term (11/15/02) While the downslope of the 2
and 3-4 year cycles may be flattening, it doesn't change the fact that prices
are near the top of the channels. The current 10-13 week cycle now looks
like it could make a complete loop as part of a larger top, similar to the
one at the end of last year. It is possible that the market may stay in
the 875 to 950 range for up to 6 months. It would be analogous to the
second half of 1997, when the bubble was inflating, except in the opposite
direction. That scenario becomes more probable if a sharp selloff does not
commence this week. One way or the other it will be a trader's market.
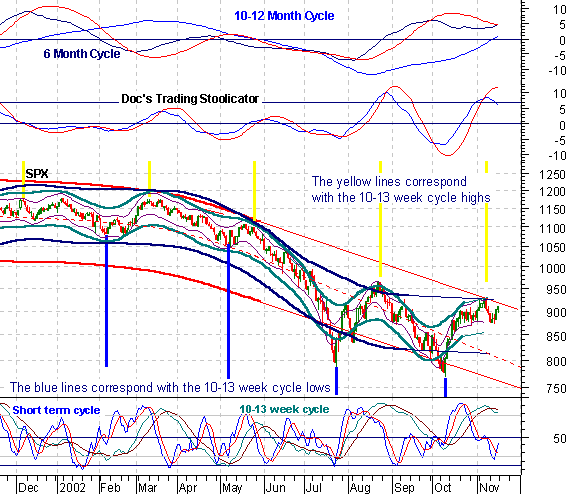
Timing will be paramount. The Cycle Conditions tables include cycle phase and a wild guess as to number of periods to the next turn, in days for the shortest cycles, weeks (W) or months (M) for the longer ones. This is a fluid exercise, in other words, the projections are likely to be wrong, but they force us to be vigilant for key turning points, and frequently work well enough to prevent costly misreadings. SPX Cycle Conditions as of 11/15/02
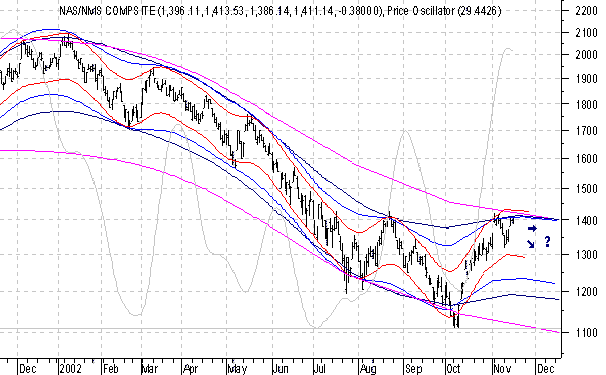
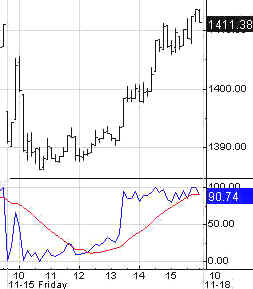
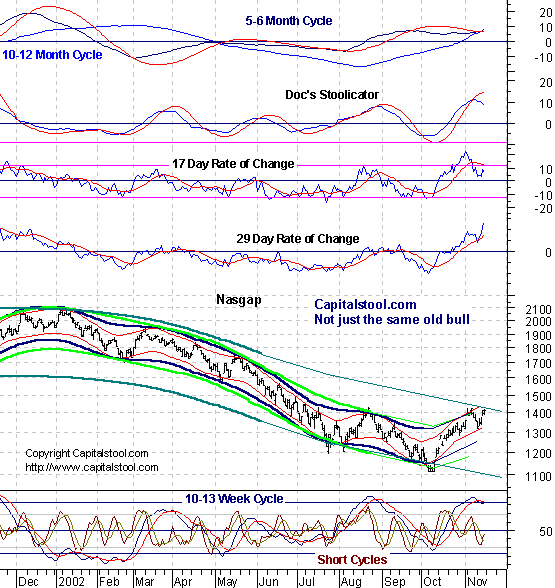
PTT - Periods Till Turn Nasgap Charts Cycle Chart Short Term Cycles The 8-13 day cycles are in an up phase, due to end this week, with a cmap of 1420. The 4 and 6-7 week cycles are unclear. The dominance of shorter frequencies is a typical feature of tops. 10-13 Week Cycle The 10-13 week cycle indicator remains on a sell signal but close to a whipsaw. The 6 month cycle oscillator has already whipsawed. Whipsaws in cycle indicators mean an overextension of the trend, painful nevertheless. 10-13 week cycle top phases can last for weeks, with breakdowns often delayed until the last 2-3 weeks in the cycle. They are marked by confusion, uncertainty, and lots of changes of direction. Bullishness is the order of the day in the media and poodit fraternity. Bears lose patience and often capitulate. Long Term (11/15/02) The 6 month cycle indicator has whipsawed and the 10-12 month cycle is still rising. These indicators lag actual turns by a several weeks. The possibility of a blowoff to 1500 before the major downtrend reasserts itself is ugly and real. If where we are right now isn't one of the great short selling opportunities of this generation, then that would be. The Nas is building toward a major disaster in the first half of 2003.
Nasdaq Cycle Conditions as of 11/15/02
PTT
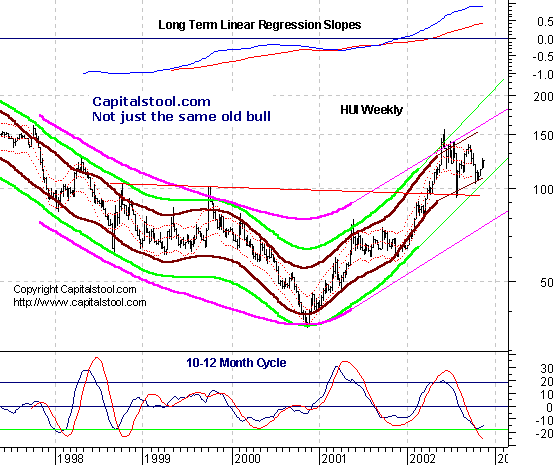
- Periods Till Turn Long Bong Hit - See top of page. AM Edition Features (Previous) These features are in morning edition, published between 7:30-8 AM ET US, or the Saturday Weak End Edition, published, uh, let's see, Saturday! Golden Stool The 10-13 week
cycle is still in an up phase and the 6-7 week cycle has not topped out
yet. The cmap rose to 125 on that cycle. The 10-13 week cycle up phase may
be strengthening. The down phase of the 6-7 week could be little more than
a consolidation. The 8-13 day cycle is also turning up. The initial cmap
is 126. This 10-13 week cycle should at least retest the September high.
The bottom appears to be in in the 10-132 month cycle, and the long term
uptrend is intact. The long term
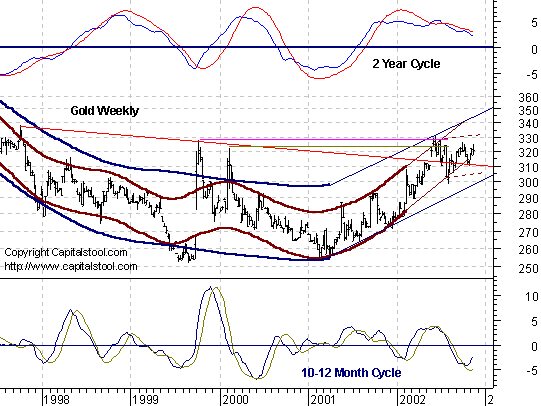
chart of gold suggests that it is winding up for an upside triangle
breakout in the months ahead. We see the
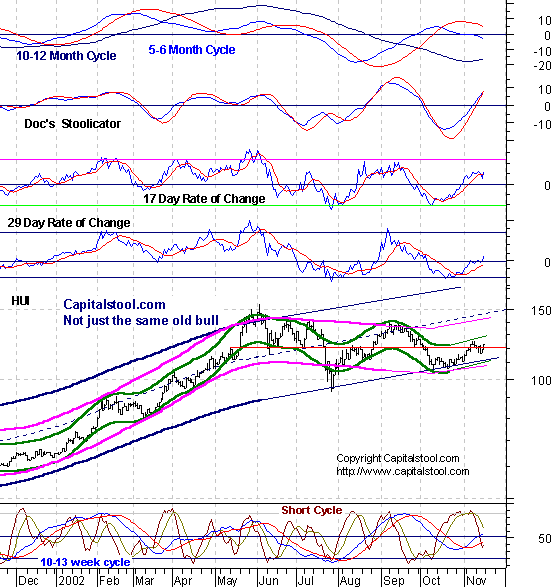
same pattern in Cousin HUI's long term chart. This could be the next
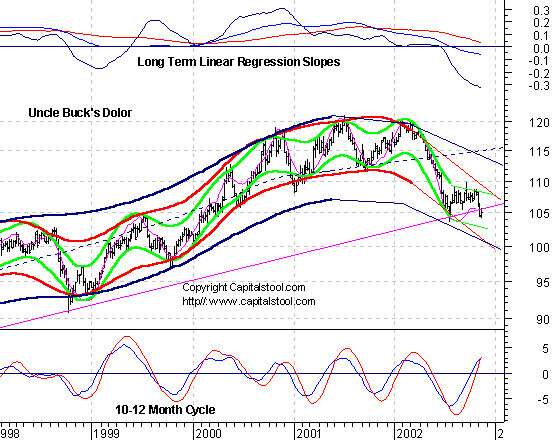
bubble. When it takes out 135, look out above. Uncle Buck's Illness
As the long term chart shows, rumors of Uncle Buck's death are not
exaggerated.
But the daily chart suggests he may try to hold on for another month. On
the other hand, whether it's now, or in a month, he has a long way to
fall. Suctor Watch and Stoolwethers- Now posted on separate page. Updated each morning between 8 AM and 9:30 AM NY time. See you in Intraday Stool. Dr. Stepan N. Stool Share your thoughts on the Stool Pigeons Wire.
Renewals Welcome, and thank you for subscribing to the Anals of Stock Proctology. Your trial subscription will run for 90 days. At the end of that period your subscription will renew automatically, unless you cancel. If you wish to cancel your subscription use the button below. If you want to renew your subscription do nothing. Your subscription will renew and your credit card or Paypal bank account will be charged. If you want to renew, be sure your credit card information in your Paypal account is current. Paypal will not renew your subscription if the card has expired! Again, thanks for subscribing!
Explanation of Intraday Commentary-Build charts at http://www.livecharts.com. For custom time bars insert a comma after symbol and number of minutes, e.g. compx,90. This will give you a bar chart of the Nas with 90 minutes per bar. The one day cycle is usually most clear with 8 minute bars and 26/18 stochastics. It varies from day to day. Sometimes 6 minutes works best. Experiment to find the best fit for your trading style, and the market's dominant frequency at the time. The goal here is primarily to monitor the condition of the 8 and 13 day cycles. I typically use 90 minute bars with 26/18 stochastics for the 13 day cycle proxy on the indices during regular trading hours. Other cycles use 26/18 stochastics with the following: 8 days- 60 minute bars On the 24 hour futures charts, use a time per bar approximately 3 to 4 times the above number of minutes, to represent the cycles listed above. ABBREVIATIONS: cma: centered moving average
|

![[Most Recent HUI from www.kitco.com]](http://www.weblinks247.com/indexes/idx24_hui_en_2.gif)
![[Most Recent XAU from www.kitco.com]](http://www.weblinks247.com/indexes/idx24_sp500_en_2.gif)
![[Most Recent Quotes from www.kitco.com]](http://kitconet.com/charts/metals/gold/t24_au_en_usoz_2.gif)