|
Archives 12/30/01, 1/1/02, 1/2/02, 1/3/02, 1/4/02, 1/7/02, 1/8/02, 1/09/02, 1/10/02, 1/11/02, 1/14/02, 1/15/02, 1/16/02, 1/17/02, 1/18/02, 1/22/02, 1/23/02, 1/24/02, 1/25/02, 1/28/02, 1/29/02, 1/30/02, 1/31/02, 2/1/02, 2/4/02, 2/5/02, 2/06/02, 2/7/02, 2/9/02, 2/11/02, 2/12/02, 2/13/02, 2/14/02, 2/16/02, 2/19/02, 2/20/02, 2/21/02, 2/23/02, 2/25/02, 2/26/02, 2/27/02, 2/28/02, 3/1/02, 3/04/02, 3/05/02, 3/06/02, 3/7/02, 3/10/02,3/11/02, 3/12/02, 3/13/02, 3/14/02, 3/15/02, 3/18/02, 3/19/02, 3/20/02, 3/21/02, 3/22/02, 3/25/02, 3/26/02, 3/28/02, 3/30/02 4/1/02, 4/2/02, 4/3/02, 4/4/02, 4/6/02, 4/8/02, 4/9/02, 4/10/02, 4/11/02, 4/13/02, 4/15/02, 4/16/02, 4/17/02, 4/18/02, 4/20/02, 4/22/02, 4/23/02,4/24/02,4/25/02, 4/26/02, 4/27/02, 4/29/02, 4/30/02 5/01/02, 5/2/02, 5/4/02, 5/6/02, 5/07/02, 5/8/02, 5/09/02, 5/10/02, 5/13/02, 5/14/02, 5/15/02, 5/16/02, 5/17/02, 5/20/02, 5/21/02, 5/22/02, 5/23/02, 5/24/02, 5/28/02, 5/29/02, 5/30/02 6/01/02, 6/3/02, 6/4/02, 6/5/02, 6/6/02, 6/7/02, 6/10/02, 6/11/02, 6/12/02, 6/13/02, 6/14/02, 6/17/02, 6/18/02, 6/19/02, 6/20/02, 6/22/02, 6/24/02, 6/25/02, 6/26/02, 6/27/02, 6/30/02 7/1/02, 7/4/02, 7/5/02, 7/11/02, 7/14/02, 7/15/02, 7/16/02, 7/17/02, 7/18/02, 7/19/02, 7/22/02, 7/23/02, 7/24/02, 7/25/02, 7/27/02, 7/29/02, 7/30/02 8/1/02, 8/3/02, 8/5/02, 8/6/02, 8/7/02, 8/8/02, 8/10/02, 8/12/02, 8/13/02, 8/14/02, 8/15/02, 8/16/02, 8/19/02, 8/20/02, 8/21/02, 8/22/02, 8/23/02, 8/26/02, 8/27/02, 8/28/02, 8/29/02, 8/30/02 9/3/02, 9/4/02, 9/5/02. 9/6/02, 9/9/02, 9/10/02, 9/11/02, 9/12/02, 9/13/02, 9/16/02, 9/17/02, 9/18/02, 9/19/02, 9/20/02, 9/23/02, 9/24/02, 9/25/02, 9/26/02, 9/27/02, 9/30/02 10/1/02, 10/2/02, 10/3/02, 10/4/02, 10/7/02, 10/8/02, 10/9/02, 10/10/02, 10/11/02, 10/14/02, 10/15/02, 10/16/02, 10/17/02, 10/18/02, 10/21/02, 10/22/02, 10/23/02
|
The Anals of Stock ProctologyPublished weeknights by
8:30PM Happy Acres, Florida Time The American Academy of Stock Proctology and Is your subscription up for renewal? If you want to renew, do nothing, unless your credit card has expired. Please be sure your credit card info is current. If your credit card has expired, you must enter the new expiration date in your Paypal account in order for your subscription to be processed. If you subscribed via Paypal, your subscription will be renewed for one year on the 90 day anniversary of your sign-up and your credit card will be charged. If you want to cancel, use the button at the bottom of the page. This applies only if you subscribed through Paypal. Mailed-in subscriptions are for 1 year. If you subscribed by prior contribution, I will send you a notice before your subscription expires. If you have any questions, see the subscription page and FAQ's. If you can't find the answer, email me. Mid Day Outlook (10/25/02) The upside cmap for this one day
cycle is around 890+/-. The high is due 12-1PM. The afternoon should see
prices drift lower. However, if the strength persists beyond 1 PM, the 13
day cycle low could be in. In that case look for at least a retest of the
highs. Good Money After Bad (10/24/02) The market slowly but surely heads for long term disaster. In spite of the fact that the 10-12 month cycle has been in an up phase since late July, it made a lower low in September and it has, so far, failed to make a higher high. Time is running out. When the Street sees this thing roll over without making that higher high, panic will set in. The sphincters have convinced themselves that the 4 year cycle low is God's law, like the old rule about don't fight the Fed. The whole four year cycle thing is way, way overdone. This market has proved time and time again that it is a different animal from the kinds of patterns that were so common in the second half of the twentieth century, especially in the last 2 decades of that century. Forget the patterns of the last twenty years. They will only mislead you. Post bubble markets ARE different. We have the models. We know how they behave. They are the opposite of the bubbles which preceded them. And then some. The models for this market are past bubble deflations, the 1920's to 1930's in the US, the 1990's in Japan, and the precious metals markets of the 1980s. The characteristics of these markets are simple. Increasing volatility, growing illiquidity, and most of all, lower highs and lower lows. Erstwhile bears who are jumping ship on the bear case should not be so quick to panic. We are in the midst of yet another garden variety bear market rally caused by manipulation and cyclical factors. It is a rally which, if it didn't end today, will soon. The Feed added a net of $3.25 billion. They refunded the $2 billion in 28 day repos, and issued $4.75 billion in overnight repos while $1.5 billion expired. The $4.75 billion will expire Friday. $5 billion in new Treasury notes settle next week. That will to some extent offset a similar amount of Feed. The Feed remains in a neutral trend over the last 5 months, and is barely maintaining an 8% growth rate over 10 months. Three trends are evident on
the Feed Index, which is the total Fed holdings of loans and securities. One is the 10% growth trend beginning in May of 2001. Feed
growth has recently been at or below the lower boundary of that trend. The
blue channel going back to last December suggests that Al may now be
targeting an 8% growth rate. Then there's the golden box which says he's stopped growing Feed altogether over the last three months. The uptick in the Feedometer is inconsequential, not enough to jam anything. The
Feedometer theoretically
measures excess Feed available for bond or stock market jamming. Bond yields dropped after falling
just shy of upside cmaps for shorter cycles. The intermediate wave may
also be topping out. As these cycles head down, stock prices will drop
sharply. Eventually this relationship should reverse, but it hasn't yet,
and when it will is anybody's guess. Is inflation dead? Again? Looks
like a hunchback on the chart. It may also be an intermediate cycle low
We'll find out soon. This bulge in mortgage
applications over the summer should have caused a big increase in the
broad money supply. It did for awhile, but then broad
money growth began to slow in the last two months when we would have
expected it to be strongest. The system seems to have sprung a leak. Now
that mortgage monetization is about to slow down dramatically, the
liquidity squeeze will be on. M1 and checking accounts remain
flat, reflecting flat economic growth. Meanwhile, total bank credit was
still growing as of October 9. Most of that growth was in consumer credit
and government securities. Business borrowing is still dead
and deader. The commercial paper market keeps
shrinking as well. A financial system in the midst of a liquidity crunch is not going to support rising stock prices for very long.
Friday's AM Outlook All of Doc's
cycle charts
are powered by METASTOCK Portfolio Sphincters Index (SPX) and Sentiment Sentiment and Momentum Indicators
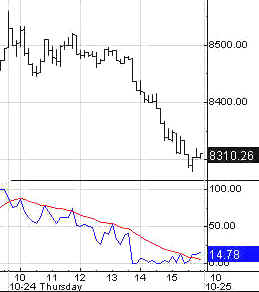
The 17 day rate of change is a proxy for the
6-7 week cycle. the 29 day rate of change is a proxy for the 10-13 week
cycle. The dark blue overlaid line is the 10-13 week cycle
oscillator, while the red line is the 6-7 week cycle oscillator. The VIX
is a measure of implied options volatility reflecting relative fear or
complacency. It is plotted below on an inverse scale to better show the
relationship to the price chart. The "Stool Bands may reflect either
6 month or 10-12 month cycles. Short Term Cycles The short cycle oscillator turned down, signaling the beginning of a top to down phase in the 4 week cycle. The 6-7 week cycle oscillator is slowing. This indicator is usually either a few days early or concurrent with the turn. The 8 and 13 day cycles are down with 2-4 days to go, but the downside potential isn't clear at this point. There's probably some upside residual momentum to be worked off longer cycles as a top is built. 10-13 Week Cycle The indicators for this cycle still point up but there's no upside cmap due to ambiguity in the projections. Everything hinges on the current short cycle down phase. The 10-13 week cycle could end right here, or it may still have a pop to possibly retest the August high. VIX The VIX continues to flirt with the top zone on the inverted scale stool band chart. The bands are flattening, however. Until we see a touch of the upper projection line, and a turn in the indicator, it doesn't tell us much. Cycle Chart Finally, let's put things in
perspective. If this market cannot break out above 925, then the long term
trend is growing weaker. Long Term (10/22/02) While the whole world is fixating on the "4 year cycle low", Doc thinks it's a non-issue. Since October 1998 was a bottom, virtually everyone was expecting a 4 year low in this time frame. But bubbles are peculiar. The tsunami wave spawns atypical wave responses. The November 1929 low was at a 3 year anniversary. The next important low was in July 1932. At other times we have seen cycles run 4.5 years, or 3 years. Focusing in a 4 year low is a bad idea. Cycle lengths vary, and long term indicators do not suggest that the ultimate bear market low is at hand. The most obvious long term wave this time has been around two years in duration, and the last low was in mid 2001. So we should look for the next one around mid-year next year, give or take 3 months either way. That would also correspond with the 10-12 month cycle which bottomed in July and is now in the midst of a weak sideways up phase. This up phase shows every sign of manifesting as a broad trading range in which highs fall short of past highs and nominal new lows are made on downswings. The current rally is part of a 6 month cycle top within the 10-12 month cycle up phase. As a result of the rally, the downside cmaps Doc had been posting are no longer valid on the current 5-6 month cycle. The 10-12 month cycle is headed up. Significantly lower lows look like they will be delayed until well into next year. The Cycle Conditions tables include cycle phase and a wild guess as to number of periods to the next turn, in days for the shortest cycles, weeks (W) or months (M) for the longer ones. This is a fluid exercise, in other words, the projections are likely to be wrong, but they force us to be vigilant for key turning points, and frequently work well enough to prevent costly misreadings. SPX Cycle Conditions as of 10/24/02
PTT - Periods Till Turn Nasgap Charts Cycle Chart Short Term Cycles The 8 and 13 day cycles are in a down phase that could last 2-4 days. Preliminary downside cmaps are 1260-1280. The 4 week cycle appears to have topped out. The 6-7 week cycle has an upside cmap of 1350 due within 3 days. The question is whether the spike into the 1330's is close enough. The 17 day rate of change hit the top zone. Another down day or two should confirm that the top is in on the 6-7 week cycle. 10-13 Week Cycle The 10-13 week cycle apparently has a cmap of 1330 but that could change. The up phase still has 1 to 3 weeks remaining and the indicators are still headed up. Let's hope they're just late, like they were on the last cycle. At the very least, the market needs to do some distribution work for at least a few days, and maybe a couple f weeks, to form a top. Long Term (10/22/02) The "4 Year Cycle" looks like it bottomed last year, lasting only 3 years as a result of the influence of the tsunami bubble wave. The Nasty may actually have been in an up phase since then, with the current move being the rigor mortis rally before the Nas heads for its ultimate price objective of negative 400. By 2007, the Nas will be the National Toilet Paper Exchange. (Assuming that this interpretation is correct, of course.) In the meantime we'll have to grit our teeth until the current 5-6 month cycle top phase within this 10-12 month cycle sideways up phase is complete. That should be within 1 to 3 weeks. Doc doesn't think the up phase will exceed 1350. Nasdaq Cycle Conditions as of 10/24/02
PTT
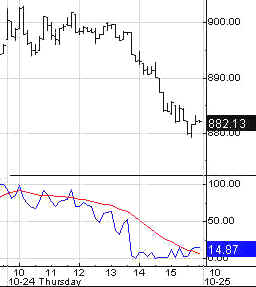
- Periods Till Turn Long Bong Hit - See top of page. AM Edition Features (Previous) These features are in morning edition, published between 7:30-8 AM ET US, or the Saturday Weak End Edition, published, uh, let's see, Saturday! Golden Stool Doc has his
fingers crossed that this is the trough of the intermediate cycle and not
a sideways up phase in the 6-7 week cycle. In the latter case, HUI will go
down and test the 95-98 area before turning up. Let's put our faith in the
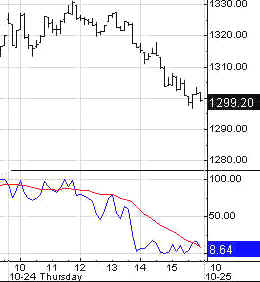
stoolicator and believe the upturn will start from here. Uncle Buck's Illness
Is today the day Buck breaks wind? Sitting squarely on the pink uptrend
line here at 7:30 AM Friday. As goes Buck, so goes the stock market Suctor Watch and Stoolwethers- Now posted on separate page. Updated each morning between 8 AM and 9:30 AM NY time. See you in Intraday Stool. Dr. Stepan N. Stool Share your thoughts on the Stool Pigeons Wire.
Renewals Welcome, and thank you for subscribing to the Anals of Stock Proctology. Your trial subscription will run for 90 days. At the end of that period your subscription will renew automatically, unless you cancel. If you wish to cancel your subscription use the button below. If you want to renew your subscription do nothing. Your subscription will renew and your credit card or Paypal bank account will be charged. If you want to renew, be sure your credit card information in your Paypal account is current. Paypal will not renew your subscription if the card has expired! Again, thanks for subscribing!
Explanation of Intraday Commentary-Build charts at http://www.livecharts.com. For custom time bars insert a comma after symbol and number of minutes, e.g. compx,90. This will give you a bar chart of the Nas with 90 minutes per bar. The one day cycle is usually most clear with 8 minute bars and 26/18 stochastics. It varies from day to day. Sometimes 6 minutes works best. Experiment to find the best fit for your trading style, and the market's dominant frequency at the time. The goal here is primarily to monitor the condition of the 8 and 13 day cycles. I typically use 90 minute bars with 26/18 stochastics for the 13 day cycle proxy on the indices during regular trading hours. Other cycles use 26/18 stochastics with the following: 8 days- 60 minute bars On the 24 hour futures charts, use a time per bar approximately 3 to 4 times the above number of minutes, to represent the cycles listed above. ABBREVIATIONS: cma: centered moving average
|

![[Most Recent HUI from www.kitco.com]](http://www.weblinks247.com/indexes/idx24_hui_en_2.gif)
![[Most Recent XAU from www.kitco.com]](http://www.weblinks247.com/indexes/idx24_sp500_en_2.gif)
![[Most Recent Quotes from www.kitco.com]](http://kitconet.com/charts/metals/gold/t24_au_en_usoz_2.gif)