|
Archives 12/30/01, 1/1/02, 1/2/02, 1/3/02, 1/4/02, 1/7/02, 1/8/02, 1/09/02, 1/10/02, 1/11/02, 1/14/02, 1/15/02, 1/16/02, 1/17/02, 1/18/02, 1/22/02, 1/23/02, 1/24/02, 1/25/02, 1/28/02, 1/29/02, 1/30/02, 1/31/02, 2/1/02, 2/4/02, 2/5/02, 2/06/02, 2/7/02, 2/9/02, 2/11/02, 2/12/02, 2/13/02, 2/14/02, 2/16/02, 2/19/02, 2/20/02, 2/21/02, 2/23/02, 2/25/02, 2/26/02, 2/27/02, 2/28/02, 3/1/02, 3/04/02, 3/05/02, 3/06/02, 3/7/02, 3/10/02,3/11/02, 3/12/02, 3/13/02, 3/14/02, 3/15/02, 3/18/02, 3/19/02, 3/20/02, 3/21/02, 3/22/02, 3/25/02, 3/26/02, 3/28/02, 3/30/02 4/1/02, 4/2/02, 4/3/02, 4/4/02, 4/6/02, 4/8/02, 4/9/02, 4/10/02, 4/11/02, 4/13/02, 4/15/02, 4/16/02, 4/17/02, 4/18/02, 4/20/02, 4/22/02, 4/23/02,4/24/02,4/25/02, 4/26/02, 4/27/02, 4/29/02, 4/30/02 5/01/02, 5/2/02, 5/4/02, 5/6/02, 5/07/02, 5/8/02, 5/09/02, 5/10/02, 5/13/02, 5/14/02, 5/15/02, 5/16/02, 5/17/02, 5/20/02, 5/21/02, 5/22/02, 5/23/02, 5/24/02, 5/28/02, 5/29/02, 5/30/02 6/01/02, 6/3/02, 6/4/02, 6/5/02, 6/6/02, 6/7/02, 6/10/02, 6/11/02, 6/12/02, 6/13/02, 6/14/02, 6/17/02, 6/18/02, 6/19/02, 6/20/02, 6/22/02, 6/24/02, 6/25/02, 6/26/02, 6/27/02, 6/30/02 7/1/02, 7/4/02, 7/5/02, 7/11/02, 7/14/02, 7/15/02, 7/16/02, 7/17/02, 7/18/02, 7/19/02, 7/22/02, 7/23/02, 7/24/02, 7/25/02, 7/27/02, 7/29/02, 7/30/02 8/1/02, 8/3/02, 8/5/02, 8/6/02, 8/7/02, 8/8/02, 8/10/02, 8/12/02, 8/13/02, 8/14/02, 8/15/02, 8/16/02, 8/19/02, 8/20/02, 8/21/02, 8/22/02, 8/23/02, 8/26/02, 8/27/02, 8/28/02, 8/29/02, 8/30/02 9/3/02, 9/4/02, 9/5/02. 9/6/02, 9/9/02, 9/10/02, 9/11/02, 9/12/02, 9/13/02, 9/16/02, 9/17/02, 9/18/02, 9/19/02, 9/20/02, 9/23/02, 9/24/02
|
The Anals of Stock ProctologyPublished weeknights by
8:30PM Happy Acres, Florida Time The American Academy of Stock Proctology and Is your subscription up for renewal? If you want to renew, do nothing, unless your credit card has expired. Please be sure your credit card info is current. If your credit card has expired, you must enter the new expiration date in your Paypal account in order for your subscription to be processed. If you subscribed via Paypal, your subscription will be renewed for one year on the 90 day anniversary of your sign-up and your credit card will be charged. If you want to cancel, use the button at the bottom of the page. This applies only if you subscribed through Paypal. Mailed-in subscriptions are for 1 year. If you subscribed by prior contribution, I will send you a notice before your subscription expires. If you have any questions, see the subscription page and FAQ's. If you can't find the answer, email me. Update 9/26/02 1:15 PM Terms and methodology Up and down. The 5 hour and 1 day cycles are heading down, and the highs in the 5 and 8 day cycles also appear to be in. The 5 hour low is due between 1:30 and 2:30 and the 1 day low is due at 3:45. The period between 2:30 and 3:45 should give us a clue as to who's winning the bigger battle. (As if we don't know)
Doc does not make trading recommendations. This update reports intraday time cycle estimates and centered moving average projections based on the Hurst cycle analysis method. Doc assumes no responsibility for the accuracy or inaccuracy of these estimates and projections. The market may or may not meet these projections. New stoolies should thoroughly familiarize themselves with the methodology before trading based on this method. There is no free lunch. Those who do not have the time or inclination to develop a trading strategy based on testing and research should not trade. Trade at your own risk. Update 9/26/02 9:15 AM Terms and methodology Off to the races again this morning. That's consistent with the 5 hour cycle low at yesterday's close. The highs could potentially happen at 11 AM, 1 PM and 2:30. Whether the later highs are higher or lower than the first one will give us a clue as to the sustainability of the jam. Keep an eye on the Feed also. $4.5 billion in overnights, and $3 billion in 28 day repos are coming off. no Feed, no jam. As Doc said last night, "Based on 2 and 3 day cycle cmaps, the high should be around 7900-7925 on the Dow, 845-47 on the SPX, and 1230 on the Nasty." If it goes beyond those targets, the up phase is strengthening.
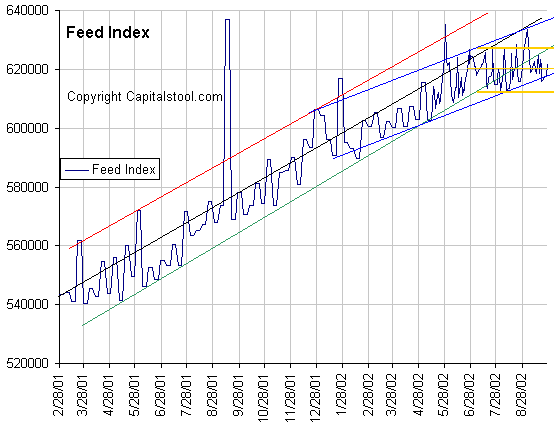
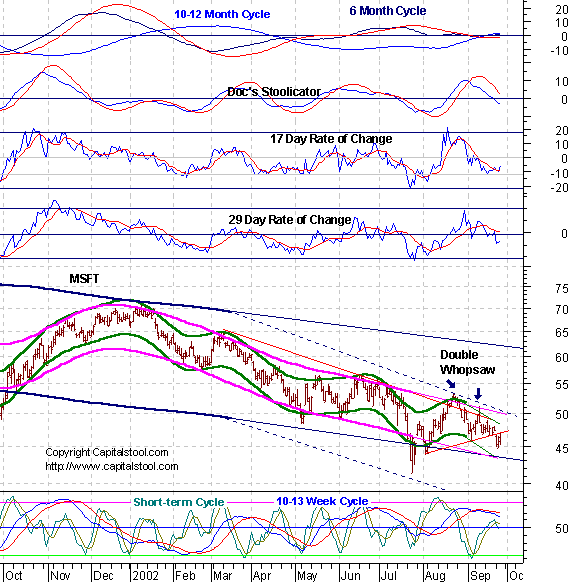
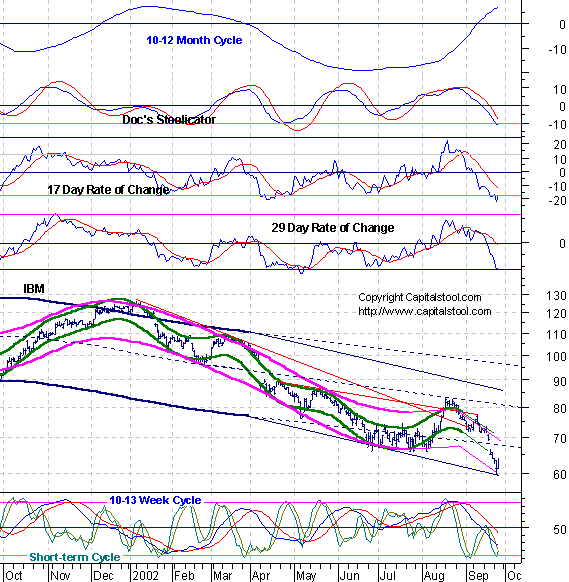
Al's Benighted (9/25/02) First Allboner's Huge Johnson just told everyone watching on Crapvision, that stocks are hugely undervalued and bonds are grossly overvalued. Stock Proctology tells us, this condition is impossible. If the bond market is "grossly overvalued", i.e. interest rates are too low, then it must be assumed that bond yields will "grossly" increase. The 5 or 10 year Treasury yield is typically the divisor in the simplest income capitalization valuation models used by portfolio sphincters and by the Feed Reserve itself. Aside from the fact that this is a ridiculous practice in its own right, if the portfolio sphincter thinks that bond yields are too low, he must apply the "correct" rate in his stock valuation model. In other words he must adjust his divisor upward, to where he thinks bond yields should be. Obviously it would make no sense to capitalize equity income at a rate that is too low. If that's what you thought, you'd expect that condition to be temporary. If you capitalize the income at that rate, the resulting "value" would be too high, thereby making stock prices appear "grossly undervalued." For example, let's assume that Stoolco Inc. has earnings of $1.00 per share. At current 10 year Treasury yields of 3.75% the valuation calculation would be $1.00 divided by 3.75%, which equals a "fair value" of $26.67 per share. But alas, the stock is selling for only $15.00 per share because of this stoopid, crazy, irrational stock market. That's a discount of 44% from where its price "should" be if the market were not so screwed up. Right? Well, of course it isn't right. The sphincter is using a capitalization rate which he knows is too low. He even said so on national television. "Bonds are grossly overvalued," means the same as yields are way too low. What yield is appropriate? In terms of Stock Proctology of course, there is no such thing. But let's look at it like a portfolio sphincter would, like good old Huge Johnson. Historically, 10 year Treasury yields carry an inflation premium of 2% to 3%. (Once again, history is only twenty years, ok?) Recently the CPI came in at an annualized rate of 4.2%. Let's add a 2.5% inflation premium. That would make the "correct" yield for discounting purposes 6.7%. So lets divide the $1.00 per share in earnings by 6.7% and see what happens. $1.00 / 6.7% = $14.92. Voila! No overvaluation. Like Doc said, what Huge Johnson described is impossible. Recall also, these valuation models do not include a risk premium for stock earnings relative to Treasury yields. That is patently ridiculous in its own right. Who knows what that risk premium should be? Considering that no one has the foggiest idea of what earnings are now, let alone what they'll be in six months or a year or two, it seems to Doc that the risk premium should be substantial. With that in mind, not only is Stoolco not undervalued at that price, it is grossly overvalued. After all, no one knew that Dr. Stepan N. Stool, the company chairman, sold an enormous quantity of puts against the company stock when it was at 25, and also engaged in illegal round trip trades with a large business partner, reportedly AhOL. Uh oh! The Feds are at the door. Doc needs to find someplace to hide his $250,000 gold plated toilet purchased with company funds. Meanwhile, looky here! We had our perfectly engineered retest of the lows! The Nas broke the August low, then promptly turned around, a classic WHOPsaw, and the senior averages at least held above their July lows, substantially so in the case of the Sphincter Index. Some chartists will argue that this is a positive divergence and tell their clients to buy. The bottom is in. The question now is, how will the crowd react. Yes, we knew this was coming. Yes, the timing doesn't isn't quite right for a big low. Yes, the six month cycle appears to be in a top phase. Yes, the 10-13 week cycle still appears to be in a down phase. In spite of all those things, we need to be very careful here. Doc doesn't expect much upside. The evidence for that just isn't there yet. But still, use good trade management practices. Know where your stops should be. Don't let hard won profits get away. We will not be completely safe in our shorts until the lows are taken out by all three major averages. Until that happens, we are probably going to see and hear a lot of crazy stool, both in terms of market action, and stoopid portfolio sphincter tricks. It is, after all.... The end of the quarter. The Feed added $4.5 billion in overnight repos. That was more than offset, indirectly, by the $6.7 billion in new money raised in the $27 billion Treasury auction of Two Year Notes. So the Feed was not the source of the market's rally. Gee, there must be a lot of liquidity around. Either that, or there isn't much and they just used it all up. We'll know soon enough. Hopefully tomorrow. The $4.5 billion will expire Thursday, along with the usual $3 billion in 28 day repos. Total Feed jumped off the bottom of the 8% growth channel (blue), to some extent confirming the target range. Normally when they start pumping off the bottom of the channel, they continue for a couple of days. But they also have a habit of backing off if the market has a strong day. Three trends are evident on
the Feed Index. One is the 10% growth trend beginning in May of 2001. Feed
growth has recently been at or below the lower boundary of that trend. The
blue channel going back to last December suggests that Al may now be
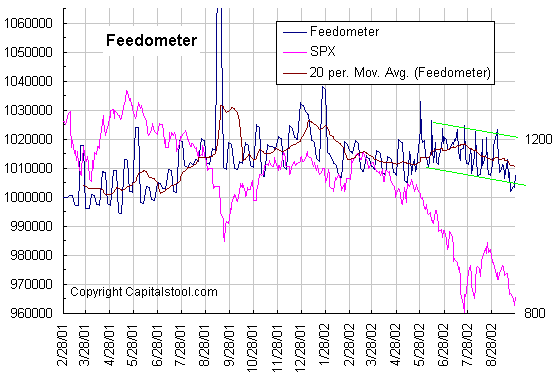
targeting an 8% growth rate. Then there's the golden box which says he's stopped growing Feed altogether over the last three months. The Feedometer turned up off the double bottom. "No change in Fed policy" means they will continue to pump when the markets need it at critical junctures. Again, this suggests that the pumping will continue for a few days. There's a question of degree, since recently they've had a tendency to back off if the market has a strong up day like Wednesday. The
Feedometer theoretically
measures excess Feed available for bond or stock market jamming. Long Bong Hit - There was plenty of selling at the long end of the bond market. That helps to explain where some of the liquidity for the stock rally came from. Long term cmaps on the 10 year yield are pointing anywhere from 3.30 to
3.60. Yields spiked up to 3.76 after hitting 3.59 Tuesday. A number of
conditions for a significant low are in place. They stretched the limits of the channels and
the turn was preceded by a classic parabolic panic. For months long term
cmaps had pointed to the 3.70-3.80 range for a low, only to be forced
lower in what may have been a final buying panic. This is typical of the
type of action typically seen at important intermediate turns. Short term
cmaps for cycles up to 10-13 weeks pointed to a low of 3.60 and after
Wednesday's action a couple of short cycle oscillators turned up. The real
test of whether this is finally the turn will be a run up to 3.90, a
pullback to retest the low, and then a move to higher highs. The timing
overall, looks right.
All of Doc's
cycle charts
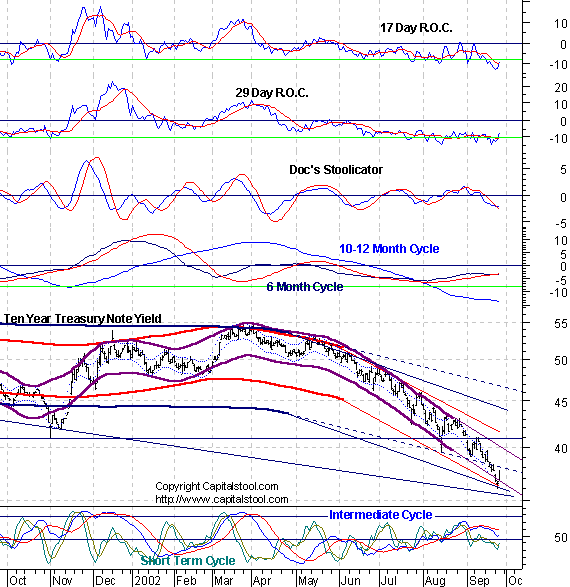
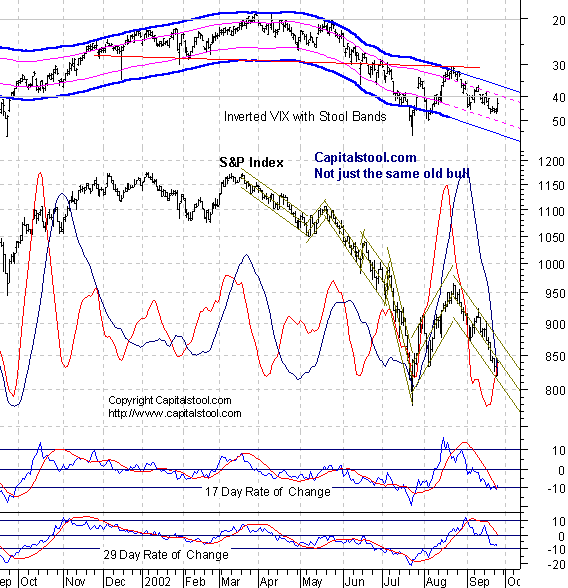
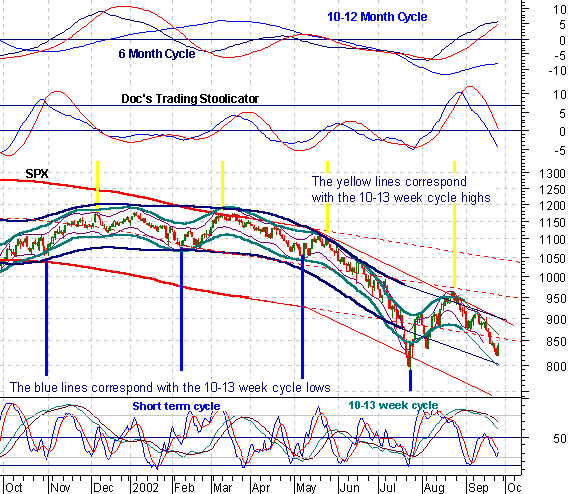
are powered by METASTOCK Portfolio Sphincters Index (SPX) and Sentiment The SPX bounced back toward the midpoint of its regression channel. The 17 day rate of change looks like it's on a buy signal, but the 29 day rate of change isn't close. Until both indicators are in gear, the market's not going far in either direction. The trend is your friend. When the 10-13 week cycle wave is coming down hard, the 6-7 week cycle becomes a non issue in the big picture, but it is still capable of generating a brief spike to the upside lasting a couple of days. Whether a 6-7 week cycle low is in or not is irrelevant in the big picture. Regardless, it pays to be prudent. There will be attempted shakeouts in both directions. The superimposed 6-7 week cycle oscillator continues heading up, and the price action has begun to follow. As the up phase goes on, the market's vulnerability to decline will increase regardless of whether prices rise or simply consolidate. The 10-13 week cycle oscillator tends to mimic price action more closely. It's hard to see on the chart, but it is still declining. It should be 2 to 5 weeks before a cycle low, enough time for the indicator to make a new low. If the indicator should turn up before that, Doc would take that as a signal to cover shorts for awhile. He especially would not want to be short if both indicators were headed up. The VIX fell sharply to
42.41. It's now back near the upper band of the inverted scale 6 month cycle Stool band.
The sharp reduction in fear at this stage is a sign that the rally isn't
sustainable. A short term top would be signaled when the indicator
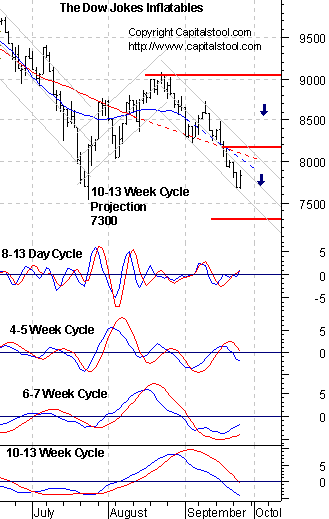
gets back into the upper band. The 17 day rate of change is a proxy for the 6-7 week cycle. the 29 day rate of change is a proxy for the 10-13 week cycle. The dark blue overlaid line is the 10-13 week cycle oscillator, while the red line is the 6-7 week cycle oscillator. The short cycle oscillator, (chart below) upticked, but did not flash a buy signal, another reason to be skeptical that the bounce will have staying power. This indicator tends to hit the "bottom line" at 4 or 6 week intervals, mimicking those cycles. This bounce looks a bit early in that context. If the indicator moves above the smoother, that suggests the turn is for real, at least for a few days. The 10-13 week cycle oscillator is accelerating down, and is still well above the 50% line, room and time enough for a big drop from here. One caveat. If the indicator begins to turn up at the 50% line, that would signal that longer term waves are strengthening. If it happens, don't fight the tide. The 6 month cycle indicator still has not topped out, meaning that the six month cycle is still in an up or top phase. The same goes for the 10-12 month cycle indicator. Under the circumstances we might see a series of frustrating bounces before the ultimate break down. The fact that the market is near its lows while in an up phase is indeed a sign of long term weakness. But while in an up phase it still has the potential for big rallies. The only upside projections are for very short cycles and they are only minimally above current levels. The preliminary downside cmap is 650 for the 6 month cycle low due in early 2003. The 10-13 week cycle cmap is 700, due some time in October. Yesterday Doc said, "Look for a weak rally off the test of the lows, then another leg down." He'll stick with that, except to add that an alternate scenario would call for several weak rallies and retracements before a delayed leg down in the next 10-13 week cycle. Tricky business, but keep this one thing in mind. It's the end of the quarter and Al's Benighting. He has the power to make sure the markets don't embarrass him. Or does he?
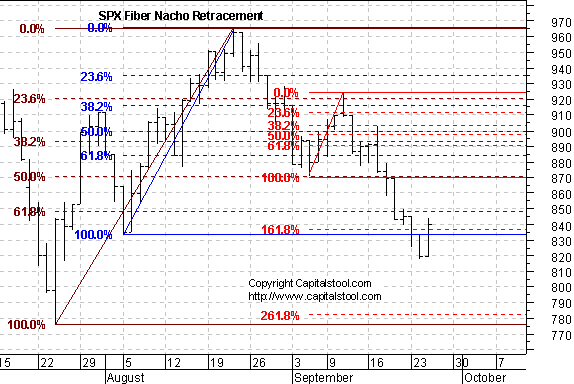
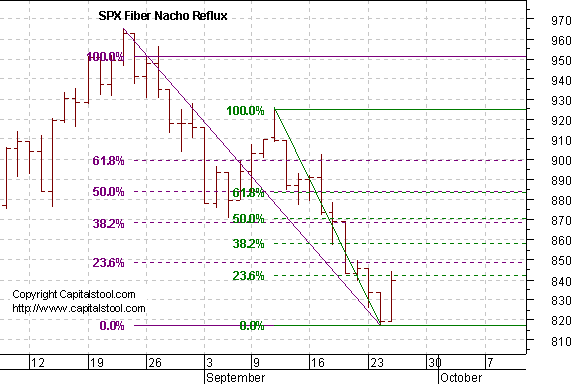
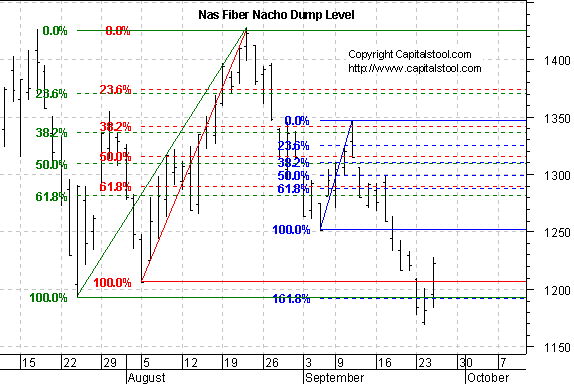
Fiber Nacho Dump- Support levels and downside targets.
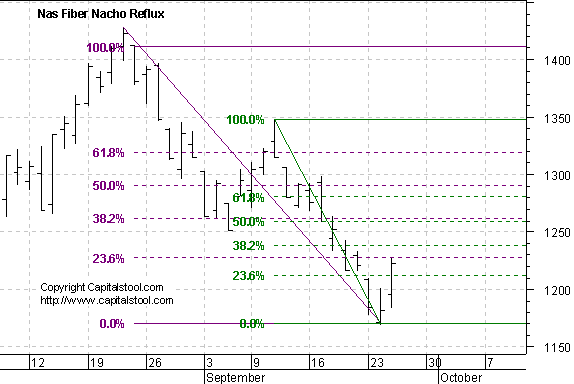
Fiber Nacho Reflux- Resistance levels and upside targets The Cycle Conditions tables include cycle phase and a wild guess as to number of periods to the next turn, in days for the shortest cycles, weeks (W) or months (M) for the longer ones. This is a fluid exercise, in other words, the projections are likely to be wrong, but they force us to be vigilant for key turning points, and frequently work well enough to prevent costly misreadings. SPX Cycle Conditions as of 9/25/02
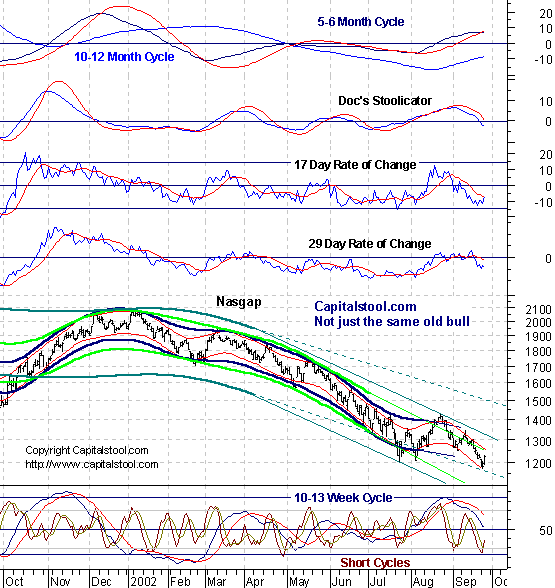
PTT - Periods Till Turn Nasgap Charts The Nas rallied back to the center of its short term cycle channel. Unlike the SPX, neither the 17 or 29 day rate of change indicators flashed buy signals. The short cycle oscillator did, however. It is a more sensitive, and less reliable indicator. Doc would not expect follow through unless the momentum indicators turn up. The 10-13 week cycle is in a down phase that should last 2-5 weeks, plenty of time for a lot more downside, even with an intervening bounce, but again Doc would watch this closely. If it turns up above the 50% line it's time for bears to go hibernate. The 6 month cycle indicator may have flashed a sell signal. Let's wait a couple days to see for sure, but if the indicator does start to roll over, this is the last rally in the top phase. For starters, the very preliminary indication for the January-February, 6 month cycle low is 1000. A lot depends on the market's behavior over the next few days in terms of whether that indication moves up or down, or is cancelled. The 4 week cycle is heading down in gear with the 10-13 week cycle. The power of the combined waves was creating a rip current that pulled everything with it. The up phase of the 13 day and 6-7 week cycles will fight that, but it should be a losing battle. The probability of a meaningful rally within less than two weeks is low. Doc said yesterday that "a minor pop or holding action remains likely at some point within the next couple of days. It should be shortable." He'll stick with that diagnosis for now, but expect some wild activity as the lows are defended. As with the SPX, a series of up and down swings could occur before the expected breakdown. We saw similar action before the Dow broke key round number levels in the 73-74 bear market. The 10-13 week cycle projection is
now 1025 due some time in October.
Fiber Nacho Dump- Support levels and downside targets.
Fiber Nacho Reflux- Resistance levels and upside targets Nasdaq Cycle Conditions as of 9/25/02
PTT
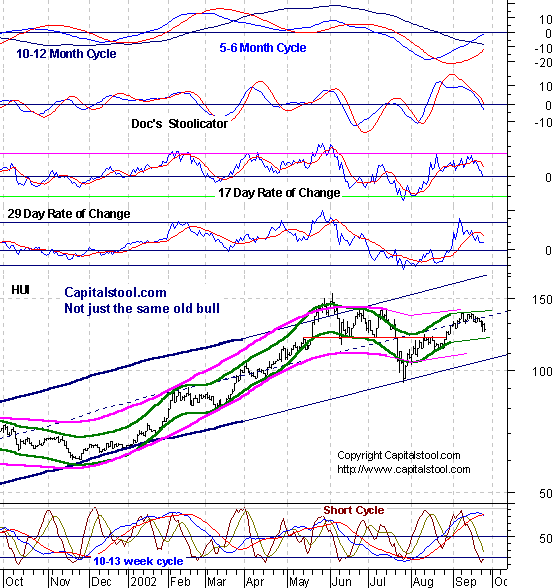
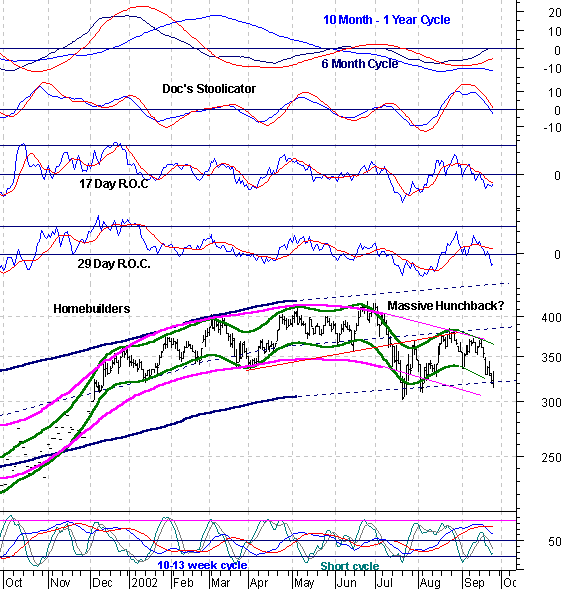
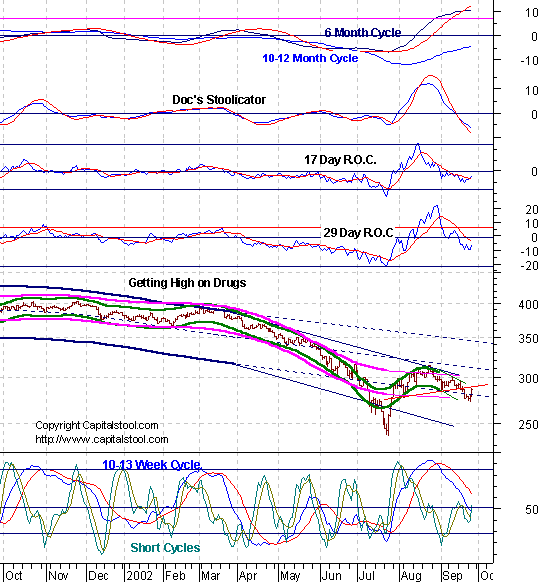
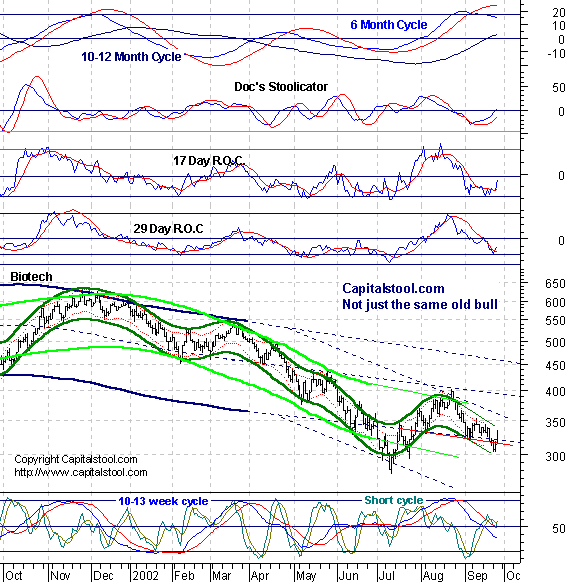
- Periods Till Turn AM Edition Features (Previous) These features are in morning edition, published around 9 AM ET US, or the Saturday Weak End Edition, published, uh, let's see, Saturday! Golden Stool HUI's two
month uptrend line has been violated as the index closed at 125.92 on
Wednesday. The 6-7 week cmap moved down to 123, with a cycle low due at
any time over the next 3 to 10 days. Uncle Buck's Illness
Buck looks like he wants to get out of bed and bump his head on the
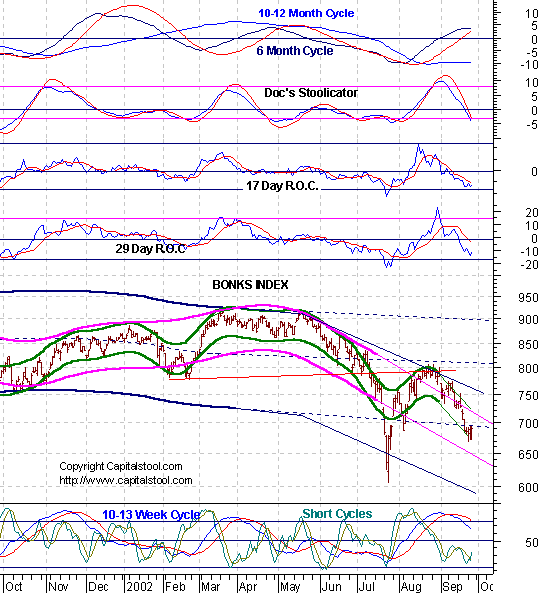
ceiling again. Bonkers- The financials
have a short cycle bounce going. Yep, the six month cycle is still in an
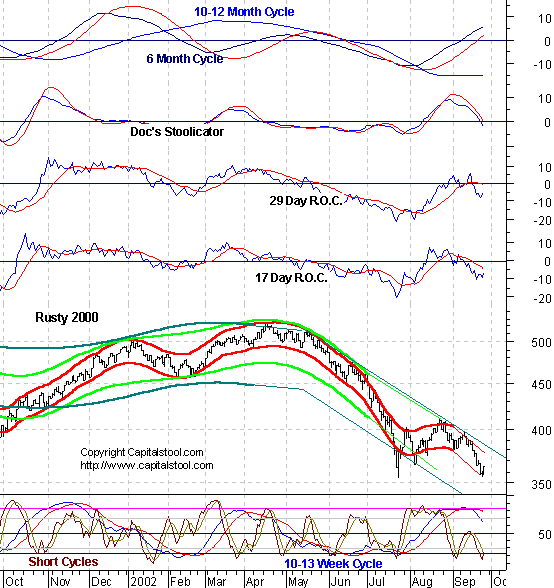
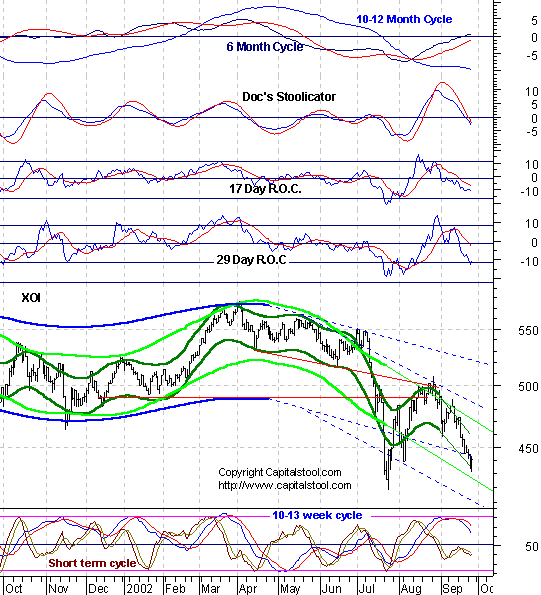
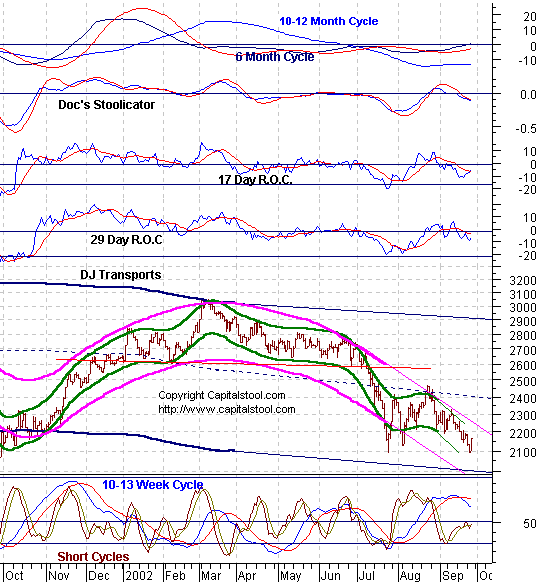
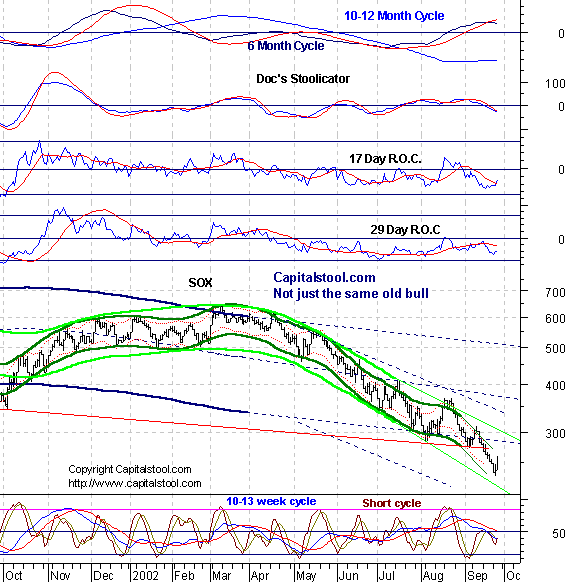
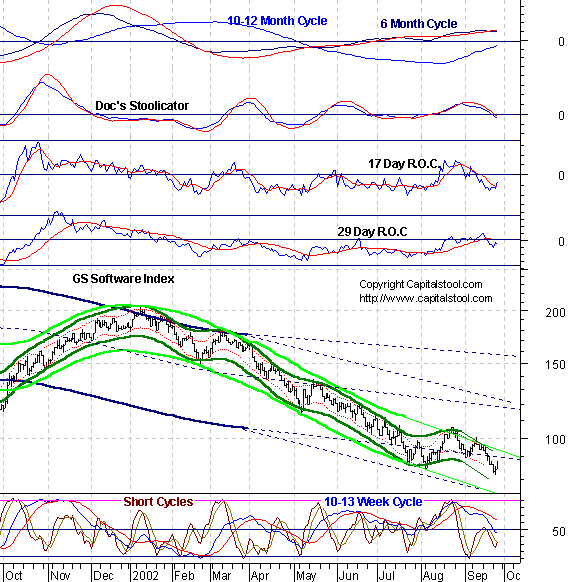
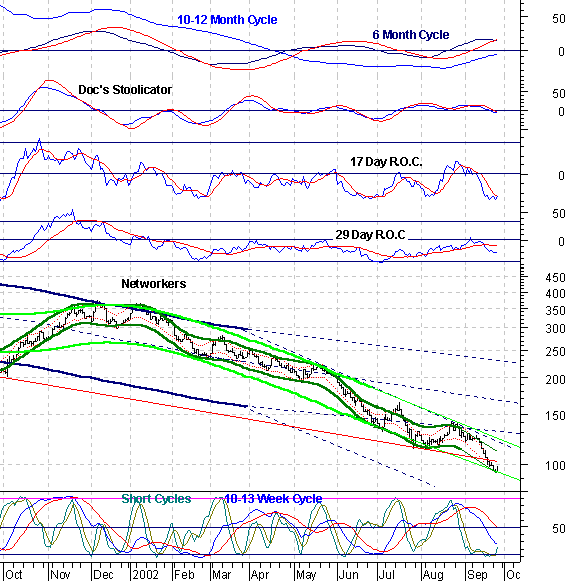
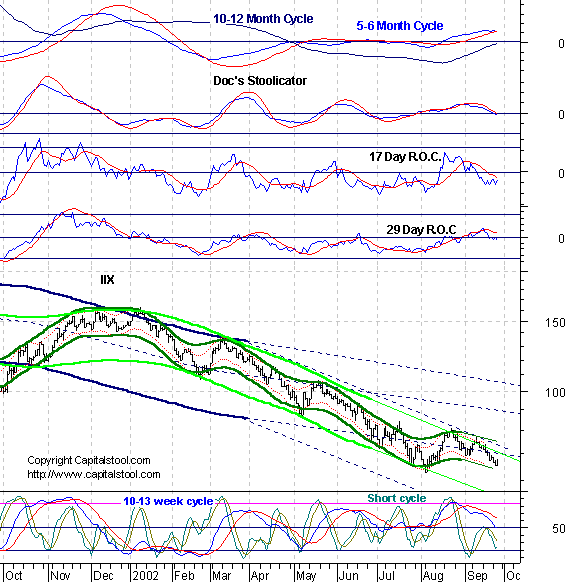
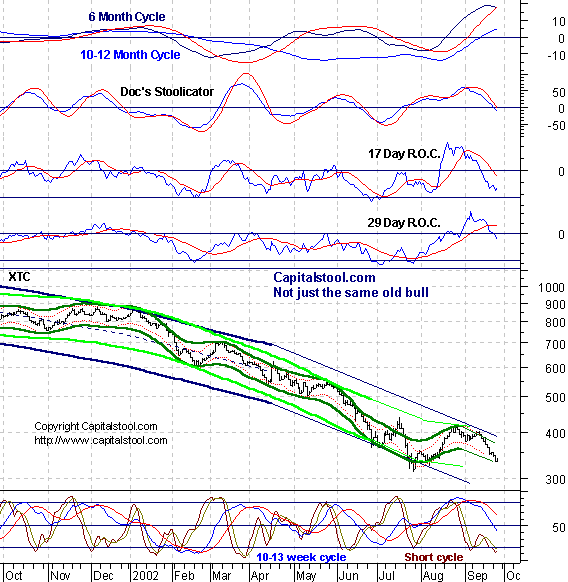
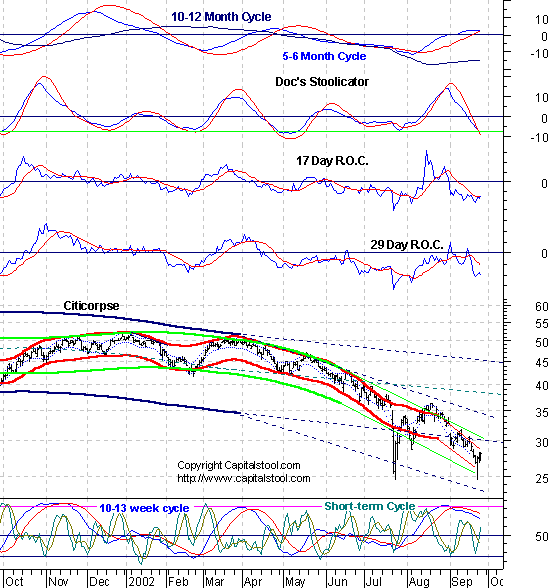
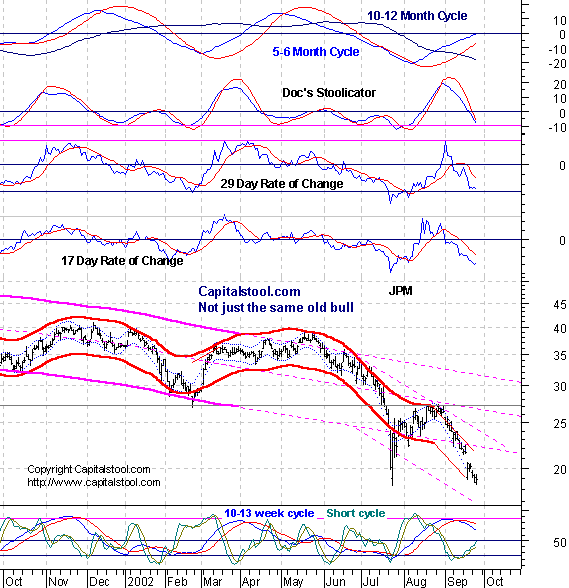
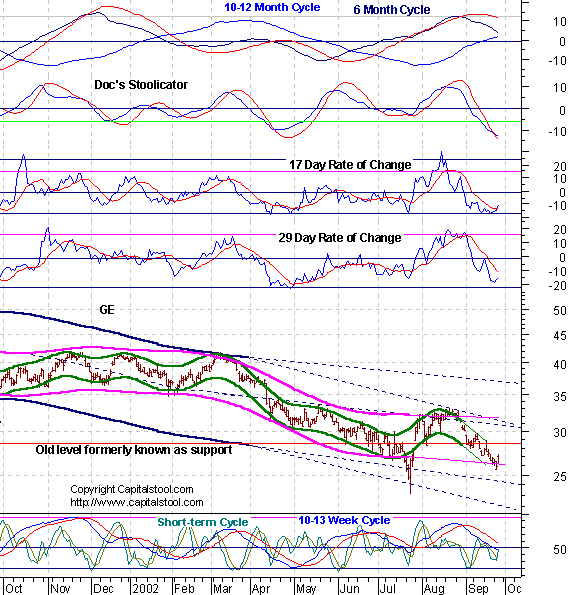
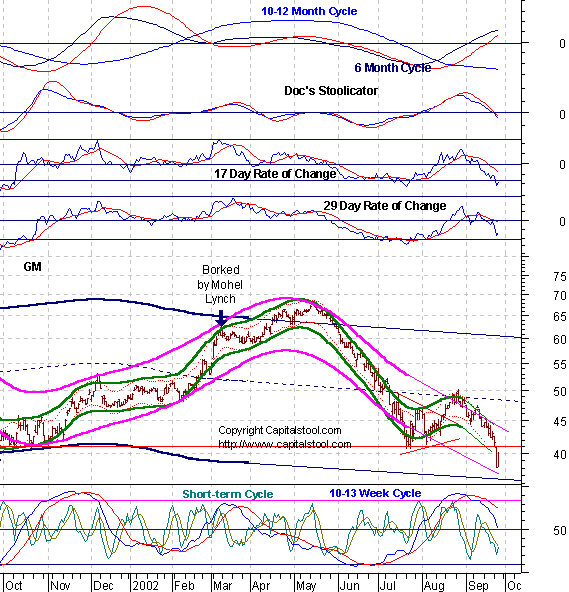
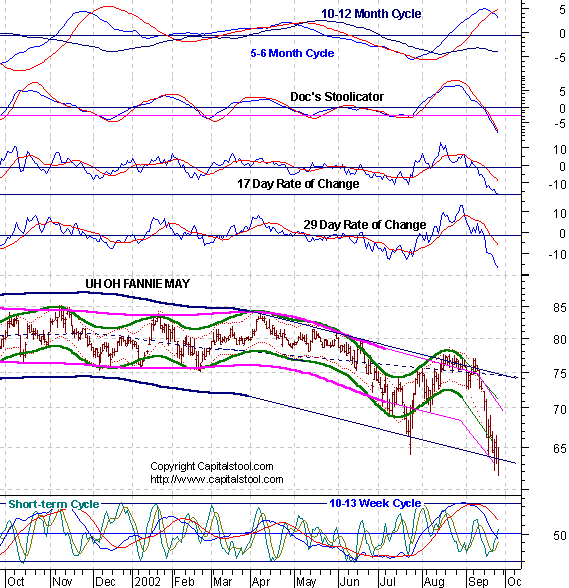
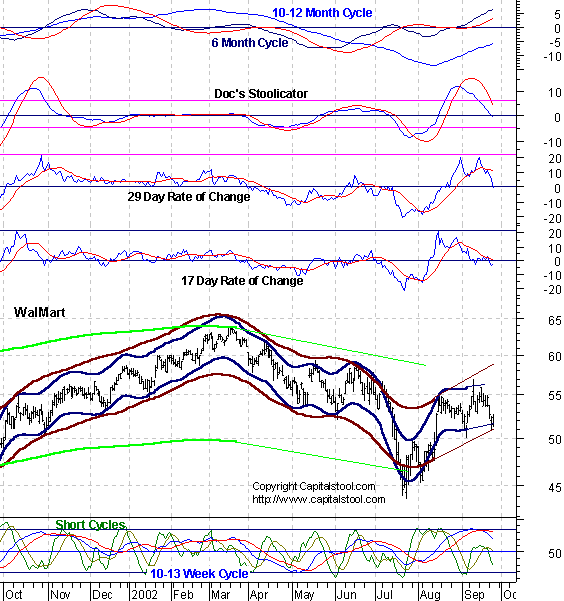
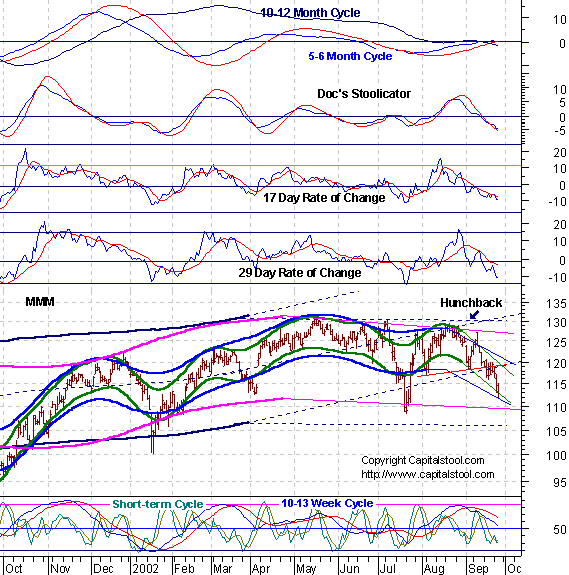
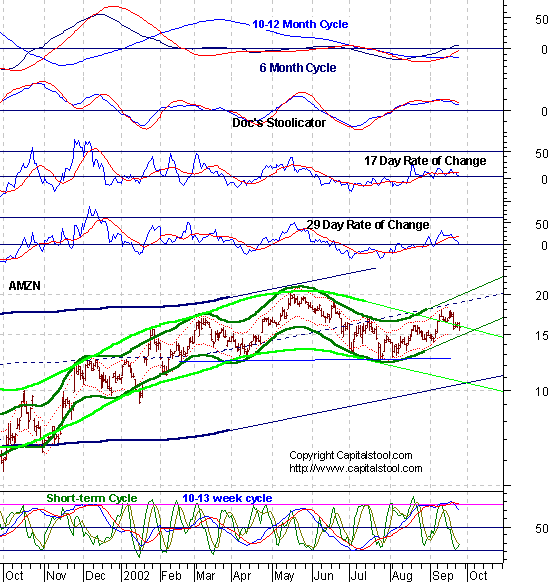
up phase. The top is not complete yet. Most suctors have a common pattern- Short cycle bounce off a double bottom, or some other form of major support. The 6 month cycle is either still up, or topping out, as the 10-13 week cycle heads lower for another couple of weeks. In sum, a mixed picture that should lead to churning for a week or two. Housing Bubble Druggies Biodrech Small Craps Energy Dow Transvestites Dirty SOX Soft Where Nutworkers Internuts Telecommies Stoolwethers- The same patter is evident in most leading stocks. Double bottom or other major level formerly known as support, and a short cycle upturn. 6 month cycle is still up, and the 10-13 week cycle is still down. In short, a mixed picture. The rally should flame out relatively quickly. Citicorpse JPM General Custer General McClellan Fat Ass Wally MMM- Amazin AhOL Crisco Horse Tell Horse Farmer In The Mr. Bill BM See you in Intraday Stool. Dr. Stepan N. Stool Share your thoughts on the Stool Pigeons Wire.
Renewals Welcome, and thank you for subscribing to the Anals of Stock Proctology. Your trial subscription will run for 90 days. At the end of that period your subscription will renew automatically, unless you cancel. If you wish to cancel your subscription use the button below. If you want to renew your subscription do nothing. Your subscription will renew and your credit card or Paypal bank account will be charged. If you want to renew, be sure your credit card information in your Paypal account is current. Paypal will not renew your subscription if the card has expired! Again, thanks for subscribing!
Explanation of Intraday Commentary-Build charts at http://www.livecharts.com. For custom time bars insert a comma after symbol and number of minutes, e.g. compx,90. This will give you a bar chart of the Nas with 90 minutes per bar. The one day cycle is usually most clear with 8 minute bars and 26/18 stochastics. It varies from day to day. Sometimes 6 minutes works best. Experiment to find the best fit for your trading style, and the market's dominant frequency at the time. The goal here is primarily to monitor the condition of the 8 and 13 day cycles. I typically use 90 minute bars with 26/18 stochastics for the 13 day cycle proxy on the indices during regular trading hours. Other cycles use 26/18 stochastics with the following: 8 days- 60 minute bars On the 24 hour futures charts, use a time per bar approximately 3 to 4 times the above number of minutes, to represent the cycles listed above. ABBREVIATIONS: cma: centered moving average
|
|||||||||||||||||||||||||||||||||||||||||||||||||||||||||||||||||||||||||||||||||||||||||||||||||||||||||||||||||||||

![[Most Recent HUI from www.kitco.com]](http://www.weblinks247.com/indexes/idx24_hui_en_2.gif)
![[Most Recent XAU from www.kitco.com]](http://www.weblinks247.com/indexes/idx24_sp500_en_2.gif)
![[Most Recent Quotes from www.kitco.com]](http://kitconet.com/charts/metals/gold/t24_au_en_usoz_2.gif)