|
Archives 12/30/01, 1/1/02, 1/2/02, 1/3/02, 1/4/02, 1/7/02, 1/8/02, 1/09/02, 1/10/02, 1/11/02, 1/14/02, 1/15/02, 1/16/02, 1/17/02, 1/18/02, 1/22/02, 1/23/02, 1/24/02, 1/25/02, 1/28/02, 1/29/02, 1/30/02, 1/31/02, 2/1/02, 2/4/02, 2/5/02, 2/06/02, 2/7/02, 2/9/02, 2/11/02, 2/12/02, 2/13/02, 2/14/02, 2/16/02, 2/19/02, 2/20/02, 2/21/02, 2/23/02, 2/25/02, 2/26/02, 2/27/02, 2/28/02, 3/1/02, 3/04/02, 3/05/02, 3/06/02, 3/7/02, 3/10/02,3/11/02, 3/12/02, 3/13/02, 3/14/02, 3/15/02, 3/18/02, 3/19/02, 3/20/02, 3/21/02, 3/22/02, 3/25/02, 3/26/02, 3/28/02, 3/30/02 4/1/02, 4/2/02, 4/3/02, 4/4/02, 4/6/02, 4/8/02, 4/9/02, 4/10/02, 4/11/02, 4/13/02, 4/15/02, 4/16/02, 4/17/02, 4/18/02, 4/20/02, 4/22/02, 4/23/02,4/24/02,4/25/02, 4/26/02, 4/27/02, 4/29/02, 4/30/02 5/01/02, 5/2/02, 5/4/02, 5/6/02, 5/07/02, 5/8/02, 5/09/02, 5/10/02, 5/13/02, 5/14/02, 5/15/02, 5/16/02, 5/17/02, 5/20/02, 5/21/02, 5/22/02, 5/23/02, 5/24/02, 5/28/02, 5/29/02, 5/30/02 6/01/02, 6/3/02, 6/4/02, 6/5/02, 6/6/02, 6/7/02, 6/10/02, 6/11/02, 6/12/02, 6/13/02, 6/14/02, 6/17/02, 6/18/02, 6/19/02, 6/20/02, 6/22/02, 6/24/02, 6/25/02, 6/26/02, 6/27/02, 6/30/02 7/1/02, 7/4/02, 7/5/02, 7/11/02, 7/14/02, 7/15/02, 7/16/02, 7/17/02, 7/18/02, 7/19/02, 7/22/02, 7/23/02, 7/24/02, 7/25/02, 7/27/02, 7/29/02, 7/30/02 8/1/02, 8/3/02, 8/5/02, 8/6/02, 8/7/02, 8/8/02, 8/10/02, 8/12/02, 8/13/02, 8/14/02, 8/15/02, 8/16/02, 8/19/02, 8/20/02, 8/21/02, 8/22/02, 8/23/02, 8/26/02, 8/27/02, 8/28/02, 8/29/02, 8/30/02 9/3/02, 9/4/02, 9/5/02. 9/6/02, 9/9/02, 9/10/02, 9/11/02, 9/12/02, 9/13/02, 9/16/02, 9/17/02, 9/18/02, 9/19/02
|
The Anals of Stock ProctologyPublished weeknights by
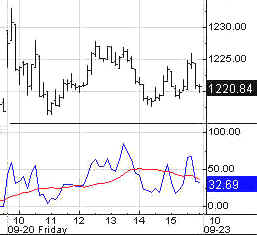
8:30PM Happy Acres, Florida Time The American Academy of Stock Proctology and Is your subscription up for renewal? If you want to renew, do nothing, unless your credit card has expired. Please be sure your credit card info is current. If your credit card has expired, you must enter the new expiration date in your Paypal account in order for your subscription to be processed. If you subscribed via Paypal, your subscription will be renewed for one year on the 90 day anniversary of your sign-up and your credit card will be charged. If you want to cancel, use the button at the bottom of the page. This applies only if you subscribed through Paypal. Mailed-in subscriptions are for 1 year. If you subscribed by prior contribution, I will send you a notice before your subscription expires. If you have any questions, see the subscription page and FAQ's. If you can't find the answer, email me. Update 9/23/02 1:00 PM Terms and methodology Sure enough, things got worse. The "what if" scenario came to fruition. This looks like one sick puppy. The 5 hour cycle low was hit around 10:30 and the 1 day low was hit around 12:30. The up phase so far has been pathetic. The strongest part of the day should be between 12:30 and 2. If this is the best they can muster so far, the logical conclusion is that the market is trending and that more steady erosion lies ahead. Upside cmaps on the 1 day cycle are preliminary. If exceeded add 5-6 points. On the other hand, things look so bad that we need to keep our guard up. The 5-8-13 day cycle lows are due, the AM downside cmaps have been hit, and the revised cmaps have been nearly hit. If there's no downside follow through later this afternoon, look for a few days of chop chop.
Update 9/23/02 9:50 AM Terms and methodology Revised cmaps based on opening action Nasty 1202, Sphincters 832, 100 NADS 856. HOWEVER, if those levels break, take it down another 10-15 points. We're on a slippery slope here. Update 9/23/02 8:40 AM Terms and methodology They were starting the usual 3 AM fucutures jam when JDS Uniphase gave an earnings warning. Yes you read that right. A warning at 3 AM New York time. So the jam turned into a whack. We should see weakness into the 5 hour low due at 10 AM, some recovery, then more downdraft into a second low around 11 AM to noon, which should be the 1 day cycle low. After that it gets tricky because the a 13 day cycle low could come at any time today or tomorrow. Doc would look for some kind of reaction when the 8 day cmaps below are reached. Probably just a weak swup.
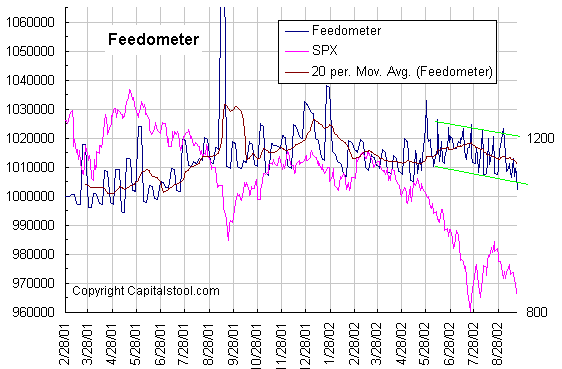
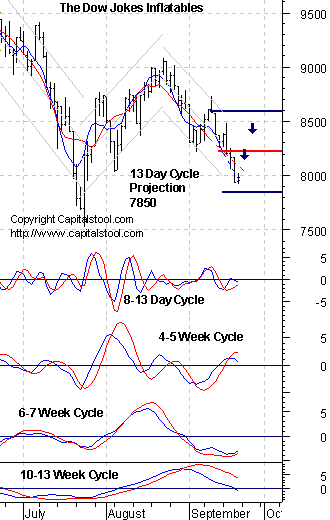
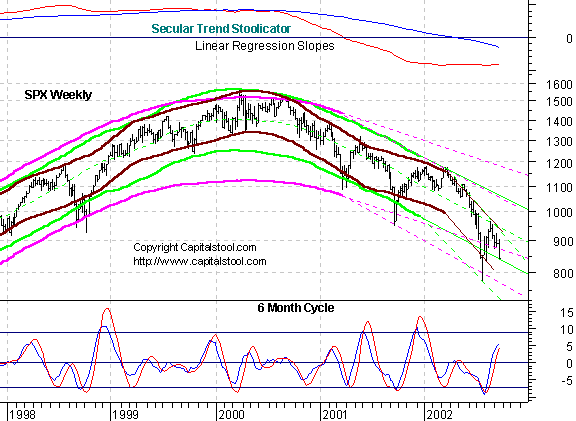
Doc does not make trading recommendations. This update reports intraday time cycle estimates and centered moving average projections based on the Hurst cycle analysis method. Doc assumes no responsibility for the accuracy or inaccuracy of these estimates and projections. The market may or may not meet these projections. New stoolies should thoroughly familiarize themselves with the methodology before trading based on this method. There is no free lunch. Those who do not have the time or inclination to develop a trading strategy based on testing and research should not trade. Trade at your own risk. Weak End Anals- Everyone Knows (9/20/02) Everyone "knows" the market is going to test the lows. Everyone "knows" that if the market breaks that support it's going much lower. Everyone "knows" that if the lows hold, the market will at least have a rally. So what's going to happen? Who knows? A number of stoolies are looking for a rise in the market. We see all the reasons. The market is Dover Sole (there's no such thing is o*ersold in a bear market). The putzcall ratio is sky high. The VIX is pretty high too. Major averages, sector indices, and individual stocks are resting at or near major levels formerly know as support. (Also no such thing in a bear market). It's true as well that the support levels we see are not simply double bottoms and trendlines, but they are also major long term cycle edge band projections. Thus, there is no doubt that we should expect a rally. Stoolie Sasquatch even raised the issue Saturday morning, with some very nice charts, on the Stool Pigeons Wire. Stoolie Old Habits Die Hard then raised the question of what would cause a turn? "Common sense tells me that we still have more high profile earnings warnings yet to come. The economy appears to be getting worse and accelerating to the depression side." Of course, common sense is never of any use in forecasting the market, so beware of that. Instead of common sense, you must train yourself in stock proctology's art of "contrary sense." In other words, as far as a bad economy, and bad news in general, consider this. The bad news argument is an argument "for", not "against", a bottom. Markets turn when the news is at it's worst. That's a fact. The market's low during the depression was in July 1932. Things actually got worse after that. The banks were closed in March 1933. Markets turn when the economy and corporate earnings are going to hell, and look like they'll only get worse, and usually do get worse for awhile. That's a fact. Doc reminds you that the economic news has nothing to do with stock prices. The market goes in either of two directions on bad news - up, or down. Ditto for good news. As stoolie Pile Driver says, "News is noise." What turns markets is liquidity, and we don't got none o' dat dere, in spite of the mortgage bulge. While the renewed mortgage bubble is creating liquidity, it is insufficient to offset those forces destroying liquidity, including the market itself, and the collapse of wndysrf's (Mark to Market) 700 story derivatives tower. Liquidity trends are getting worse and are being exacerbated by a suddenly cranky and unfriendly Greenie. There's just another problem. Market momentum. The market's momentum is horrendous, both long and short term. Unlike prior rallies in this bear market, the recent rally failed to penetrate the long term central regression line going back to March of 2000, while exhausting the pool of liquidity built up in the June July collapse. Short and intermediate mo are dropping like a rock, while longer term momentum indicators are correcting upwards. The rise in longer term indicators tells us that longer term investors are in a buying frame of mind. They did their selling in June and July. Now they want to buy. Their buying has slowed the market's descent over the last two months, and long term cycle and momentum indicators are rising as a result. But time is running out. We are reaching the point when the last group of buyers among the 6 month cycle people will have done their buying. Perhaps they can hold out long enough for some of the shorter term people to get on board with them. That will give the market another little bounce. And maybe that bounce will come now as the Nasdaq tests it August lows, or maybe it will come when the 30 Old Ladies and The Sphincters Index are touching their old bottoms from July and the Nas has already broken. Monday does not look like a propitious day for the bounce to start. The Fed did a major draining operation on Friday, and Doc suspects that put exercises will put pressure on the market as well, at least early in the day. Perhaps that could set up reversal day type conditions. A 13 day low at least, and perhaps a 6-7 week low, are due Monday or Tuesday. Monday will be the turn day if Al helps out. If not it should be Tuesday, from lower levels. Whether it's Monday or Tuesday, Doc thinks we need to see a good enema first. What respite may come after that, must give us pause, for in that respite lie the seeds of the market's final destruction. This rally that everyone knows is coming will not be a 10-13 week cycle upturn, and it will be in the context of a six month cycle top, the base of which is the line across the market's lows. Once that line breaks, a decline lasting well into the first quarter of 2003 will be under way. The outlook is summed up in Doc's new audio weak end comment. New! Live Stool Audio! Doc's Market Outlook The Feed drained $5.75 billion with a $1.75 billion weekend matched sale-purchase, while allowing $4 billion in overnight repos to expire. Monday, the $1.75 billion comes back as an addition. There are no repos rolling over. The market will need a lot more help that the $1.75 billion if they want to get a decent rally going. The draining takes the Total Feed slightly below the 8% growth channel (blue) and the distance below the 10% growth channel is growing. This is really beginning to smell like a slowing in Feed growth. Maybe they are saving up for an enormous Feed blast when the market breaks down. Or maybe Al's just worried about the burgeoning gummit deficits. Who knows? Whatever, he's definitely getting in a foul and uncooperative mood. Three trends are evident on
the Feed Index. One is the 10% growth trend beginning in May of 2001. Feed
growth has recently been at or below the lower boundary of that trend. The
blue channel going back to last December suggests that Al may now be
targeting an 8% growth rate. Then there's the golden box which says he's stopped growing Feed altogether over the last three months. The Feedometer has collapsed below its recent range. In that regard it was a miracle the market held up as well as it did Friday afternoon. Doc will attribute that to the unwinding of short stock short put hedges and some selling in bonds later in the afternoon. The huge question, the importance of which cannot be overstated, is whether the Feed intends to continue tapping the brakes. Normally we'd expect a big Feed from this level on the Feedometer. We'll see. Doc continues to feel that without major feeding, the stock market will be on a death march. The
Feedometer theoretically
measures excess Feed available for bond or stock market jamming.
All of Doc's
cycle charts
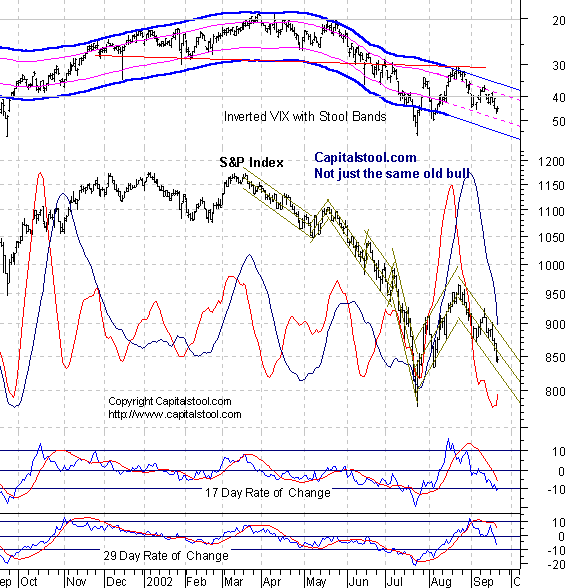
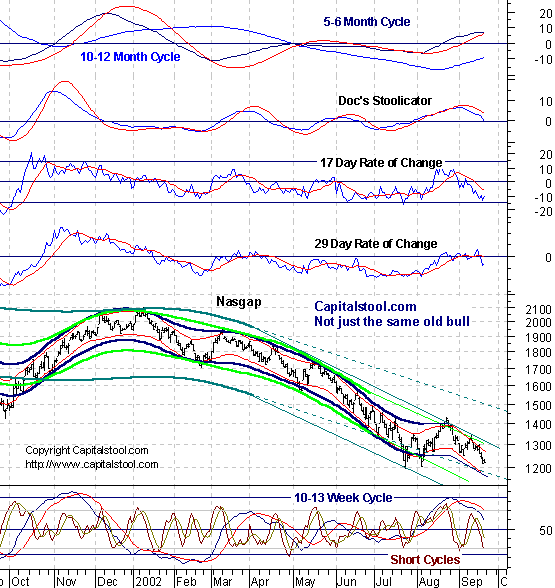
are powered by METASTOCK Portfolio Sphincters Index (SPX) and Sentiment The SPX remained in the lower portion of its linear regression channel from the August high. Both the 17 day and 29 day rates of change are downtrending, suggesting sustained downside. Virtually everyone expects a little bounce. Whether it comes from slightly above or below the July lows depends on whether the stage managers need to build more short inventory, and whether they have the firepower to trigger a rally. On the first point the answer is probably yes they need more short inventory, but on the second point the answer may be no, unless they get a lot of help from the Fed. Market makers have had to absorb quite a pounding in recent months without much help for much of the time. In the case of Fleet Specialists, which has been pummeled with disaster after disaster, starting with Enron, it took another pounding this week with EDS. You have to wonder how their capital is holding up especially given all their other well documented problems.. The superimposed 6-7 week cycle oscillator finally turned up from the lowest level this indicator has reached in this bear market. This indicator will correct upward barring anything less than a total collapse in price. As it does so, the market's vulnerability to sharp drop will only increase. That turn coincides with a temporary reduction in selling pressure, an uptick in short covering, and a resulting bounce in the market. But even if it bounces, the trend is still down and a really big move down will come after that indicator has corrected upward a bit. The 10-13 week cycle oscillator continues to plunge. It should be 2 to 5 weeks before a cycle low. Any bounces would be within the context of this cycle's down phase. The VIX dropped back to
44.55.
It is holding in the center of the inverted scale 6 month cycle Stool band.
This is not a configuration that suggests an important low. A reading near 60, and possibly a good deal higher, is likely before
the next 10-13 week cycle low. As for where the indicator will
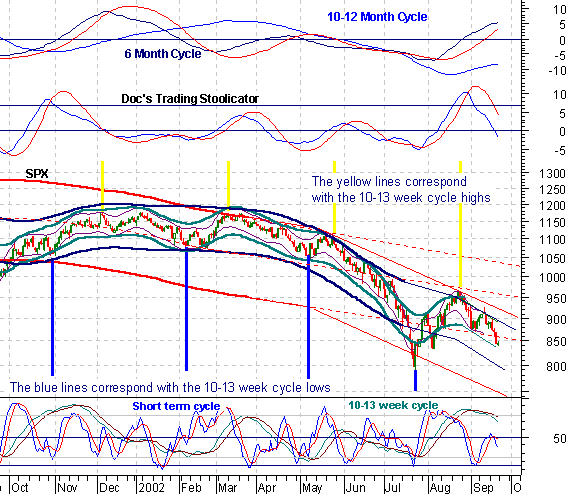
be at the major cycle low? Who knows? The short cycle oscillator is heading down, in position to drop for at least several days, which is time for plenty of damage in a weak trend. There's still a question of whether the 6-7 week cycle low is due now, or was at the beginning of the month. If it was, the market can drop like a stone over the next 3-4 weeks as this cycle gets in gear with the down phase of the 10-13 week cycle. How will we know? A failure to have a significant rally starting in the next 2 days would be a good start toward that end. The 10-13 week cycle
oscillator has
begun to accelerate down, but is still at an extremely high level. Again,
room and time enough for a huge drop. It looks to Doc like the 6 month
cycle is starting also to turn down, along with possibly the 10-12 month
cycle. Doc has drawn channels on the chart showing that the SPX could
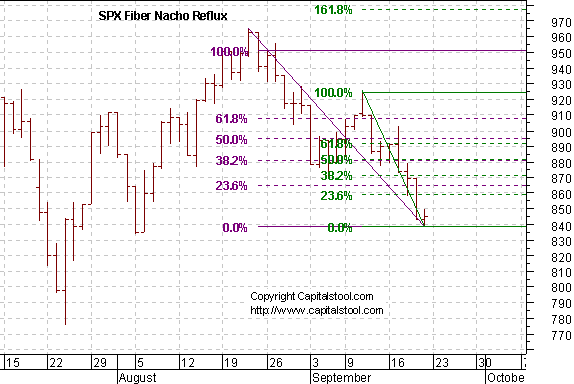
easily break below 750. The 10-13 week cycle low cmap
is now 750. In the short run, we're looking at 800.
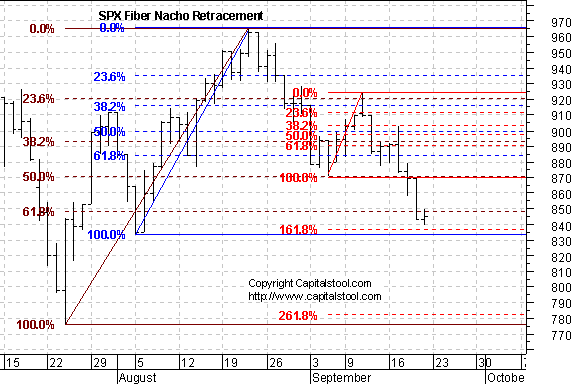
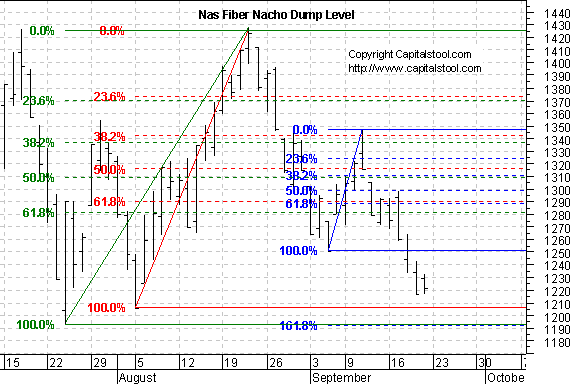
Fiber Nacho Dump- Support levels and downside targets.
Fiber Nacho Reflux- Resistance levels and upside targets
The long term chart shows a couple of alternative channels. If the market
does not bottom right here, then it will
almost certainly break 750 over the next couple of months. The 6 month
cycle oscillator hasn't even turned down yet. When it does, a sever
decline will be under way. Below is the linear regression channel chart you saw earlier this week. Ridin' the Rails- Doc loves this chart. He drew a series of linear regression channels connecting various highs and lows, then extrapolated the regression lines forward to the present and future. The actual regressions begin and end at the verticals of the same color. The lines are extrapolated beyond the right vertical. As you can see, price has continually regressed to the trend projection first established between March 2000 and April 2001 (red). Except this time, instead of breaking through the mean to head for the top of the channels, the rally failed at the mean regression projection. Each rally phase of the bear is shown in the magenta regression channels. The channels are established by including the data from the first six weeks after each low, then projecting forward. In spite of massive volatility, the recent rally had the weakest slope and failed at the lowest level relative to the long term trend. This situation is far different
from anything we've seen before. The retest of the low, two months after
the July low is turning a lot of people bullish. To Doc, It looks as
though the market is weaker than ever, and is more likely to break out of
the trend channels to the downside, than reverse. The Cycle Conditions tables include cycle phase and a wild guess as to number of periods to the next turn, in days for the shortest cycles, weeks (W) or months (M) for the longer ones. This is a fluid exercise, in other words, the projections are likely to be wrong, but they force us to be vigilant for key turning points, and frequently work well enough to prevent costly misreadings. SPX Cycle Conditions as of 9/20/02
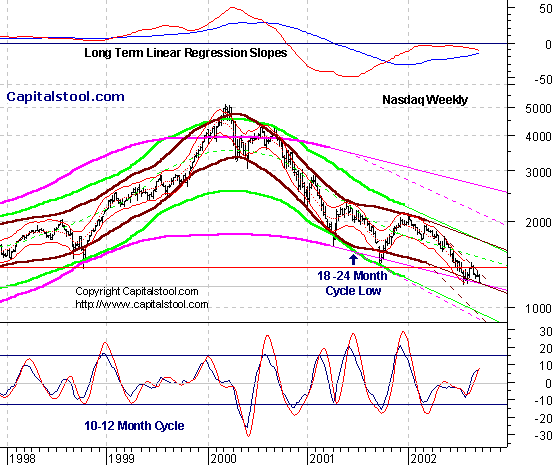
PTT - Periods Till Turn Nasgap Charts The Nas held above the August low, in what many will view as a successful retest. Doc has his doubts, as he's already enumerated. True, they try to draw a line in the sand here. But it's just sand. Oops, here comes a wave. Goodbye line. The 17 and 29 day rates of change remain in downtrends. Even short term lows are usually preceded by a small double bottom or positive divergence in mo. We don't see that here. The 10-13 week cycle is in a down phase that should last 3-5 weeks, plenty of time for a lot more downside, even with an intervening bounce. The 6 month cycle indicator is topping out. Very late, but consider that it was late at the top of the cycle in the summer, and the Nas dropped 500 points from the point of the signal. This is a similar situation, with the slope of the "up" phase having only been flat just like it was last May. The 4 week cycle has turned down. The 6-7 week cycle is either within 2 days of a low, or is just topping out. There's the big question mark. The cmap on that cycle looks like 1180 for now. The short cycle oscillator is down near Dover Sole again. That would be consistent with a 13 day cycle low within a day or two, if not already. The long
term cycle channel has two possible paths. Doc would choose the lower one,
but the jury is still out. Things could bump along within the dotted line
channel for months. But if Doc is right, and this is a six month cycle
top, the Nasty is headed for a number that begins with "10" next
month. The early 10-13 week cycle projection is 1090.
Fiber Nacho Dump- Support levels and downside targets.
Fiber Nacho Reflux- Resistance levels and upside targets
The long term chart shows the Naz at a key infartion point. Is it going to
follow the track in the solid lines, and bounce off support here, or is it
going to accelerate down within the dotted line channels. The 6 month
cycle oscillator is just topping out, indicating that a breakdown is
likely in the weeks ahead. Nasdaq Cycle Conditions as of 9/20/02
PTT
- Periods Till Turn AM Edition Features (Previous) These features are in morning edition, published around 9 AM ET US, or the Saturday Weak End Edition, published, uh, let's see, Saturday! Golden Stool Doc thinks
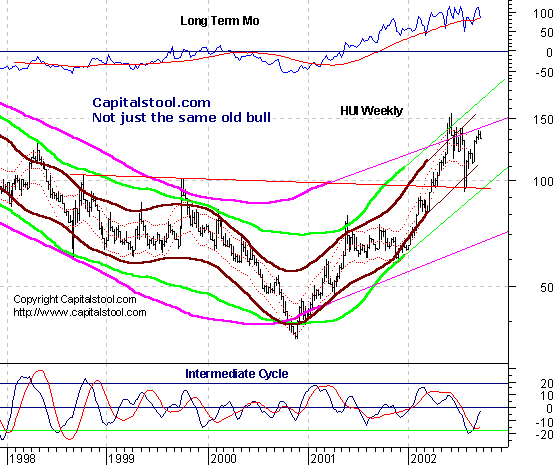
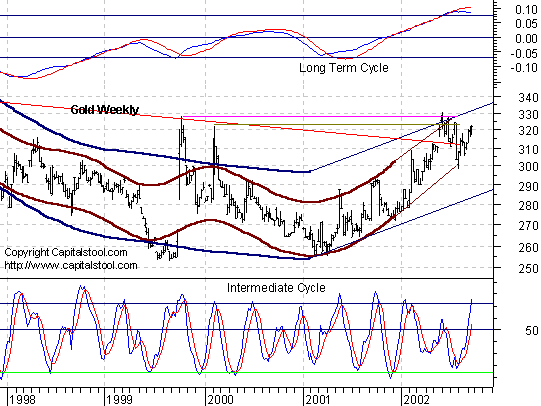
there's a good chance the gold stocks, which have been in an enormous bull
market for 22 months, could enter a corrective phase lasting 6 months,
similar to the one in 2001. Likewise for
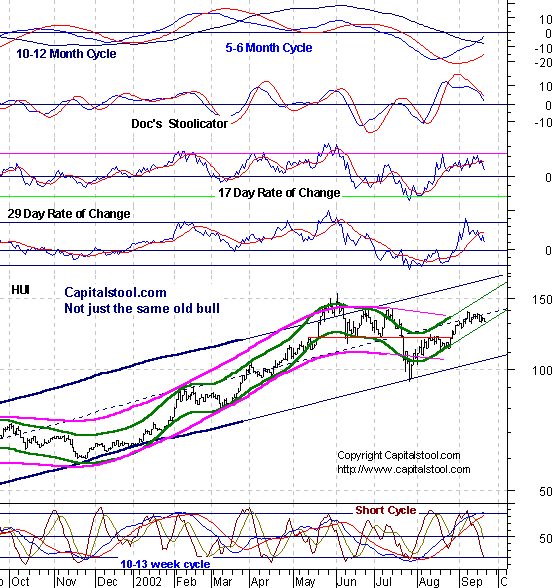
the metal. The uptrend is tired. On the daily
chart of HUI, the two month long uptrend is at a critical juncture. One
more bounce and then a painful pullback appears to be in the offing. Short
term downside cmap is 128, and upside is 145.
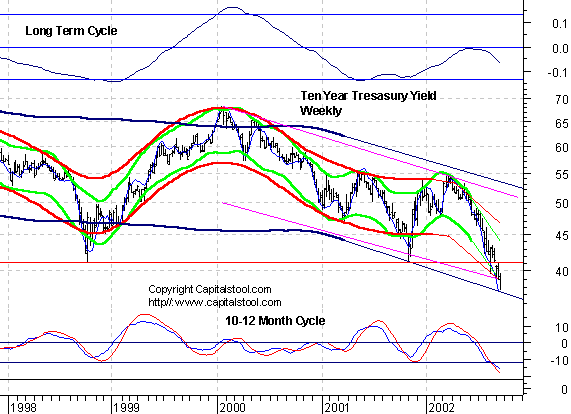
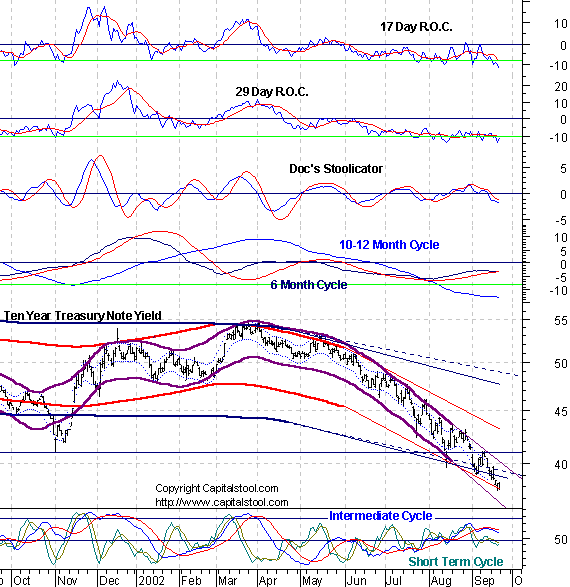
Bond yields are within 6 bps of the long term cmap of 3.70 and are
scraping the bottom of trend channels. We are looking at the beginnings of
a bottom. We'll have to watch the daily chart for signs of the reversal.
The breaking of the lower long term cycle projection line is a sign that
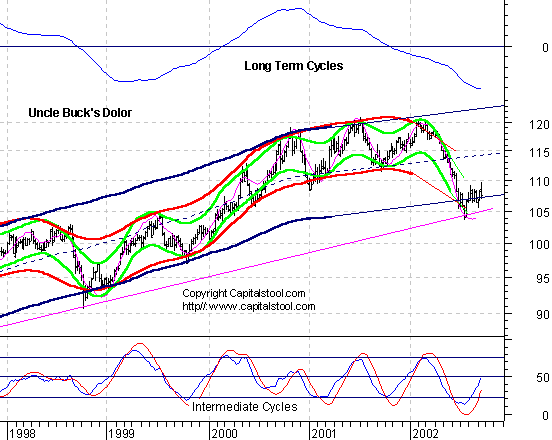
we are almost there. Uncle Buck's Illness
Buck is in a sideways intermediate up phase. He has lots of support in
the105-108 area, not because his health is so good, but because all the
other patients in his ward are sick as dogs too. In the Foreign Exchange
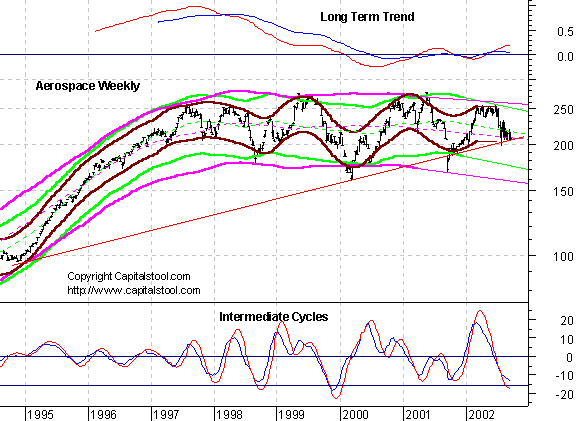
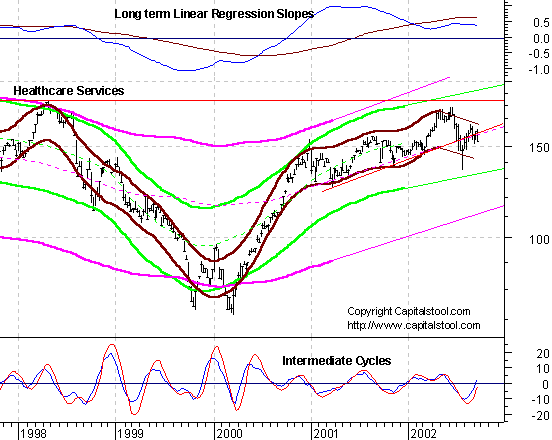
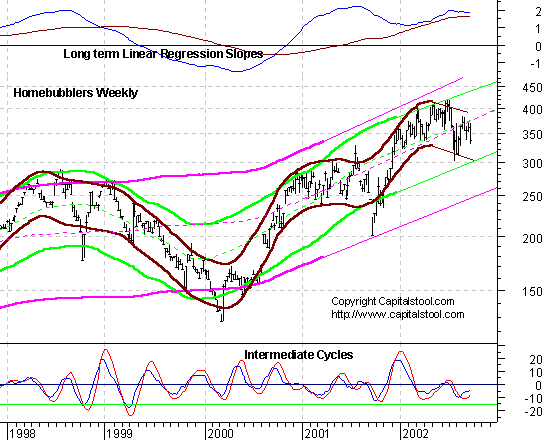
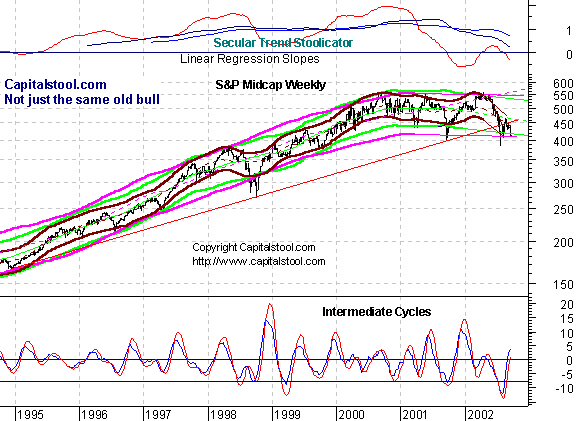
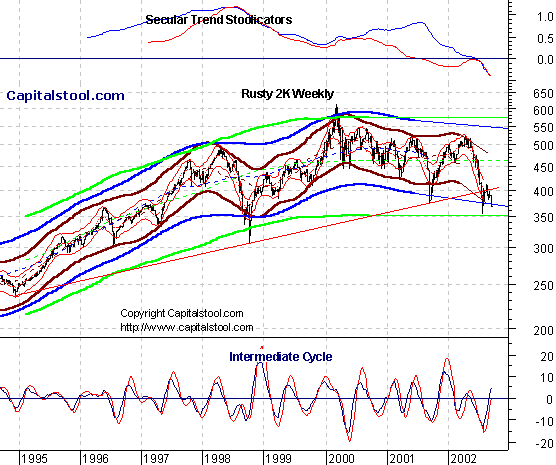
Hospital, everything is relative. Suctor Watch - Long Term Most sectors are trading near long term support. There's every reason to think they'll get down there and bounce. This is the scenario that Doc has been talking about for weeks, the "engineered bottom." The bounce will quickly peter out. After that we may get a series of retests or bounces before the final breakdown, or they'll just breakdown after the first bounce. We'll cross those bridges when we get to them. First comes the test. Aerospace- Perspective is a
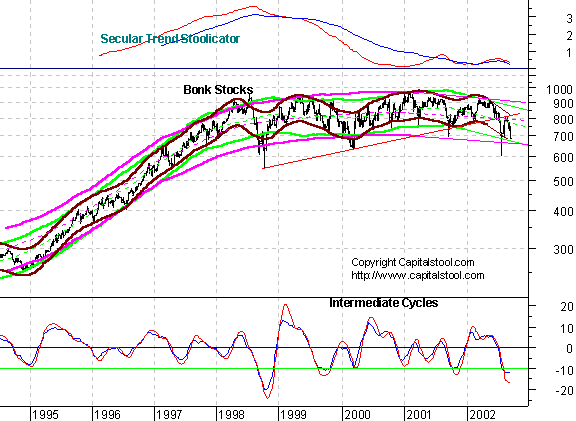
beautiful thing. Bonkers- Lowest interest
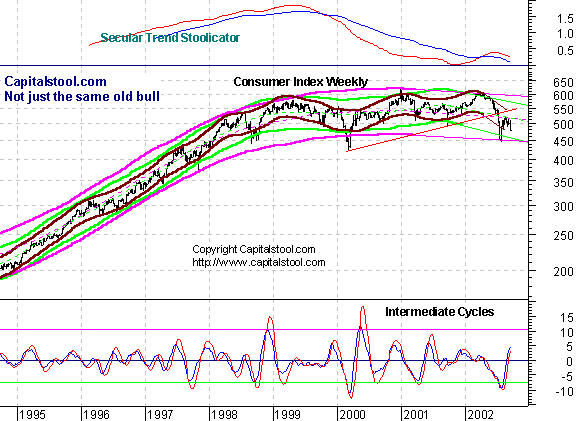
rates in 40 years and this is the best they can do. Consumer- If this is the up
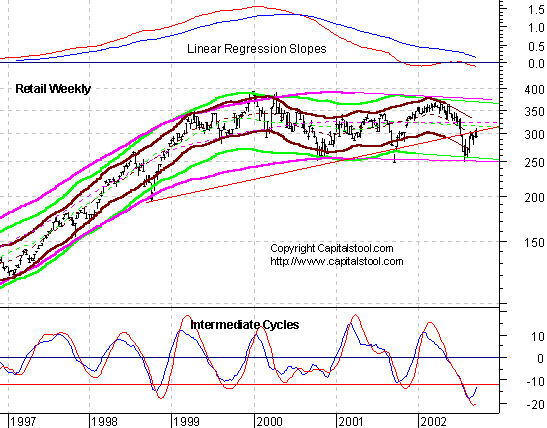
phase, can't wait to see the down. Retail- No Christmas this
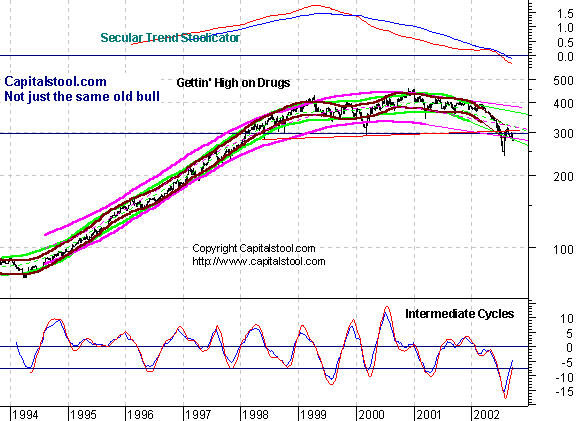
year. Drugs- Gee, think there's
any downside here? HMO's- Sick. Housing Bubble- Getting a
hunchback Mid-craps- Mercy, are these
in trouble or what! Small craps- The shmaller
dey are the woise dey shtink. Energy Crisis- Only for
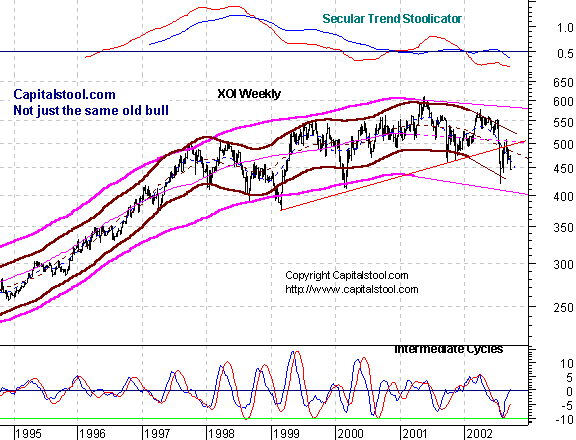
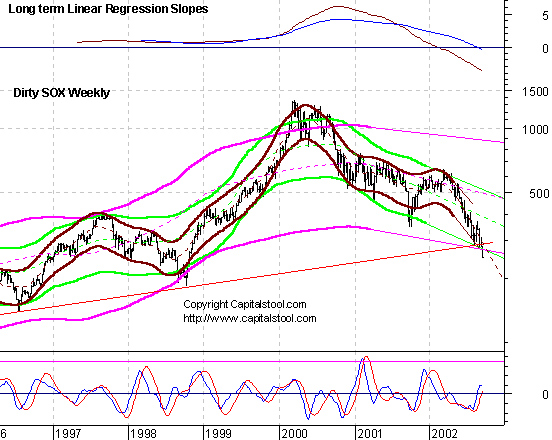
those who own the stocks. SOX- When a very long term
cycle band projection is broken, it's either a bottom and prices snap
back, or the drawing is wrong and the lines have to be redrawn. This will
be the latter, based on the fact the intermediate cycle indication ifs of
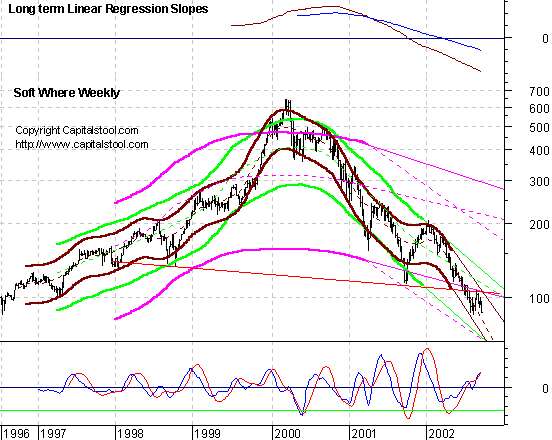
a top, not a bottom. Soft Where- Here's an
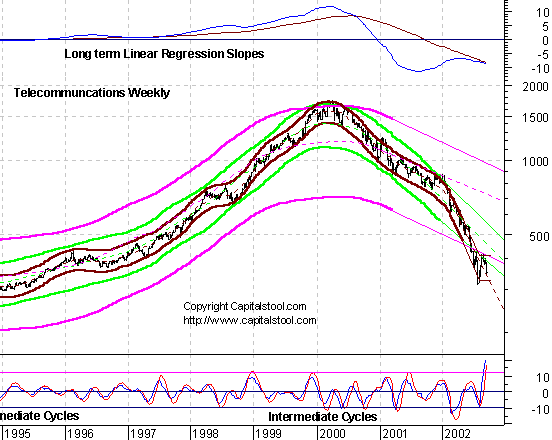
example. By the way, the cmap is 50. It's at 86 now. Telecommies- Here's
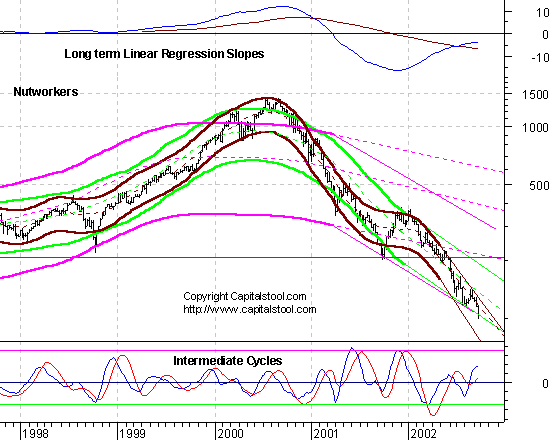
another. The 1 year cmap on this is 250. It's 350 now. Nutworkers getting nuts
crushed. How gruesome. One year cmap is negative fifty. Spelled it out
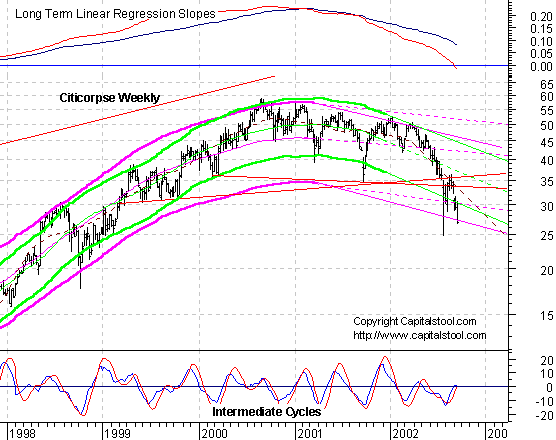
because don't want you to think it was a typo. Stoolwethers Citicorpse- Click for detailed analysis.
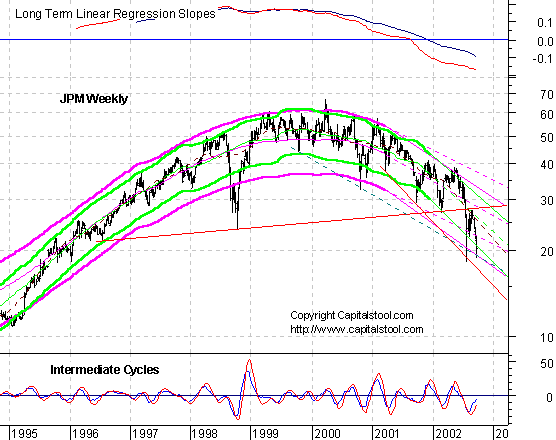
JPM- Anotehr example of
progressive breakdown. A major effort will be made to hold this here.
Unfortunately, the long term cmap is $4. No, that's not a typo. FatAss- First stop on the
way to oblivion is 63. General Custer-
Intermediate cmap is 24. long term, 12. General McClellan - May
finally cross the Potomac- Intermediate cmap is 35. Longer term only 30. Market Maker Management -
The Dow's heavyweight, tool of the stage managers will cruise back to 100,
then up one more time to complete the top. PiG- The other favorite of
stage managers. Again, nothing like a little long term perspective. End of
the line. Long term up cycle cmap is 95. Wally- Likely to be the
last man standing. BM- 55, 40 or fight! Mr. Bill- 30 then 20, but
give it a year to get there. See you in Intraday Stool. Dr. Stepan N. Stool Share your thoughts on the Stool Pigeons Wire.
Renewals Welcome, and thank you for subscribing to the Anals of Stock Proctology. Your trial subscription will run for 90 days. At the end of that period your subscription will renew automatically, unless you cancel. If you wish to cancel your subscription use the button below. If you want to renew your subscription do nothing. Your subscription will renew and your credit card or Paypal bank account will be charged. If you want to renew, be sure your credit card information in your Paypal account is current. Paypal will not renew your subscription if the card has expired! Again, thanks for subscribing!
Explanation of Intraday Commentary-Build charts at http://www.livecharts.com. For custom time bars insert a comma after symbol and number of minutes, e.g. compx,90. This will give you a bar chart of the Nas with 90 minutes per bar. The one day cycle is usually most clear with 8 minute bars and 26/18 stochastics. It varies from day to day. Sometimes 6 minutes works best. Experiment to find the best fit for your trading style, and the market's dominant frequency at the time. The goal here is primarily to monitor the condition of the 8 and 13 day cycles. I typically use 90 minute bars with 26/18 stochastics for the 13 day cycle proxy on the indices during regular trading hours. Other cycles use 26/18 stochastics with the following: 8 days- 60 minute bars On the 24 hour futures charts, use a time per bar approximately 3 to 4 times the above number of minutes, to represent the cycles listed above. ABBREVIATIONS: cma: centered moving average
|
|||||||||||||||||||||||||||||||||||||||||||||||||||||||||||||||||||||||||||||||||||||||||||||||||||||||||||||||||||||


![[Most Recent HUI from www.kitco.com]](http://www.weblinks247.com/indexes/idx24_hui_en_2.gif)
![[Most Recent XAU from www.kitco.com]](http://www.weblinks247.com/indexes/idx24_sp500_en_2.gif)
![[Most Recent Quotes from www.kitco.com]](http://kitconet.com/charts/metals/gold/t24_au_en_usoz_2.gif)