|
Archives 12/30/01, 1/1/02, 1/2/02, 1/3/02, 1/4/02, 1/7/02, 1/8/02, 1/09/02, 1/10/02, 1/11/02, 1/14/02, 1/15/02, 1/16/02, 1/17/02, 1/18/02, 1/22/02, 1/23/02, 1/24/02, 1/25/02, 1/28/02, 1/29/02, 1/30/02, 1/31/02, 2/1/02, 2/4/02, 2/5/02, 2/06/02, 2/7/02, 2/9/02, 2/11/02, 2/12/02, 2/13/02, 2/14/02, 2/16/02, 2/19/02, 2/20/02, 2/21/02, 2/23/02, 2/25/02, 2/26/02, 2/27/02, 2/28/02, 3/1/02, 3/04/02, 3/05/02, 3/06/02, 3/7/02, 3/10/02,3/11/02, 3/12/02, 3/13/02, 3/14/02, 3/15/02, 3/18/02, 3/19/02, 3/20/02, 3/21/02, 3/22/02, 3/25/02, 3/26/02, 3/28/02, 3/30/02 4/1/02, 4/2/02, 4/3/02, 4/4/02, 4/6/02, 4/8/02, 4/9/02, 4/10/02, 4/11/02, 4/13/02, 4/15/02, 4/16/02, 4/17/02, 4/18/02, 4/20/02, 4/22/02, 4/23/02,4/24/02,4/25/02, 4/26/02, 4/27/02, 4/29/02, 4/30/02 5/01/02, 5/2/02, 5/4/02, 5/6/02, 5/07/02, 5/8/02, 5/09/02, 5/10/02, 5/13/02, 5/14/02, 5/15/02, 5/16/02, 5/17/02, 5/20/02, 5/21/02, 5/22/02, 5/23/02, 5/24/02, 5/28/02, 5/29/02, 5/30/02 6/01/02, 6/3/02, 6/4/02, 6/5/02, 6/6/02, 6/7/02, 6/10/02, 6/11/02, 6/12/02, 6/13/02, 6/14/02, 6/17/02, 6/18/02, 6/19/02, 6/20/02, 6/22/02, 6/24/02, 6/25/02, 6/26/02, 6/27/02, 6/30/02 7/1/02, 7/4/02, 7/5/02, 7/11/02, 7/14/02, 7/15/02, 7/16/02, 7/17/02, 7/18/02, 7/19/02, 7/22/02, 7/23/02, 7/24/02, 7/25/02, 7/27/02, 7/29/02, 7/30/02 8/1/02, 8/3/02, 8/5/02, 8/6/02, 8/7/02, 8/8/02, 8/10/02, 8/12/02, 8/13/02, 8/14/02, 8/15/02, 8/16/02, 8/19/02, 8/20/02, 8/21/02, 8/22/02, 8/23/02, 8/26/02, 8/27/02, 8/28/02, 8/29/02, 8/30/02 9/3/02, 9/4/02, 9/5/02. 9/6/02, 9/9/02, 9/10/02, 9/11/02, 9/12/02, 9/13/02, 9/16/02, 9/17/02, 9/18/02, 9/19/02, 9/20/02, 9/23/02, 9/24/02, 9/25/02, 9/26/02, 9/27/02, 9/30/02 10/1/02, 10/2/02, 10/3/02, 10/4/02, 10/7/02, 10/8/02, 10/9/02, 10/10/02, 10/11/02, 10/14/02, 10/15/02, 10/16/02, 10/17/02, 10/18/02, 10/21/02, 10/22/02, 10/23/02, 10/24/02, 10/25/02, 10/28/02, 10/29/02, 10/30/02, 10/31/02 11/1/02, 11/4/02, 11/5/02, 11/6/02, 11/7/02, 11/8/02, 11/11/02, 11/12/02, 11/13/02, 11/14/02, 11/15/02, 11/18/02, 11/19/02, 11/20/02, 11/21/02, 11/22/02, 11/25/02, 11/26/02, 11/27/02, 11/29/02
 Doc's view of the Street. |
The Anals of Stock ProctologyPublished weeknights by
8:30PM Happy Acres, Florida Time The American
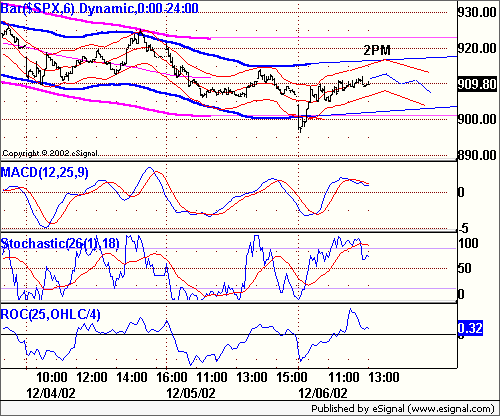
Academy of Stock Proctology and Is your subscription up for renewal? If you want to renew, do nothing, unless your credit card has expired. Please be sure your credit card info is current. If your credit card has expired, you must enter the new expiration date in your Paypal account in order for your subscription to be processed. If you subscribed via Paypal, your subscription will be renewed for one year on the 90 day anniversary of your sign-up and your credit card will be charged. If you want to cancel, use the button at the bottom of the page. This applies only if you subscribed through Paypal. Mailed-in subscriptions are for 1 year. If you subscribed by prior contribution, I will send you a notice before your subscription expires. If you have any questions, see the subscription page and FAQ's. If you can't find the answer, email me. Doc does not make trading recommendations. This update reports time cycle estimates and centered moving average projections based on the Hurst cycle analysis method. This publication is for entertainment and educational purposes only. Doc assumes no responsibility for the accuracy or inaccuracy of the estimates and projections presented. The market may or may not meet the projections. Stoolies should thoroughly familiarize themselves with the methodology before trading based on this method. Those who do not have the time or inclination to develop a trading strategy based on testing and research should not trade. Trade at your own risk. Yadda yadda. How's your motha? Be a Johnny Applestool! Help spread the Stool! Feel free to repost snippets from the Anals on message boards around the web. Just give a link back! Many tanks - Doc AM Update 12/6/02 1 PM The 8-13 day cycles turned up. No surprise there. It's hard to say if the upslope will be more than zero, but it looks flat at this point. A 1 day cycle high is due at any time over the next hour. Upside cmaps are iffy because of the overshoot on the opening selloff. It could be anywhere form 912 to 920, if there's a jam. Should be soft after 2 PM. Something like this. 5-8 Day Cycle______ 2-3 Day Cycle_______ 5 Hr-1 Day Cycle
AM Update 10:15 AM Here's how it looks at this point. 5-8 Day Cycle______ 2-3 Day Cycle_______ 5 Hr-1 Day Cycle
Pre Market Update 12/6/02 9:15 AM Based on the fucutures break, the AM downside cmap drops to 893. As we saw yesterday, the fucutures can be misleading at times, but other than the fact that the opening pop is going in the opposite direction, the outlook posted last night looks about right. Just shift the channels a couple of points lower. Here's how the spiders might play. Update here around 10 AM. 5-8 Day Cycle______ 2-3 Day Cycle_______ 5 Hr-1 Day Cycle
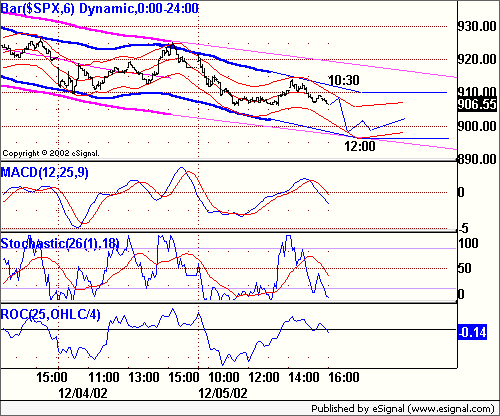
Turdsday's Markets (12/5/02)
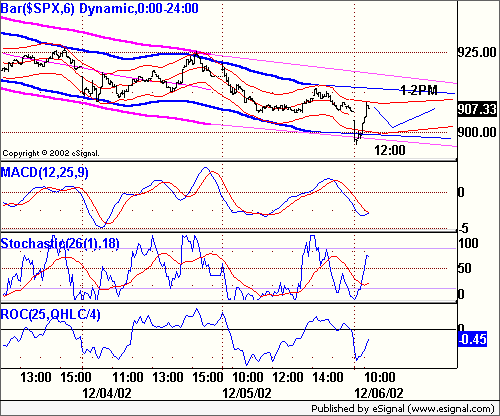
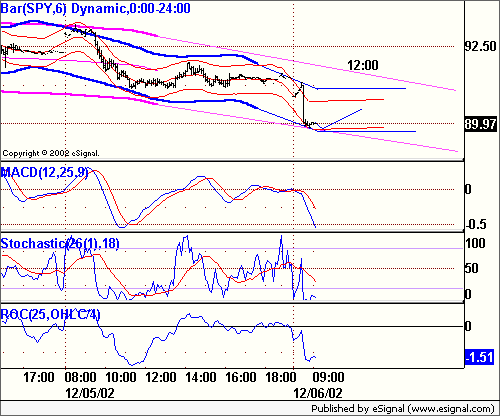
Intraday - The market completed a 1 day cycle high with a minor pop on the open. We were expecting a little more oomph based on the fucutures, but there was no gas. Too much Feed draining perhaps? The market drifted lower, making a double bottom at the 5 hour and 1 day lows at 11:30 and 1:30. They went up for an hour, but again, didn't get far. The high came at 2:15. Friday morning, allow for an early pop on news, whatever it may be, (it doesn't matter) but the market should be weak into the 5 hour-1 day cycle low due anywhere from 11:30 through 1:30 at a cmap of 903.50 to 904.75. If they shake 'em under 900, it's a fakeout. We should see at least a swup in the afternoon. Here's how Doc expects the first half of the day to shape up. Check back for update at 9:15 AM. 5-8 Day Cycle______ 2-3 Day Cycle_______ 5 Hr-1 Day Cycle Cmaps and times
are guidelines only. Cycles vary in wavelength and amplitude. Directional changes
within an hour of the expected turn and a few points of the cmap should be
respected. The indicators rule.
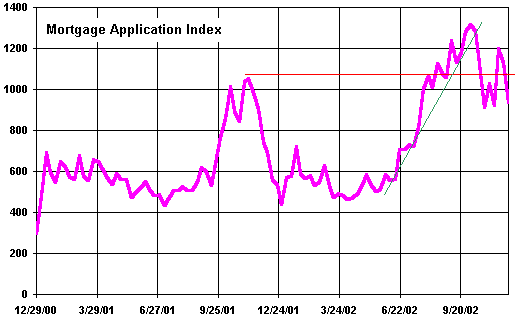
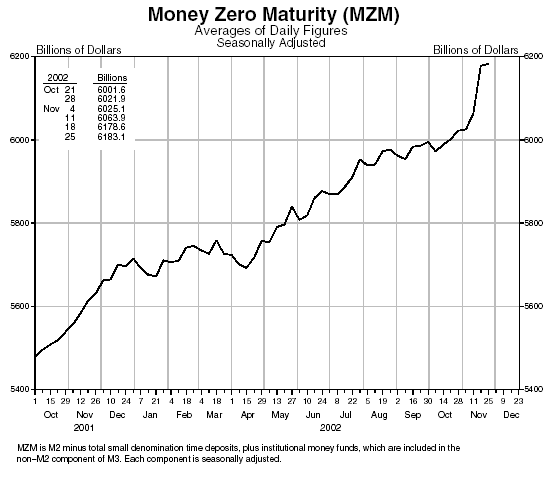
The Naked Emperor (12/5/02) Last night Doc showed you the MoGauge for the week ended 11/29 and talked about the theory that mortgage originations leads directly to money creation.
Now we get to see the results of all that money creation. Last week the Fed didn't publish its charts, but this week here it is in all it's ugliness, the explosive growth of MZM as a result of the mortgage bubble. This is probably the final blowoff . The explosion came about 6 weeks after the peak in mortgage applications. We know that simultaneously, economic data was popping up here and there, particularly housing related data.
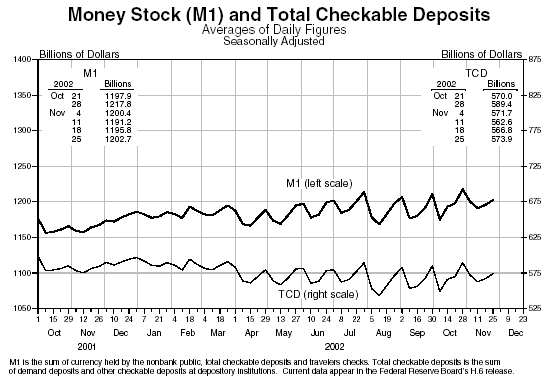
In the meantime, where's the trickle down? While broad money growth was exploding upward as a result of the mortgage bubble, the portion of the money supply most directly influenced by the Fed hasn't budged in 6 months, as checking deposits stay in a slow steady decline.
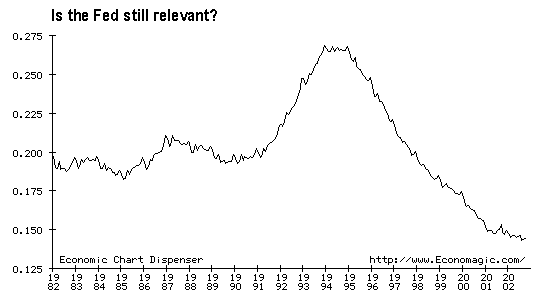
Which brings to mind the question, is the Fed even relevant any more? This chart shows the ratio of M1 to M3 since 1982. M1 is bank money and cash. M3 is the closest measure we have to counting the total money supply. For nearly 10 years M1 was about 20% of M3. Then during the real estate crash of the early 90s M1 grew to 27.5% of M3 as mortgage creation was depressed. That ended when the bubble began in 1996. M1 is now around 14% of M3. By contrast, back in 1959, M1 was nearly 50% of the broad money supply. Al doesn't matter any more. He is an emperor without a throne. The only guys who matter now are Pimco's Bill Gross and Fannie Mae's Frank Raines. Last we heard Gross said he's not buying. And that's bad news for Frank and the markets.
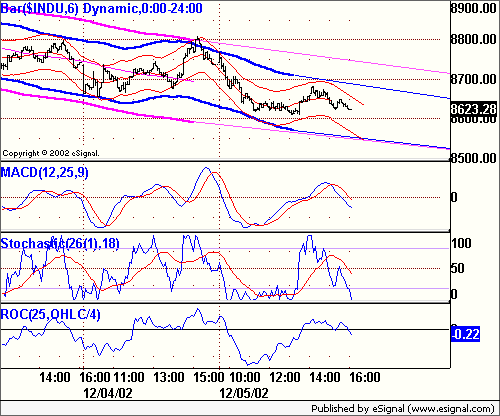
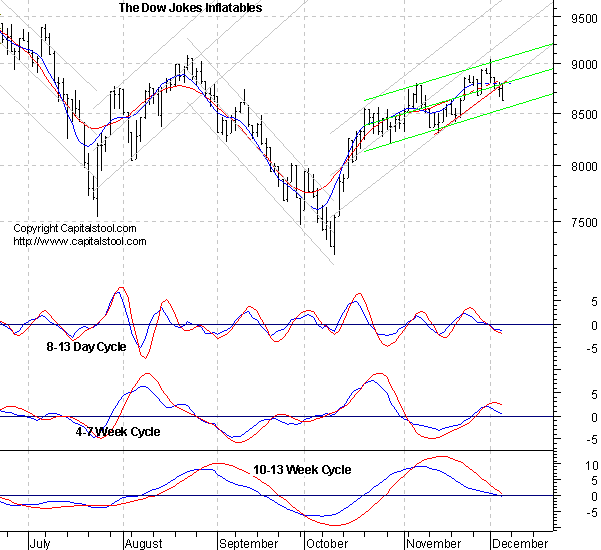
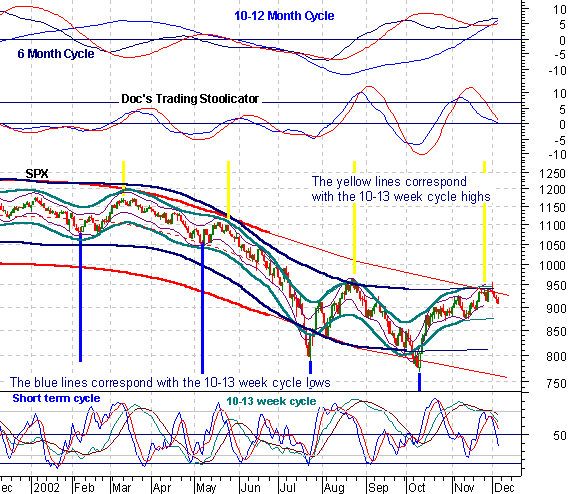
The 13 day cycle is nearing a
low on the Dow. The cmap is 8550. Its too early for cmaps on longer
cycles, but initially, the lower green linear regression channel looks
like a logical temporary stopping point. The all important 10-13 week
cycle lows are at least two weeks, and as much as five weeks away. Still
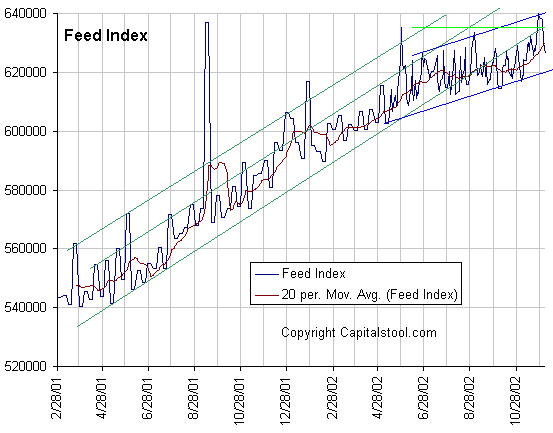
no downside projection for it. The Feed did $2 billion in matched sale purchases, which was a net drain. The usual Thursday 28 day repo was rolled over in the amount of $5 billion. The MSP's expire Friday. There are no repo expirations. Once again, Al surprises us with his manic depressive schizophrenia. Up down, up down. I suspect that Friday's Feed will be tipped by the unemployment claims. If they are too high, Al will Feed. If they are trending lower, he'll probably stand pat, or maybe drain a little. He is clearly focused on the bond market, and wants to manipulate it to keep the 10 year as close to 4% as possible. Otherwise, game over. Two
trends are evident on the Feed Index, which is the total Fed holdings of
loans and securities. One is the 10% growth trend beginning in May of
2001. Feed growth has recently been below the lower boundary of that
trend. The blue channel going back to last December suggests that Al may
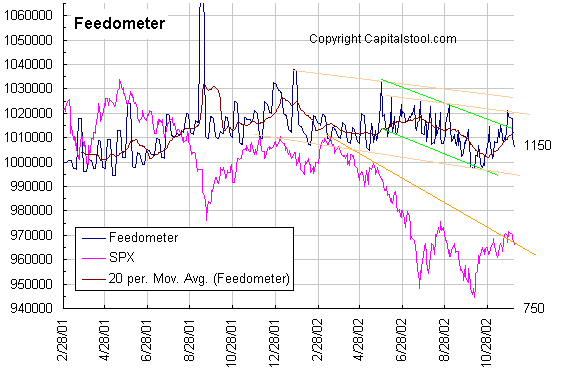
now be targeting an 8% growth rate. The Feedometer having broken its 4 week moving average, is on the verge of turning it lower. After all the threats by the Fed about not allowing deflation, they sure didn't keep the pedal to the metal for long. It looks to Doc like they are waffling, and really don't have a clue about what to do. The
Feedometer theoretically
measures excess Feed available for bond or stock market jamming. A big bond
rally sent yields sharply lower. The 10-13 week cycle is now heading down.
Some players will sell stocks to buy bonds. That relationship will not
decouple until yields are significantly higher. This downturn could last
into January. It is possible that the secular trend remains down. We won't
know until we see the bottom of this pullback and the next upturn. The
inflation-deflation argument is not settled. All of Doc's
daily cycle charts are powered by METASTOCK Portfolio Sphincters Index (SPX) and Sentiment Sentiment and Momentum Indicators
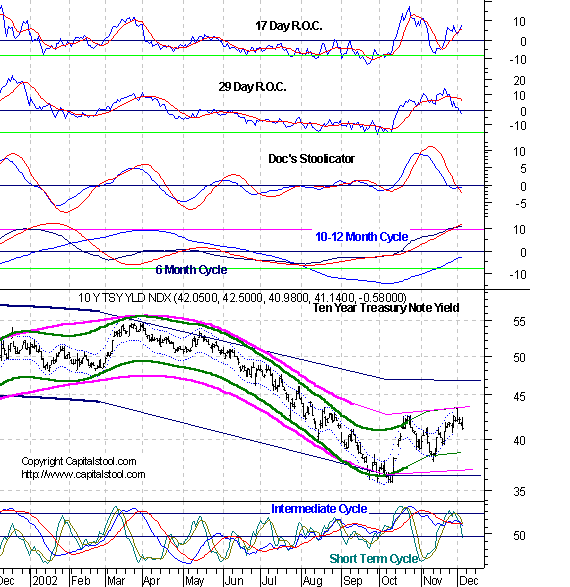
The 17 day rate of change is a proxy for the
6-7 week cycle. The 29 day rate of change is a proxy for the 10-13 week
cycle. The dark blue overlaid line is the 10-13 week cycle
oscillator, while the red line is the 6-7 week cycle oscillator. The VIX
is a measure of implied options volatility reflecting relative fear or
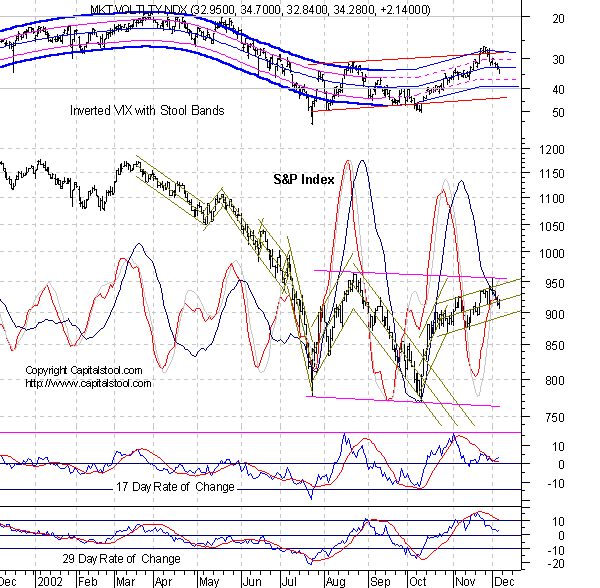
complacency. It is plotted below on an inverse scale to better show the
relationship to the price chart. The "Stool Bands may reflect either
6 month or 10-12 month cycles. Short Term Cycles The 8 and 13 day cycles have two more down days, at most. They could bottom Friday. The tentative cmap is 895-900. The 4-7 week cycle is turning down, but probably won't have a sharp break for at least a few days. Still no sell signal from the 17 day ROC, and that little uptick could signal some near term trouble. We won't see a sustained move until the indicators all get in gear. After a little more selling, we could see a bounce next week. 10-13 Week Cycle The 10-13 week cycle oscillator is heading down. The 29 day ROC is still suspended just above its November low point. Another downtick in that indicator would signal downside acceleration. It looks like there will be an intervening attempt to rally. The 10-13 week cycle low is due between December 19 and January 9. It will be several days before it's possible to derive a reliable downside cmap. VIX On the inverted scale Stool Band chart, VIX is heading for the lower channel lines, but the channel is probably also bending down. If the indicator gets close to 40, look for a bounce in the market. Last week's blowout above the blue channel line was an indication of an overcooked, overconfident market, and a probable intermediate cycle top. But if the indicator corrects too quickly the market could rally. Cycle Chart The Cycle Conditions tables include cycle phase and a wild guess as to number of periods to the next turn, in days for the shortest cycles, weeks (W) or months (M) for the longer ones. This is a fluid exercise, in other words, the projections are likely to be wrong, but they force us to be vigilant for key turning points, and frequently work well enough to prevent costly misreadings. SPX Cycle Conditions as of 12/5/02
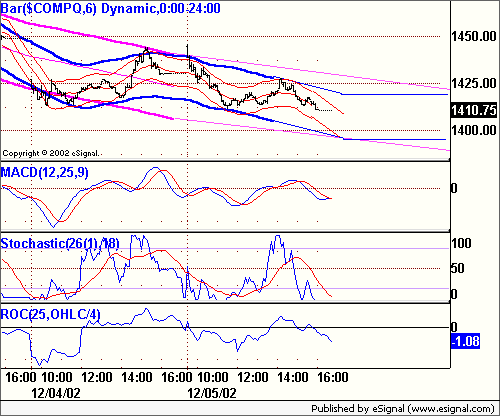
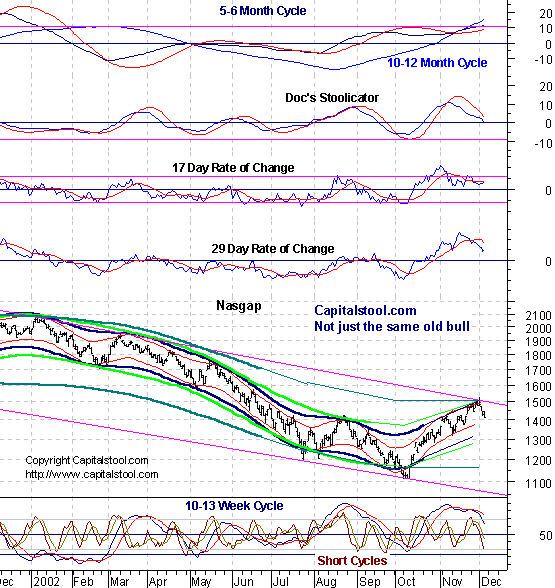
PTT - Periods Till Turn Nasgap Charts Cycle Chart Short Term Cycles Short cycles probably have only another day or two of downside. The tentative cmap is 1390. The 4-7 week cycle is beginning to head lower. We're just waiting for the 17 day ROC to break down as a signal that the floodgates have opened. But first we'll get a bounce off a short cycle low in the next day or two. 10-13 Week Cycle The 10-13 week cycle indicator is dropping and the 29 day ROC looks like it is confirming. The 10-13 week cycle low is due from December 19 through January 9. It will take at least several days before we have a downside cmap for this cycle. Nasdaq Cycle Conditions as of 12/5/02
PTT
- Periods Till Turn Long Bong Hit - See top of page. AM Edition Features (Previous) These features are in morning edition, published between 7:30-8 AM ET US, or the Saturday Weak End Edition, published, uh, let's see, Saturday! Golden Stool Doc's recent
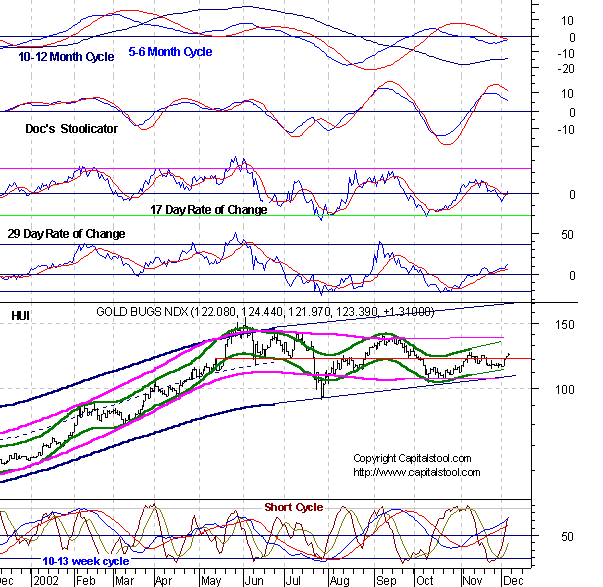
view that the gold stocks would remain rangebound is about to be tested.
The upside cmaps on shorter cycles remain at 124. The 10-13 week cycle
cmap remains at 125. The indicators are still mixed, but there are hints
that positive mo is building. If 125 does not hold, the next level is 140.
Doc still firmly believes that gold stocks are in a bull market and that
the consolidation of recent months represents accumulation. He expects the
breakout from the trading range to come later rather than sooner because
of the positioning of longer term cycles, but, he wouldn't want to miss
the move, whenever it comes. Unless the big picture changes, he's a
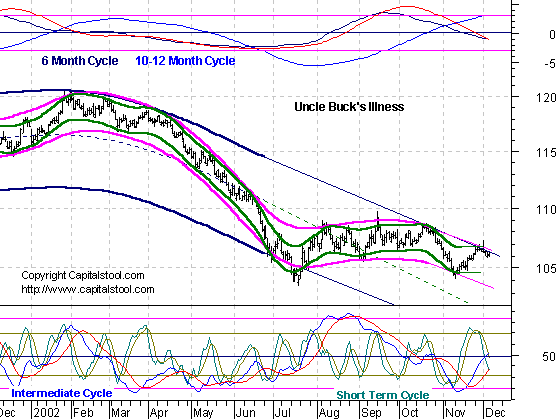
holder. Uncle Buck's Illness Uncle Buck
keeps trying to get out of bed, and keeps hitting his head on the dormer
ceiling. The question is, which is harder, his head or the ceiling. Doc
thinks the big trend is going to win. If the 10-12 month cycle oscillator
flattens out at this level, it would confirm that Buck is in a longer term
down phase, which could last for months. Suctor Watch and Stoolwethers- Now posted on separate page. Updated each morning between 8 AM and 9:30 AM NY time. See you in Intraday Stool. Dr. Stepan N. Stool Share your thoughts on the Stool Pigeons Wire.
Renewals Welcome, and thank you for subscribing to the Anals of Stock Proctology. Your trial subscription will run for 90 days. At the end of that period your subscription will renew automatically, unless you cancel. If you wish to cancel your subscription use the button below. If you want to renew your subscription do nothing. Your subscription will renew and your credit card or Paypal bank account will be charged. If you want to renew, be sure your credit card information in your Paypal account is current. Paypal will not renew your subscription if the card has expired! Again, thanks for subscribing!
Explanation of Intraday Commentary-Build charts at http://www.livecharts.com. For custom time bars insert a comma after symbol and number of minutes, e.g. compx,90. This will give you a bar chart of the Nas with 90 minutes per bar. The one day cycle is usually most clear with 8 minute bars and 26/18 stochastics. It varies from day to day. Sometimes 6 minutes works best. Experiment to find the best fit for your trading style, and the market's dominant frequency at the time. The goal here is primarily to monitor the condition of the 8 and 13 day cycles. I typically use 90 minute bars with 26/18 stochastics for the 13 day cycle proxy on the indices during regular trading hours. Other cycles use 26/18 stochastics with the following: 8 days- 60 minute bars On the 24 hour futures charts, use a time per bar approximately 3 to 4 times the above number of minutes, to represent the cycles listed above. ABBREVIATIONS: cma: centered moving average
|

![[Most Recent HUI from www.kitco.com]](http://www.weblinks247.com/indexes/idx24_hui_en_2.gif)
![[Most Recent XAU from www.kitco.com]](http://www.weblinks247.com/indexes/idx24_sp500_en_2.gif)
![[Most Recent Quotes from www.kitco.com]](http://kitconet.com/charts/metals/gold/t24_au_en_usoz_2.gif)