|
Archives 12/30/01, 1/1/02, 1/2/02, 1/3/02, 1/4/02, 1/7/02, 1/8/02, 1/09/02, 1/10/02, 1/11/02, 1/14/02, 1/15/02, 1/16/02, 1/17/02, 1/18/02, 1/22/02, 1/23/02, 1/24/02, 1/25/02, 1/28/02, 1/29/02, 1/30/02, 1/31/02, 2/1/02, 2/4/02, 2/5/02, 2/06/02, 2/7/02, 2/9/02, 2/11/02, 2/12/02, 2/13/02, 2/14/02, 2/16/02, 2/19/02, 2/20/02, 2/21/02, 2/23/02, 2/25/02, 2/26/02, 2/27/02, 2/28/02, 3/1/02, 3/04/02, 3/05/02, 3/06/02, 3/7/02, 3/10/02,3/11/02, 3/12/02, 3/13/02, 3/14/02, 3/15/02, 3/18/02, 3/19/02, 3/20/02, 3/21/02, 3/22/02, 3/25/02, 3/26/02, 3/28/02, 3/30/02 4/1/02, 4/2/02, 4/3/02, 4/4/02, 4/6/02, 4/8/02, 4/9/02, 4/10/02, 4/11/02, 4/13/02, 4/15/02, 4/16/02, 4/17/02, 4/18/02, 4/20/02, 4/22/02, 4/23/02,4/24/02,4/25/02, 4/26/02, 4/27/02, 4/29/02, 4/30/02 5/01/02, 5/2/02, 5/4/02, 5/6/02, 5/07/02, 5/8/02, 5/09/02, 5/10/02, 5/13/02, 5/14/02, 5/15/02, 5/16/02, 5/17/02, 5/20/02, 5/21/02, 5/22/02, 5/23/02, 5/24/02, 5/28/02, 5/29/02, 5/30/02 6/01/02, 6/3/02, 6/4/02, 6/5/02, 6/6/02, 6/7/02, 6/10/02, 6/11/02, 6/12/02, 6/13/02, 6/14/02, 6/17/02, 6/18/02, 6/19/02, 6/20/02, 6/22/02, 6/24/02, 6/25/02, 6/26/02, 6/27/02, 6/30/02 7/1/02, 7/4/02, 7/5/02, 7/11/02, 7/14/02, 7/15/02, 7/16/02, 7/17/02, 7/18/02, 7/19/02, 7/22/02, 7/23/02, 7/24/02, 7/25/02, 7/27/02, 7/29/02, 7/30/02 8/1/02, 8/3/02, 8/5/02, 8/6/02, 8/7/02, 8/8/02, 8/10/02, 8/12/02, 8/13/02, 8/14/02, 8/15/02, 8/16/02, 8/19/02, 8/20/02, 8/21/02, 8/22/02, 8/23/02, 8/26/02, 8/27/02, 8/28/02, 8/29/02, 8/30/02 9/3/02, 9/4/02, 9/5/02. 9/6/02, 9/9/02, 9/10/02, 9/11/02, 9/12/02, 9/13/02, 9/16/02, 9/17/02, 9/18/02, 9/19/02, 9/20/02, 9/23/02, 9/24/02, 9/25/02, 9/26/02, 9/27/02, 9/30/02 10/1/02, 10/2/02, 10/3/02, 10/4/02, 10/7/02, 10/8/02
|
The Anals of Stock ProctologyPublished weeknights by
8:30PM Happy Acres, Florida Time The American Academy of Stock Proctology and Is your subscription up for renewal? If you want to renew, do nothing, unless your credit card has expired. Please be sure your credit card info is current. If your credit card has expired, you must enter the new expiration date in your Paypal account in order for your subscription to be processed. If you subscribed via Paypal, your subscription will be renewed for one year on the 90 day anniversary of your sign-up and your credit card will be charged. If you want to cancel, use the button at the bottom of the page. This applies only if you subscribed through Paypal. Mailed-in subscriptions are for 1 year. If you subscribed by prior contribution, I will send you a notice before your subscription expires. If you have any questions, see the subscription page and FAQ's. If you can't find the answer, email me. On The Road (10/9/02) Doc will be traveling until October 23, God willing. The Anals will be published in a scaled down format, whenever possible. Pre-market and Mid-day updates will be published irregularly. There will be no mid-day update Thursday or Friday. I will try to do pre-market updates both days. Publication notices will be posted on the message board during this period. Since we are nearing a short term turning point, I'll do my best to report to you regularly on how the charts look. The Feed did nothing again today. There were no repos and no rollovers as Printsalot continues to do the Tighten Up. Who knows, maybe they burned out the presses, and the new ones coming from China are tied up in port. Tomorrow is the usual Thursday rollover of $3 billion in 28 day repos. Last week, for the first time in recent memory, the 28 day repos were not refunded. Wonder what Al has up his sleeve for tomorrow. Remember, No Feed, no jam. The Feed Index remains below the 8% growth channel, in the lower half of the no-growth channel. If they didn't Feed today, you have to wonder what the hell they are waiting for. And why? Three trends are evident on
the Feed Index. One is the 10% growth trend beginning in May of 2001. Feed
growth has recently been at or below the lower boundary of that trend. The
blue channel going back to last December suggests that Al may now be
targeting an 8% growth rate. Then there's the golden box which says he's stopped growing Feed altogether over the last three months. The Feedometer continues to sink. It's almost as if Sir Printsalot wants to precipitate a crash. We can only speculate as to the reasoning behind this posture of inaction. Is a policy debate raging? Are they frozen into inaction? Or is there a "good reason" that they are not intervening to halt the meltdown. Perhaps they really are saving the big one for the day the market ultimately does crash. The
Feedometer theoretically
measures excess Feed available for bond or stock market jamming. 10 Year Bond yields dipped to
3.58. Yields are in mid channel, retesting the lows. (Sound familiar). The 10-12 month cycle cmap is
3.65 and the 6 month cmap is 3.50,
also a long term resistance level. The intermediate cycle oscillator has
turned up, but it's too early to jump to conclusions. The trend is still
intact and we need to see confirmation of a turn from other indicators.
Another spike lower can't be ruled out yet. The expected upturn in
bond yields should correspond with the next 10-13 week cycle up phase in
stocks. Money goes round in circles. Financial and Economic Indicators October 3 Suctor Watch and Stoolwethers- Now posted on separate page. Updated each morning between 8 AM and 9:30 AM NY time.
All of Doc's
cycle charts
are powered by METASTOCK Portfolio Sphincters Index (SPX) and Sentiment Sentiment and Momentum
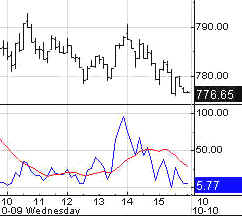
Indicators VIX The VIX rose to 49.48, still trending near the center of the inverted scale 6 month cycle Stool Band. The trend is likely to continue until the lower Stool Band is penetrated. A 50 reading is no longer extreme, and is consistent with the trend. Short Term Cycles Here we are, finally touching the lower channel boundary. Normally Doc would expect a bounce at this point. However, at late stages of a persistent downtrend it is not unusual to see acceleration on the last spike down. If it happens, it is likely to lead to a sharp reversal. The lower channel boundary will be around 770 on Thursday. The center line is approximately 800. A close above that would confirm the turn. The 6-7 week cycle phase is now clearly down, with only about a week to go and a cmap of 740. The 4 week cycle should run concurrent with that. 10-13 Week Cycle Well, Glory Be! The 10-13 week cycle indicator (dark blue line, above) at long last stopped dropping. The indicator has a good record of upturns concurrent with lows. But it could be a false start, or it may need to back and fill for a few days. The 10-13 week low is due at any time within 10 days. Given the overall weakness and lack of a true panic washout, the most likely shape of the 10-13 week up phase is sideways, with a series of short sharp rallies and declines.That's speculation at this point. We still need to see confirmation of a low. This is still an open case and the cmaps are still out there at 700 to 760. Cycle Chart
Fiber Nacho Dump- Support levels and downside targets.
Fiber Nacho Reflux- Resistance levels and upside targets Long Term
(10/6/02) The six month cycle oscillator has not yet confirmed a downturn. This cycle is topping out a sideways up phase as it moves across the 2 year cycle channel. The weakness of the up phase and the amount of time left in the cycle suggest devastating losses through January. However, the descending lower trendline should be able to generate a 10-13 week cycle upturn within the next few weeks. Swing traders will want to cover at that point and look for re-entry after a rally. The 4 year cycle can be anywhere from 3 to 5 years in duration. The 1920's bubble wave lasted more than 6 years from initial launch to final bottom, with an interim low after the crash in November of 1929, a little more than 3 years after the onset of the bubble. The September 2001 low was at a similar point relative to the 1998 low. Think of the bubble wave like a tsunami. It is far bigger, longer lasting and far more destructive than the typical 4 year cycle. The 4 year cycle is barely an eddy in the tsunami wave. Given the 4 year cycle low in October 1998, certainly we need to be on the lookout for conditions indicating a four year cycle low. We also need to be aware that we may have already seen the low September 2001. (Hey the bulls were right! For 3 months.) Evidence of a 12 year cycle suggests that the final bear market low may not be seen until 2007. The Cycle Conditions tables include cycle phase and a wild guess as to number of periods to the next turn, in days for the shortest cycles, weeks (W) or months (M) for the longer ones. This is a fluid exercise, in other words, the projections are likely to be wrong, but they force us to be vigilant for key turning points, and frequently work well enough to prevent costly misreadings. SPX Cycle Conditions as of 10/9/02
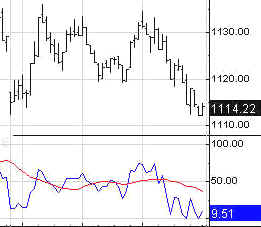
PTT - Periods Till Turn Nasgap Charts Cycle Chart Short Term Cycles The Nasty did the usual bump and grind, closing near cycle channel support levels. Short cycle cmaps remain way below current levels. Further downside acceleration is definitely possible. The 4 week cycle is a non-issue given the strength of the 10-13 week cycle down phase. The 6-7 week cycle is heading down with a cmap at 1020-1040, due next week. 10-13 Week Cycle The 10-13 week cycle oscillator and 29 day rate of change are still in downtrends. The cmap is now 1010 to 1030, due within 10 days. If it starts to waterfall toward that level, the cycle low would be imminent. Tread carefully.
Fiber Nacho Dump- Support levels and downside targets.
Fiber Nacho Reflux- Resistance levels and upside targets Long Term (10/6/02) Confirmation of the 6 month
cycle sell signal will come when the smoother line (red), which is a time
series of the indicator line (navy), stops rising. Late signals are
usually a sign of a much bigger move to come. They happen when one phase
of a cycle is much shorter than typical, under the influence of
larger downtrending waves. The down phase of this cycle should last into
next year and carry well below 1000. The 2 year cycle trough is not due
until mid year, although the price low could come several months early or
late. This is a monthly chart with long term CMAPS. Measured on a percentage basis the projected low for the 4 year cycle is 1000. On a whole number basis, it's -500. That's negative 500. ( That's where the seller says, hey, I'll pay you 500 bucks to just tow it away.) The 8 year cycle projection is purely hypothetical and probably overly optimistic. Doc expects most companies on the Nasdaq to disappear. The ones that are left, probably only Mircroprice, and Farmer in the Dell, will have to go over to the NYSE.
Nasdaq Cycle Conditions as of 10/9/02
PTT
- Periods Till Turn AM Edition Features (Previous) These features are in morning edition, published around 9 AM ET US, or the Saturday Weak End Edition, published, uh, let's see, Saturday! Long Bong Hit - See top of page. Golden Stool- Published daily by 7:30 AM NY time HUI is
approaching the original correction target of 106, but cmaps have moved
lower. Gold stocks are, after all, stocks, and they will trade with the
stock market. When the stock market stages a recovery, the baby HUI's will
outperform. The pain Doc warned about is here, and it ain't over yet. A
couple of the shorter cycle cmaps are pointing to the 106-108 area, but
the 13 week target is down around 103. As you can see on the chart, 105 is
an area of major support, but be aware that prices often overextend at
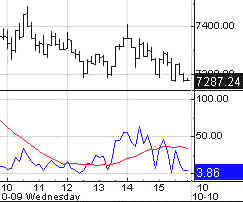
significant lows. Uncle Buck's Illness- Published daily by 7:30 AM NY time
Buck took the pipe yesterday. Then he tanked again overnight, but made a
"V" bottom and recovered to 107. We need to watch this
intermediate up phase. If the 10-12 month cycle channel (red) begins to
roll over, the stock market decline will get worse. On the other hand if
Buck can base and stage a minor recovery from the 106.50-107 area, stocks
should rally. Suctor Watch and Stoolwethers- Now posted on separate page. Updated each morning between 8 AM and 9:30 AM NY time. See you in Intraday Stool. Dr. Stepan N. Stool Share your thoughts on the Stool Pigeons Wire.
Renewals Welcome, and thank you for subscribing to the Anals of Stock Proctology. Your trial subscription will run for 90 days. At the end of that period your subscription will renew automatically, unless you cancel. If you wish to cancel your subscription use the button below. If you want to renew your subscription do nothing. Your subscription will renew and your credit card or Paypal bank account will be charged. If you want to renew, be sure your credit card information in your Paypal account is current. Paypal will not renew your subscription if the card has expired! Again, thanks for subscribing!
Explanation of Intraday Commentary-Build charts at http://www.livecharts.com. For custom time bars insert a comma after symbol and number of minutes, e.g. compx,90. This will give you a bar chart of the Nas with 90 minutes per bar. The one day cycle is usually most clear with 8 minute bars and 26/18 stochastics. It varies from day to day. Sometimes 6 minutes works best. Experiment to find the best fit for your trading style, and the market's dominant frequency at the time. The goal here is primarily to monitor the condition of the 8 and 13 day cycles. I typically use 90 minute bars with 26/18 stochastics for the 13 day cycle proxy on the indices during regular trading hours. Other cycles use 26/18 stochastics with the following: 8 days- 60 minute bars On the 24 hour futures charts, use a time per bar approximately 3 to 4 times the above number of minutes, to represent the cycles listed above. ABBREVIATIONS: cma: centered moving average
|
|||||||||||||||||||||||||||||||||||||||||||||

![[Most Recent HUI from www.kitco.com]](http://www.weblinks247.com/indexes/idx24_hui_en_2.gif)
![[Most Recent XAU from www.kitco.com]](http://www.weblinks247.com/indexes/idx24_sp500_en_2.gif)
![[Most Recent Quotes from www.kitco.com]](http://kitconet.com/charts/metals/gold/t24_au_en_usoz_2.gif)