|
Archives 12/30/01, 1/1/02, 1/2/02, 1/3/02, 1/4/02, 1/7/02, 1/8/02, 1/09/02, 1/10/02, 1/11/02, 1/14/02, 1/15/02, 1/16/02, 1/17/02, 1/18/02, 1/22/02, 1/23/02, 1/24/02, 1/25/02, 1/28/02, 1/29/02, 1/30/02, 1/31/02, 2/1/02, 2/4/02, 2/5/02, 2/06/02, 2/7/02, 2/9/02, 2/11/02, 2/12/02, 2/13/02, 2/14/02, 2/16/02, 2/19/02, 2/20/02, 2/21/02, 2/23/02, 2/25/02, 2/26/02, 2/27/02, 2/28/02, 3/1/02, 3/04/02, 3/05/02, 3/06/02, 3/7/02, 3/10/02,3/11/02, 3/12/02, 3/13/02, 3/14/02, 3/15/02, 3/18/02, 3/19/02, 3/20/02, 3/21/02, 3/22/02, 3/25/02, 3/26/02, 3/28/02, 3/30/02 4/1/02, 4/2/02, 4/3/02, 4/4/02, 4/6/02, 4/8/02, 4/9/02, 4/10/02, 4/11/02, 4/13/02, 4/15/02, 4/16/02, 4/17/02, 4/18/02, 4/20/02, 4/22/02, 4/23/02,4/24/02,4/25/02, 4/26/02, 4/27/02, 4/29/02, 4/30/02 5/01/02, 5/2/02, 5/4/02, 5/6/02, 5/07/02, 5/8/02, 5/09/02, 5/10/02, 5/13/02, 5/14/02, 5/15/02, 5/16/02, 5/17/02, 5/20/02, 5/21/02, 5/22/02, 5/23/02, 5/24/02, 5/28/02, 5/29/02, 5/30/02 6/01/02, 6/3/02, 6/4/02, 6/5/02, 6/6/02, 6/7/02, 6/10/02, 6/11/02, 6/12/02, 6/13/02, 6/14/02, 6/17/02, 6/18/02, 6/19/02, 6/20/02, 6/22/02, 6/24/02, 6/25/02, 6/26/02, 6/27/02, 6/30/02 7/1/02, 7/4/02, 7/5/02, 7/11/02, 7/14/02, 7/15/02, 7/16/02, 7/17/02, 7/18/02, 7/19/02, 7/22/02, 7/23/02, 7/24/02, 7/25/02, 7/27/02, 7/29/02, 7/30/02 8/1/02, 8/3/02, 8/5/02, 8/6/02, 8/7/02, 8/8/02, 8/10/02, 8/12/02, 8/13/02, 8/14/02, 8/15/02, 8/16/02, 8/19/02, 8/20/02, 8/21/02, 8/22/02, 8/23/02, 8/26/02, 8/27/02, 8/28/02, 8/29/02, 8/30/02 9/3/02, 9/4/02, 9/5/02. 9/6/02, 9/9/02, 9/10/02, 9/11/02, 9/12/02, 9/13/02, 9/16/02, 9/17/02, 9/18/02, 9/19/02, 9/20/02, 9/23/02, 9/24/02, 9/25/02, 9/26/02, 9/27/02, 9/30/02 10/1/02, 10/2/02, 10/3/02, 10/4/02, 10/7/02, 10/8/02, 10/9/02, 10/10/02, 10/11/02, 10/14/02, 10/15/02, 10/16/02, 10/17/02, 10/18/02, 10/21/02, 10/22/02, 10/23/02, 10/24/02, 10/25/02, 10/28/02, 10/29/02, 10/30/02, 10/31/02 11/1/02, 11/4/02, 11/5/02, 11/6/02, 11/7/02
|
The Anals of Stock ProctologyPublished weeknights by
8:30PM Happy Acres, Florida Time The American
Academy of Stock Proctology and Is your subscription up for renewal? If you want to renew, do nothing, unless your credit card has expired. Please be sure your credit card info is current. If your credit card has expired, you must enter the new expiration date in your Paypal account in order for your subscription to be processed. If you subscribed via Paypal, your subscription will be renewed for one year on the 90 day anniversary of your sign-up and your credit card will be charged. If you want to cancel, use the button at the bottom of the page. This applies only if you subscribed through Paypal. Mailed-in subscriptions are for 1 year. If you subscribed by prior contribution, I will send you a notice before your subscription expires. If you have any questions, see the subscription page and FAQ's. If you can't find the answer, email me. Doc does not make trading recommendations. This update reports time cycle estimates and centered moving average projections based on the Hurst cycle analysis method. This publication is for entertainment and educational purposes only. Doc assumes no responsibility for the accuracy or inaccuracy of the estimates and projections presented. The market may or may not meet the projections. Stoolies should thoroughly familiarize themselves with the methodology before trading based on this method. Those who do not have the time or inclination to develop a trading strategy based on testing and research should not trade. Trade at your own risk. Yadda yadda. How's your motha? Mid Day Update 11/11/02 1 PM Look for a quiet afternoon with a narrow trading range. The 1 day cycle should head into a sideways up phase for most of the afternoon, with a high toward the end of the day. If it comes early enough, we may see a little dip into the close. There's still an 8 day cmap due in a couple of days that looks like 866+/-. This is the way it looks at this point. As always, vee zhall zee, hmm? 5 Day Cycle______ 2-3 Day Cycle_______ 9-10 Hr Cycle_______ 5 Hr- 1 Day Cycle
Pre Market Outlook 11/11/02 With very little change in the fucutures, and the bond market closed, it should be a quiet morning. It is scam week, however, so bizarre things may happen. For now, Doc will stick with the outlook posted below. A Stool Pictorial (11/8/02) In the words of the immortal Native American chieftain, Manhattan, "We're the Facawi." The answer, as Doc sees it, is below.
We'll find out soon enough if these are worth the paper they're printed on. On the SPX in particular, if they can string out the top over more than a couple of days, the longer term downtrend begins to flatten out. That would mean the chances of a substantial break below the recent lows any time in the next 6-9 months becomes unlikely. On the other hand, if the market drops quickly from current levels, the probability of another major bear market downleg in the immediate future is substantially increased. So far Doc believes that the market is off to an auspicious start in that direction, but the reversal to the downside must be completed immediately for that scenario to remain valid. All of Doc's
daily cycle charts are powered by METASTOCK The Feed added $6.25 billion in 5 day repos for the semi holiday weekend. That was a near wash, as $6.5 billion in repo paper expired. This is not the massive Feeding that would have been indicated by the half point rate cut. In that context the cut looks like an empty gesture so far. What they do next week will tell us if the cut is part of a more aggressive Feeding policy. If we are in for a massive 1998 style reliquefaction the pumping should start immediately. Total Feed has been flat for more than 5 months. So far they are not acting like there's any crisis. Three
trends are evident on the Feed Index, which is the total Fed holdings of
loans and securities. One is the 10% growth trend beginning in May of
2001. Feed growth has recently been at or below the lower boundary of that
trend. The blue channel going back to last December suggests that Al may
now be targeting an 8% growth rate. Then there's the golden box which says
he's stopped growing Feed altogether over the last five months. The Feedometer is likewise still within recent downtrend channels. The 4 week moving average has turned up, but not enough to juice the stock market yet. Most of the added Feed is going to be needed to help absorb the $40 billion in new Treasury notes. The bill must be paid on November 15. The cash will go into the Treasury's account at the Fed, representing a short term drain on the financial system, at least until the funds are spent or deposited back into commercial banks. Digesting large offerings involves more than just the time leading up to the auction. The giant sucking sound you hear after the auction is the Treasury temporarily sucking all that cash out of the system. The
Feedometer theoretically
measures excess Feed available for bond or stock market jamming. Bond yields were down a hair, after being down large at the open. This is a short cycle low, and they're due to bounce. The 10-13 week cycle is going into a down phase. A retest of the lows may be in the cards. That should complete the long term bottom. Of course, maybe this is Japan II, and they go to zero. Keep in mind that stock prices are still moving in near lockstep. A 10-13 week cycle down phase in bond yields, regardless of whether its direction is flat or down, will coincide with a down phase in stock prices.
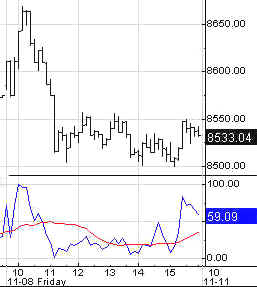
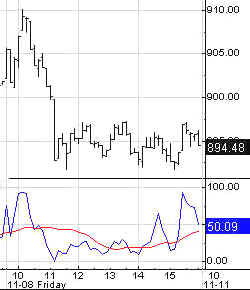
Intraday Outlook - The 1 day cycle up phase should end in the first hour. The 3, 5, and 8 day cycles should have had nested concurrent lows on Friday. Normally that would generate a good pop, but it didn't happen. The 8 and 13 day cycle hourly indicators suggest a cmap of 875-880, and maybe lower within a few days. Doc projects Monday morning to look something like the cycle map below. Stay tuned for the Pre-Market update around 9:15 AM. 5 Day Cycle______ 2-3 Day Cycle_______ 9-10 Hr Cycle_______ 5 Hr- 1 Day Cycle
All of Doc's
cycle charts below are powered by METASTOCK Portfolio Sphincters Index (SPX) and Sentiment Sentiment and Momentum Indicators
The 17 day rate of change is a proxy for the
6-7 week cycle. the 29 day rate of change is a proxy for the 10-13 week
cycle. The dark blue overlaid line is the 10-13 week cycle
oscillator, while the red line is the 6-7 week cycle oscillator. The VIX
is a measure of implied options volatility reflecting relative fear or
complacency. It is plotted below on an inverse scale to better show the
relationship to the price chart. The "Stool Bands may reflect either
6 month or 10-12 month cycles. Short Term Cycles The 13 day cycle is headed down. The up phase in the 8 day cycle hasn't materialized. Assuming it doesn't, completion of the 13 day cycle down phase could take up to 4 days. The tentative preliminary cmap is 876. The 6-7 week cycle also turned down. Now the question becomes one of whether the down phase goes sideways or down. With the 10-13 week cycle up phase apparently finished, the 6-7 week cycle could slope down for 8-13 days. 10-13 Week Cycle Indicators for this cycle are topping out. The top phase could last from one to ten days. The quicker it dies, the better for bears. If it hangs on up here for a few days, we'll still see a pretty good selloff in a couple of weeks, but it may not break the recent lows by much. Once the cycle oscillators and the 29 day rate of change roll over, price should begin to drop consistently for a couple of weeks, leading to a low in late December or early January. VIX The VIX Stool Bands are trending up on the inverted scale chart and the index has moved back within the upper sell signal band. VIX didn't quite make it to the blue projection line, but moved in that direction Friday, in spite of the market's weakness. This suggests building complacency, which is typical of tops. Cycle Chart Long Term (11/8/02)
Virtually everyone was expecting a 4 year low around now. But bubbles are peculiar. The tsunami wave spawns atypical wave responses. The November 1929 low was at a 3 year anniversary. The next important low was in July 1932. At other times we have seen cycles run 4.5 years, or 3 years. Focusing on a 4 year low is a bad idea, especially when the whole world expects it. Cycles vary in duration, and the long term indicators at the top of the chart do not suggest that the this was the bear market low. The most obvious long term wave this time has been approximately two years in duration, and the last low was in mid 2001. So we should look for the next one around mid-year next year, give or take 3 months either way. That would also correspond with the 10-12 month cycle which bottomed in July. It's now in the midst of a sideways up phase which is probably ending. Significantly lower lows look like they will be delayed until well into next year. Some time around the second quarter or a few months either side, we should see a very significant low which will lead to a big rally, one that may be classified as a cyclical bull market within a secular bear market. Long term linear regression
analysis indicates the market may actually be weakening, as prices are
unable to get past the central regression projections drawn between
earlier lows highs. The Cycle Conditions tables include cycle phase and a wild guess as to number of periods to the next turn, in days for the shortest cycles, weeks (W) or months (M) for the longer ones. This is a fluid exercise, in other words, the projections are likely to be wrong, but they force us to be vigilant for key turning points, and frequently work well enough to prevent costly misreadings. SPX Cycle Conditions as of 11/8/02
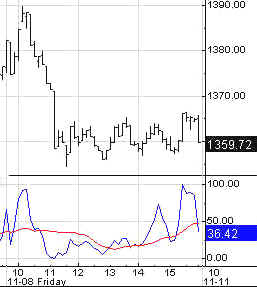
PTT - Periods Till Turn Nasgap Charts Cycle Chart Short Term Cycles The 8 - 13 day cycles turned down. The down phase may last up to 4 days. It's too early to project price targets. The 6-7 week cycle also turned down. How far and how fast is an open question at the moment. We need to see a few days of data to get an idea of where the down phase may head. 10-13 Week Cycle The 10-13 week cycle indicator is topping out but hasn't flashed a sell signal yet. The cmap adjusted down to 1420. A signal concurrent with this WHOPsaw through the upper long term cycle channel and back could lead to a doozy of a down phase. The best moves usually follow WHOPsaws. The WHOPsaw is a tool of the stage managers to suck everybody in, and exhaust potential demand. WHOPsaw days are the days market makers get loaded up with shorts. Long Term (11/8/02)
The "4 Year Cycle" looks like it bottomed last year, lasting only 3 years as a result of the influence of the tsunami bubble wave. The Nasty may actually have been in a 3-4 year cycle up phase since then, with the current move being the rigor mortis rally before the Nas heads for its ultimate price objective of negative 400. Note that as the 10-12 month cycle oscillator has moved up, the market has moved sideways in a range of 1400 to 1100. The top could form in that cycle at any time over the next month or two. By 2007, when a 12 year low is due, the Nas will be the National Toilet Paper Exchange. There is massive resistance above current levels. The going will get a lot tougher from here. Nasdaq Cycle Conditions as of 11/8/02
PTT
- Periods Till Turn Long Bong Hit - See top of page. AM Edition Features (Previous) These features are in morning edition, published between 7:30-8 AM ET US, or the Saturday Weak End Edition, published, uh, let's see, Saturday! Golden Stool Short cycles
are due for a pause or slowing, but the 10-13 week cycle up phase is
young. Importantly, the 10-12 month cycle oscillator is bottoming. The six
month cycle will be in a sideways down phase for a couple more months. The
real upside fireworks may come next year when a breakout above 150 becomes
increasingly likely. In the short run, the upside cmap for most cycles was
122. That's been met, another reason for looking for a short term
pullback. Uncle Buck's Illness Buck broke
down last week and is headed for a retest of the low of 103.50. That
should be good for a short term bounce, but the 6 month cycle is
heading down for 2 more months, by which time the 1 year cycle will be in
a confirmed downtrend. As goes Buck, so goes the stick market. Suctor Watch and Stoolwethers- Now posted on separate page. Updated each morning between 8 AM and 9:30 AM NY time. See you in Intraday Stool. Dr. Stepan N. Stool Share your thoughts on the Stool Pigeons Wire.
Renewals Welcome, and thank you for subscribing to the Anals of Stock Proctology. Your trial subscription will run for 90 days. At the end of that period your subscription will renew automatically, unless you cancel. If you wish to cancel your subscription use the button below. If you want to renew your subscription do nothing. Your subscription will renew and your credit card or Paypal bank account will be charged. If you want to renew, be sure your credit card information in your Paypal account is current. Paypal will not renew your subscription if the card has expired! Again, thanks for subscribing!
Explanation of Intraday Commentary-Build charts at http://www.livecharts.com. For custom time bars insert a comma after symbol and number of minutes, e.g. compx,90. This will give you a bar chart of the Nas with 90 minutes per bar. The one day cycle is usually most clear with 8 minute bars and 26/18 stochastics. It varies from day to day. Sometimes 6 minutes works best. Experiment to find the best fit for your trading style, and the market's dominant frequency at the time. The goal here is primarily to monitor the condition of the 8 and 13 day cycles. I typically use 90 minute bars with 26/18 stochastics for the 13 day cycle proxy on the indices during regular trading hours. Other cycles use 26/18 stochastics with the following: 8 days- 60 minute bars On the 24 hour futures charts, use a time per bar approximately 3 to 4 times the above number of minutes, to represent the cycles listed above. ABBREVIATIONS: cma: centered moving average
|

![[Most Recent HUI from www.kitco.com]](http://www.weblinks247.com/indexes/idx24_hui_en_2.gif)
![[Most Recent XAU from www.kitco.com]](http://www.weblinks247.com/indexes/idx24_sp500_en_2.gif)
![[Most Recent Quotes from www.kitco.com]](http://kitconet.com/charts/metals/gold/t24_au_en_usoz_2.gif)