|
Archives 12/30/01, 1/1/02, 1/2/02, 1/3/02, 1/4/02, 1/7/02, 1/8/02, 1/09/02, 1/10/02, 1/11/02, 1/14/02, 1/15/02, 1/16/02, 1/17/02, 1/18/02, 1/22/02, 1/23/02, 1/24/02, 1/25/02, 1/28/02, 1/29/02, 1/30/02, 1/31/02, 2/1/02, 2/4/02, 2/5/02, 2/06/02, 2/7/02, 2/9/02, 2/11/02, 2/12/02, 2/13/02, 2/14/02, 2/16/02, 2/19/02, 2/20/02, 2/21/02, 2/23/02, 2/25/02, 2/26/02, 2/27/02, 2/28/02, 3/1/02, 3/04/02, 3/05/02, 3/06/02, 3/7/02, 3/10/02,3/11/02, 3/12/02, 3/13/02, 3/14/02, 3/15/02, 3/18/02, 3/19/02, 3/20/02, 3/21/02, 3/22/02, 3/25/02, 3/26/02, 3/28/02, 3/30/02 4/1/02, 4/2/02, 4/3/02, 4/4/02, 4/6/02, 4/8/02, 4/9/02, 4/10/02, 4/11/02, 4/13/02, 4/15/02, 4/16/02, 4/17/02, 4/18/02, 4/20/02, 4/22/02, 4/23/02,4/24/02,4/25/02, 4/26/02, 4/27/02, 4/29/02, 4/30/02 5/01/02, 5/2/02, 5/4/02, 5/6/02, 5/07/02, 5/8/02, 5/09/02, 5/10/02, 5/13/02, 5/14/02, 5/15/02, 5/16/02, 5/17/02, 5/20/02, 5/21/02, 5/22/02, 5/23/02, 5/24/02, 5/28/02, 5/29/02, 5/30/02 6/01/02, 6/3/02, 6/4/02, 6/5/02, 6/6/02, 6/7/02, 6/10/02, 6/11/02, 6/12/02, 6/13/02, 6/14/02, 6/17/02, 6/18/02, 6/19/02, 6/20/02, 6/22/02, 6/24/02, 6/25/02, 6/26/02, 6/27/02, 6/30/02 7/1/02, 7/4/02, 7/5/02, 7/11/02, 7/14/02, 7/15/02, 7/16/02, 7/17/02, 7/18/02, 7/19/02, 7/22/02, 7/23/02, 7/24/02, 7/25/02
|
The Anals of Stock ProctologyPublished weeknights by
8:30PM Happy Acres, Florida Time The American Academy of Stock Proctology and Is your subscription up for renewal? If you want to renew, do nothing, unless your credit card has expired. Please be sure your credit card info is current. If your credit card has expired, you must enter the new expiration date in your Paypal account in order for your subscription to be processed. If you subscribed via Paypal, your subscription will be renewed for one year on the 90 day anniversary of your sign-up and your credit card will be charged. If you want to cancel, use the button at the bottom of the page. This applies only if you subscribed through Paypal. Mailed-in subscriptions are for 1 year. If you subscribed by prior contribution, I will send you a notice before your subscription expires. If you have any questions, see the subscription page and FAQ's. If you can't find the answer, email me. PM Update 7/29/02 1:00 PM Terms and methodology There's still no confirmation that the 8 day cycle high is in. The 1 day cycles blew out their cmaps to the upside. Except for the SPX, the AM estimate of the 8 day cycle cmaps have been hit and broken slightly and they may now be projecting significantly higher. It's hard to tell at this point, but the worst case upside estimates are posted in the chart. The tick hit a record reading this morning. The problem is that this could be thrust rather than blowoff. If these gains hold through the day, we are probably looking at a six month cycle up phase, and perhaps more. Nothing can be ruled out at this point, but it would be extraordinary for a four year cycle bottom without days of basing and a retest, so I doubt that's what we are looking at. Doc will need to see the end of day charts before reaching any conclusions about the six month cycle. From a strategy standpoint Doc feels the same way as he felt before the open. He wants to see at least that first pullback before thinking about going short, and now in view of the juggernaut we've seen so far, would probably sit out even the down phase of the 8 day cycle. If there's not an 8 day cycle high today, and prices push through current highs, that is strong evidence that the big swing cycles may be merciless on the upside for long enough to inflict extreme pain and suffering on bears. No matter how insane you think this rally is, capital preservation must be the first order of the day. As I'm finishing this up, it looks like the high might be forming, as revised upside cmaps for a number of short intraday cycles along with the 2 day cycle are being hit. Doc does not make trading recommendations. This update reports intraday time cycle estimates and centered moving average projections based on the Hurst cycle analysis method. Doc assumes no responsibility for the accuracy or inaccuracy of these estimates and projections. The market may or may not meet these projections. New stoolies should thoroughly familiarize themselves with the methodology before trading based on this method. There is no free lunch. Those who do not have the time or inclination to develop a trading strategy based on testing and research should not trade. Trade at your own risk. On the other hand, if you made any extra this week on account of The Stool, send it in!
AM Update 7/29/02 8:45 AM Terms and methodology We're seeing a breakout of the most recent downtrend channels this morning. The 3, 5, 8 and 13 day cycles are due today. The rally would need to fail, creating a classic false breakout, in order to keep the 10-13 week cycle downtrend intact. If this morning's gains hold or extend through the day, then the 10-13 week cycle has turned up. The problem will be to project the slope of the uptrend. Will it be a spike or a sideways churn? Doc will deal with that issue tonight. Today will again be a day to watch and wait, as the market decides whether, and how far, it's going to go around the corner. If you are a wild and crazy guy or girl, and you short the early rally, be prepared to cover quickly, and use protection. Doc will stay out and observe the first pullback, and would not be inclined to go short until it's clear that at least the 8 day cycle has topped out. Likewise, with the 8 day cycle due to top out, Doc isn't looking to go long. Wait
a minute, Doc is never looking to go long. Cycle projections are in the chart below.
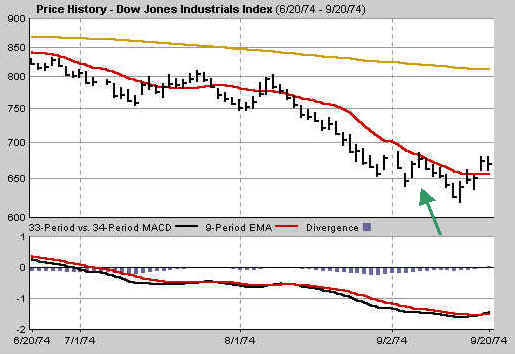
Ghost of Bear Markets Past (7/27/02) We are all looking for clues as to whether or not the bottom is in. Well, maybe not THE BOTTOM, but a bottom of sorts nevertheless. It seems a consensus has developed over the last 24 hours or so, among bulls and bears alike, that the low is in, although Doc suspects the bulls are terrified that it might not be. Have you seen the performances of portfolio sphincters like Bald Boob Froehlick, of Scuzzier Investments, and Big Dick Hooey (Mr. Slow Bull Market) of Drypuss on Crapvision lately? What with the yelling, screaming, eye-popping, waving of arms, and spittle flying, you know they don't exactly have their you-know-what together anymore. True, they are still able to get their lines out, being the trained actors they are. But their former smug confidence has been replaced by shrill, wild-eyed ranting. Still they are bullish, and even the long time bears, like the colorful Bearton Biggs, are bullish, at least for a big rally, if not a new bull market. Look around, and there's hardly a bear to be found! Which brings to mind Stock Proctology Precept Number 1.5. When Wall Street has reached a universal consensus, it is, by definition, wrong. The reason it is wrong is because everyone has already placed their bets in the direction f the consensus. If the consensus is bullish after a long decline, like now, it means they have already plowed everything they have back into the market, awaiting the big rally. So the question becomes, who is left out there to continue the buying? Probably no one, is Doc's guess, but there has indeed been a liquidity build over the last week as a result of the enormous volume, and there may be some left in the kitty. The Feed, so far, is sitting on its hands. Al and the Gang are not to be blamed for this rally, although the Plunge Protection Team (PPT), otherwise known as the The Treasury Department's Exchange Stabilization Fund, certainly was involved. All you have to do is look at Uncle Buck's chart below to know that his resurrection from the dead does not appear to be a result of normal cyclical forces. No, as our good buddy Mark, of Mark To Market fame is wont to say, the invisible hand showed up. All the more reason to suspect that this rally will be short lived and fully reversed a lot quicker than most suspect at the moment. Notice Doc said "suspect." We are in a highly uncertain and dangerous environment. There is also a risk of a melt-up on the short side, as huge numbers of newbie shorts came into the market in recent weeks, especially ion the recommendation of Maria Fartaroma the day before the low last week. These raw recruits to our side can, and have, caused real problems in the past. As soon as the squeezing starts they run for the exits because they got in late. Their short covering naturally exacerbates the squeeze. We can't know when that short covering has been exhausted, except by watching the tape and the charts for signs of exhaustion, or another selling wave. A number of stoolies have said that we are in uncharted waters. That's not entirely true. Doc thought he'd take a look back at history at past months-long grinding declines like the recent one to see if we have in fact been here before. While no two markets are exactly alike, and volatility varies widely from era to era, human nature is constant. A crowd that's under stress can be expected to act similarly when under the influence of similar stimuli. So what has happened in the past when investors have been subject to two months of relentless decline like we've just been through? This chart shows the current
period with a 200 day and 13 day moving average, and with a 33/34 day MACD,
which is a fair, but slightly lagging indicator of the 10-13 week cycle.
Here we experienced a only couple of minor bumps before last week's big 3
day rally back to the 13 day moving average, a little more than 2 months
from the onset of this decline. The MACD has flattened, but hasn't turned
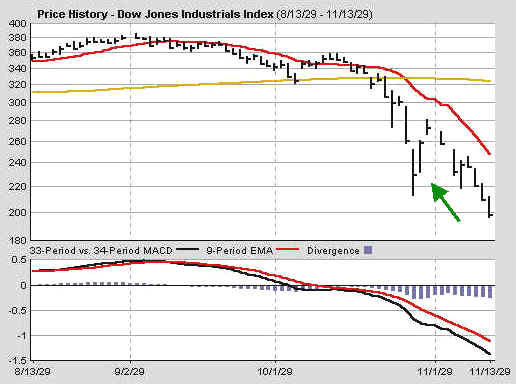
up. Leading up to and including the
Great Crash, the market had declined for nearly 8 weeks. There was an
enormous rally of more than 10% on October 30, 1929, the day after the
crash, and follow through on
October 31. The Dow did not make it back to the 13 day average. The market
then reversed, fell another 7 days and smashed through the October 29 low,
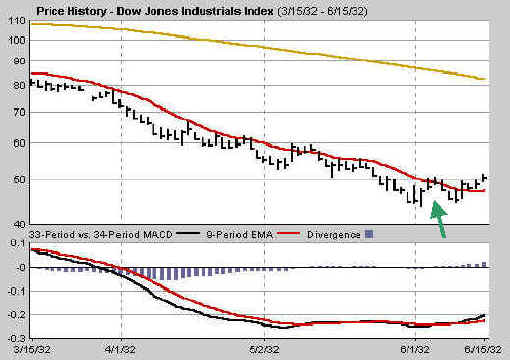
before launching a huge rally taht lasted into the spring of 1930. The Great Bear Market was coming
to an end in the summer of 32, ultimately 35 months after it began. The
final long washout began on March 9 with the Dow losing 1.80 to 86.94. A
powerful 1 day rally on May 9, which then hung around for a couple of days, saw the
Dow gain 10% and break the 13 day moving average. The grind then resumed,
with another rally in the beginning of June followed by a retest and rally
which looked even better. (End of chart) The Dow then lost 15 % in 7 days, rallied for a
week and made a lower low on July 8 at 41.22. This was the buying
opportunity of the century. It's worthwhile to note that the Dow traded
between 41 and 45 from June 27 to July 20, three full weeks, when it embarked on an 80%
rally in seven weeks. Of course by then, no one cared, because no one had
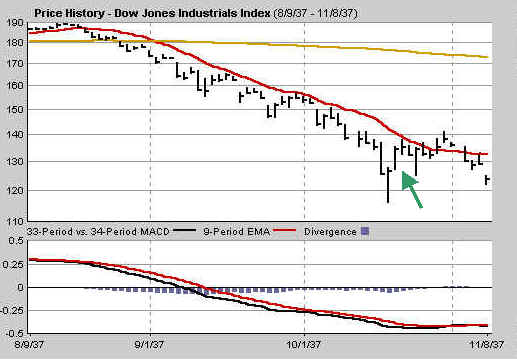
any money. The grinding 1937 bear market
decline went on two months before a huge turnaround in mid October. The 3
day rally got back to the 13 day moving average, consolidated, then
punched through five days later. That was the end of the rally. The
decline lasted until November 23, and bottomed at 113, at about the level
of the intraday low on October 13. Some of us were in the market
during this next one. The market had begun its decline on June 13 but had a
couple of pops in July and August off the 750 level. The big grind came in
August, taking the market down 20% in a month. Then there was a small 3
day rally after Labor Day. It quickly failed. Then there was a 4 day, 10%
rally that began on September 16. That one really looked good, because it
broke the 13 day moving average, and turned the MACD up. (End of chart) But alas it was a
false alarm. The market dropped 15% over the next 10 days to the ultimate
bottom, and the second great buying opportunity of the century, on October
4. There was a big rally, and then a retest in early December. The Dow hung
around at or below 600 until December 31 (again 3 weeks) before the first leg of the bull market
took off in earnest. So there's a little history. Given that human nature doesn't change, it's a bit much to expect the market to a lunch a big rally from here and not look back. Based on the five examples above, you'd expect that the rally would fail on Monday, and head for new lows within a week. Of course, back in those days, there was no PPT! The Feed
did not refund $2.25 billion in overnight repos resulting in another
drain. There are no expirations on Monday. The total Feed, which is
the amount Fed holdings of loans and securities, has once again
dropped back to the lower 10% growth channel band. Assuming no change in
policy they will begin pumping again this week. A break below the channel
will signal a policy shift toward slower monetary growth, perhaps in an
effort to support Uncle Buck. In theory, any tightening of the growth rate
would be devastating for stock prices in a financial system starved for
liquidity. The Feedometer, which
theoretically measures the amount of excess Feed available to the Gang of
22 for jamming stock prices, (although not necessarily used for that
purpose), has turned neutral. This is another sign that Al has taken his
lead foot off the gas ever so slightly. However, as you recall from Thursday's
Anals, there's yet another GSE credit bulge in the pipeline that will come
on stream very rapidly in the weeks ahead. It will be interesting to
see if a system on the brink of collapse can reflatulate itself and launch
yet another mini-boom like the one in the fourth and first quarters.
Portfolio Sphincters Index (SPX) and Sentiment Downside cmaps remain in the high 700 range, which was already hit. The 8-13 day cycle up phase should top out Monday. The 4 week cycle also may be in an up phase with possible upside to 880. That is very iffy, but I want to put it out there as an upside risk This is still a day trader's market. Until there's clarity, it's not time to set up swing positions. The 17 day rate of change, which represents the 6-7 week cycle, upticked again, this time through the smoother. Look for it to back off, but if it doesn't that's a buy signal for at least a sideways up phase. The superimposed 6-7 week cycle oscillator (red) started to turn up. An upturn from here, with the trend as weak as it is, does not necessarily mean that the up phase of the cycle will have a positive slope in real terms. It may simply be positive in relation to larger waves, in other words, a pause, or slowing in the downtrend. But the risk from the bearish perspective is that the up phase manifests as a short but violent spike to the upside. The 29 day rate of change, normally stabilizes and turns up ahead of price when the 10-13 week cycle turns. It still isn't clear that it is in the process of doing that in spite of upticking for a few days. The 10-13 week cycle oscillator (navy) is beginning to turn up but not enough yet for confirmation of a cycle low. The market usually does some backing and filling during the trough phase of the 10-13 week cycle. Then it takes off to the upside when the indicators get in gear. The turn in this cycle would portend at least some upside, but with the long term trend as weak as it is, the rally should either be constrained in terms of time, price, or both. The VIX fell to 40.44 after hitting 56.74 Wednesday. The Index is squarely in the center of the descending Stool Band projection. At a major low, extreme fear readings normally persist for several days. A buy signal is generated when the index drops below the blue band and then reverses. While this doesn't look "good" in terms of the 6 month cycle low, it appears to be signaling a 10-13 week cycle low. The chart should be read just as you would read a stock price chart. It appears to be signaling a short sharp up phase. Fear is receding rapidly. Doc reminds you to use this indicator for confirmation only. Price indicators are as always the final arbiter.
The blue channel lines are the extension of a linear
regression channel from the September 2000 and March 2002 highs. The 6 month cycle oscillator and the trading stoolicator are still trending down. The short cycle oscillator is headed up, but alone that's not enough to confirm that longer cycles have exhausted their downward momentum. The index has only turned the shortest waves from down to flat. We need to see another day or two of market action before determining whether they are turning up. The 10-13 week cycle oscillator is
beginning to turn up in a bottom zone. It would need to turn up sharply to
signal anything other than a sideways consolidation. The rally stopped dead at a
multiple fibo retrace level just above 850.
The weekly chart suggests that the intermediate cycle low is in the
process of forming. Unlike past bear markets, this one hasn't given much
in the way of retests of the lows. It's possible, in spite of the
historical record, that the recent selloff is all the bears get to chew on
for awhile. The Cycle Conditions tables include cycle phase and a wild guess as to number of periods to the next turn, in days for the shortest cycles, weeks (W) or months (M) for the longer ones. This is a fluid exercise, in other words, the projections are likely to be wrong, but they force us to be vigilant for key turning points, and frequently work well enough to prevent costly misreadings. SPX Cycle Conditions as of 7/25/02
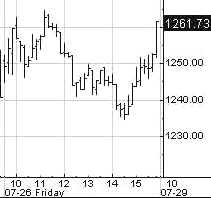
PTT - Periods Till Turn Nasgap Charts Cmaps for shorter trading cycles suggest that there's little if any upside in this short cycle up phase. It may already be over. The initial upside cmap on the 13 day cycle dropped to 1280, which was already reached. The 5-6 month cycle cmap projects a possible shot to 1000. That becomes more likely if Wednesday's gain is reversed completely tomorrow. The
10-13 week cycle oscillator is now flat in negative territory. We've seen
this before. It signifies steady trending until the oscillator moves up or
down out of the range. 1282
remains the next upside fiber nacho reflux level. The slope
of the secular trend is actually unknown, in spite of the pink channel
lines. This move could carry to the lower projection of the four year
cycle channel. At this point we have to wait for greater certainty as to
whether the cycle low forms around current levels or spikes down to the
big round number. Nasdaq Cycle Conditions as of 7/25/02
PTT
- Periods Till Turn AM Edition Features (Previous) These features are in morning edition, published around 9 AM ET US, or the Saturday Weak End Edition, published, uh, let's see, Saturday! There are signs here of a deflationary crisis and collapse. We see similar signs in the action of gold and gold stocks. Much depends on whether bond yields can hold near current levels. If they do not, and you believe the US Government will continue to pay its bills, then I'd be buying Treasuries hand over fist, but ONLY on a breakout below 4.10%. The worst part of this is that the buy signal was there right in front of Doc's face as yields began to roll over in April, and he chose to dismiss it. It is critical when reading charts, not to have an ideology. You MUST have an open mind. Doc was an inflationist, and assumed the inverse head and shoulders would resolve to the upside. That ideology got in the way of reading the charts properly. The same thing applies to gold. We must not allow our belief system to get in the way of dispassionate chart analysis. For now, we must await the
completion of the test of the lows and the next up phase, before the long
term can be forecast with greater assurance. Bank stocks
found temporary support at the bottom of the major trend channel and
closed the week well above it. Expect lots of churning for a few weeks,
but no rally without the cycle oscillator turning up. The uptrend
in the homebuilders is still intact. Be careful shorting these. The housing
bubble still has life. It looks like it's beginning to top out, but more
rollover in the long term linear regression slopes is needed to confirm. Con-sumer
stocks also found support at the bottom of their long term cycle channel. Drugs,
however, did not, but will now try to establish a new trading range around
current levels. Looks like
all the software we will ever need has already been invented. The game is over in small craps. Actually there never was a game, unless it was Channeling Stocks. Let's see. Now it's at the bottom of the channel. Do I play for a bounce again? If you like thin stocks, lots of volatility, and lousy executions, sure, why not? At 500 on the Rusty Index, All the portfolio Sphincters said we were in a new long term bull market that would last for years in the small craps. Liars. There's that
deflation story again- Energy. With all that hot air coming out of
Washington and Wall Street, we don't need no' mo' gas. The dirty
SOX should be putting in an intermediate low soon, but a lot of damage can
still be done in a few weeks, or even a few days. The 10-12 month cycle
cmap looks like 275. I say we give Golden Sacks a slap upside the haid for
that last Big Bork of this garbage. Ever seen a
whole industry go to zero? Keep watching. General
Custer is signaling an intermediate cycle up phase on the long term chart.
It could develop into a trading range lasting months. Or it could show up
as merely a slowing of the downtrend. The other General,
once the greatest industrial company in the world, is like General Custer,
no more than a finance company, a wildcat subprime lender. You can't buy
and hold because you can't trust these companies not to morph into
something else, and you can never buy and hold a finance company because
interest rates always fuctuate. And so do stocks sensitive to credit
conditions. So, is this a trading buy yet? Not on your life. Maybe if it
breaks below 40. Minnesota
Market Maker Company is the one they use to jack the Dow. I wouldn't want
to be in the game with those guys. This stock is so important to the
market, they've managed to keep it in an uptrend, just barely. Easy to do.
It's barely a big cap. If they move
MMM and PG, they move the market. The uptrend is intact, but its days are
numbered. Fannie is
sagging in a slow downtrend, but is impossible to trade. It is important
as a barometer of the health of the world financial system. Fannie Mae,
central banker to the world. According to
the intermediate cycle oscillator Mr. Bill is in an up phase, so it will
churn around between 40 and 50 for awhile. By the time the judge gets
through with Bill, the price will start with a 2. An upturn in
the intermediate cycle oscillator suggests IBM will churn for a few months
before breaking down on the road to 50. Uncle Wally
has a lot of fans at 45 bucks. He should be able to keep it together for a
while longer. Henceforth and forevermore, if you would like to request a "stock o'der", please post your request in Dear Dr. Stool. If you have not already registered for the message board, please do so. The only required info is user name and password which you choose yourself, and your email address, which you can keep private by selecting the keep private option. Doc looks forward to featuring your ideas. We've had some good ones! Uncle Buck's Illness
The weekly chart suggests that Buck has found support at the lower
projection of the long term cycle channel. The intermediate cycle
oscillator has not confirmed yet. It may only be a consolidation leading
to another breakdown in a month or two. Golden Stool It was a
disaster. The price of gold fell back below the neckline of the long term
base, a classic and enormous WHOPsaw. Gold must stabilize and turn up,
getting above 310 over the next few weeks for the long term outlook to
remain positive. The gold
stocks put on a 1987 style crash. HUI must hold at these levels, or it too
will complete a massive WHOPsaw, which would be a terrible indicator for
the long term outlook. The jury is still out, but this needs to stabilize
quickly or the verdict will be guilty. Doc will withhold judgment until he
sees more evidence. See you in Intraday Stool. Dr. Stepan N. Stool Share your thoughts on the Stool Pigeons Wire.
Renewals Welcome, and thank you for subscribing to the Anals of Stock Proctology. Your trial subscription will run for 90 days. At the end of that period your subscription will renew automatically, unless you cancel. If you wish to cancel your subscription use the button below. If you want to renew your subscription do nothing. Your subscription will renew and your credit card or Paypal bank account will be charged. If you want to renew, be sure your credit card information in your Paypal account is current. Paypal will not renew your subscription if the card has expired! Again, thanks for subscribing!
Explanation of Intraday Commentary-Build charts at http://www.livecharts.com. For custom time bars insert a comma after symbol and number of minutes, e.g. compx,90. This will give you a bar chart of the Nas with 90 minutes per bar. The one day cycle is usually most clear with 8 minute bars and 26/18 stochastics. It varies from day to day. Sometimes 6 minutes works best. Experiment to find the best fit for your trading style, and the market's dominant frequency at the time. The goal here is primarily to monitor the condition of the 8 and 13 day cycles. I typically use 90 minute bars with 26/18 stochastics for the 13 day cycle proxy on the indices during regular trading hours. Other cycles use 26/18 stochastics with the following: 8 days- 60 minute bars On the 24 hour futures charts, use a time per bar approximately 3 to 4 times the above number of minutes, to represent the cycles listed above. ABBREVIATIONS: cma: centered moving average |
|||||||||||||||||||||||||||||||||||||||||||||||||||||||||||||||||||||||||||||||||||||||||||||||||||||||||||||||||||||

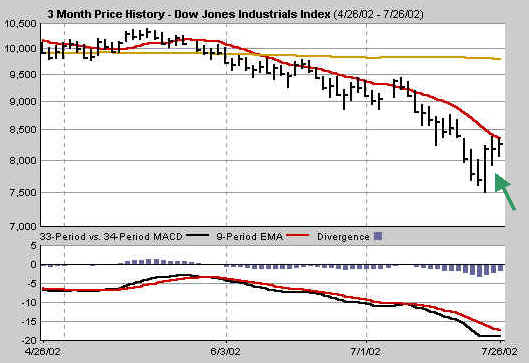
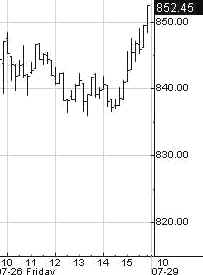
 Given the history cited above, Doc is still wondering if this rally was
indeed the start of an intermediate bottom. It may have been, but the bottom is not
confirmed yet in spite of the 13 day and 4 week cycle oscillators turning
up. They remain at
very weak levels and there's no confirmation from the longer
oscillators. The 8 and 13 day cycle highs are due Monday. The upside
cmap on the 13 day cycle is still 8400.
Given the history cited above, Doc is still wondering if this rally was
indeed the start of an intermediate bottom. It may have been, but the bottom is not
confirmed yet in spite of the 13 day and 4 week cycle oscillators turning
up. They remain at
very weak levels and there's no confirmation from the longer
oscillators. The 8 and 13 day cycle highs are due Monday. The upside
cmap on the 13 day cycle is still 8400.
![[Most Recent XAU from www.kitco.com]](http://www.weblinks247.com/indexes/idx24_nasdaq_en_2.gif)
![[Most Recent XAU from www.kitco.com]](http://www.weblinks247.com/indexes/idx24_sp500_en_2.gif)
![[Most Recent Quotes from www.kitco.com]](http://kitconet.com/charts/metals/gold/t24_au_en_usoz_2.gif)