|
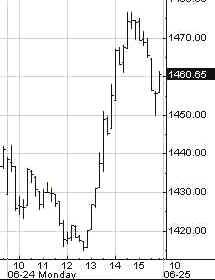
10 Minute Bar Charts 6/24/02 Dow Jokes Inflatables
Archives 12/30/01, 1/1/02, 1/2/02, 1/3/02, 1/4/02, 1/7/02, 1/8/02, 1/09/02, 1/10/02, 1/11/02, 1/14/02, 1/15/02, 1/16/02, 1/17/02, 1/18/02, 1/22/02, 1/23/02, 1/24/02, 1/25/02, 1/28/02, 1/29/02, 1/30/02, 1/31/02, 2/1/02, 2/4/02, 2/5/02, 2/06/02, 2/7/02, 2/9/02, 2/11/02, 2/12/02, 2/13/02, 2/14/02, 2/16/02, 2/19/02, 2/20/02, 2/21/02, 2/23/02, 2/25/02, 2/26/02, 2/27/02, 2/28/02, 3/1/02, 3/04/02, 3/05/02, 3/06/02, 3/7/02, 3/10/02,3/11/02, 3/12/02, 3/13/02, 3/14/02, 3/15/02, 3/18/02, 3/19/02, 3/20/02, 3/21/02, 3/22/02, 3/25/02, 3/26/02, 3/28/02, 3/30/02 4/1/02, 4/2/02, 4/3/02, 4/4/02, 4/6/02, 4/8/02, 4/9/02, 4/10/02, 4/11/02, 4/13/02, 4/15/02, 4/16/02, 4/17/02, 4/18/02, 4/20/02, 4/22/02, 4/23/02,4/24/02,4/25/02, 4/26/02, 4/27/02, 4/29/02, 4/30/02 5/01/02, 5/2/02, 5/4/02, 5/6/02, 5/07/02, 5/8/02, 5/09/02, 5/10/02, 5/13/02, 5/14/02, 5/15/02, 5/16/02, 5/17/02, 5/20/02, 5/21/02, 5/22/02, 5/23/02, 5/24/02, 5/28/02, 5/29/02, 5/30/02 6/01/02, 6/3/02, 6/4/02, 6/5/02, 6/6/02, 6/7/02, 6/10/02, 6/11/02, 6/12/02, 6/13/02, 6/14/02, 6/17/02, 6/18/02, 6/19/02, 6/20/02, 6/22/02
|
The Anals of Stock ProctologyPublished weeknights by
8:30PM Happy Acres, Florida Time The American Academy of Stock Proctology and Dr. Stool will be traveling from June 29 to July 14. The Anals will not be regular during that time. An abbreviated version of the nightly commentary will be published when internet access is available. Doc will post a message on the Stool Pigeons Wire on days the Anals will be published. Intraday updates will not be published. (Last time Doc took a vacation, the market bottomed.) Subscription Renewals are coming up! If you want to renew, do nothing. If you subscribed via Paypal, your subscription will be renewed automatically and your credit card will be charged. If you want to cancel, use the button at the bottom of the page. This applies only if you subscribed through Paypal. Mailed-in subscriptions are for 1 year. If you subscribed by prior contribution, I will send you a notice before your subscription expires. If you have any questions, email me. PM Update 6/25/02 1 PM Terms and methodology The morning was a little more nerve-wracking than Doc likes. But, no harm no foul. The upside camps for the 3 day cycle posted this morning were reached but not violated. Still having a problem with the intraday cyclicality. At the moment, longer fib number lengths like 8 and 13 hours are working, and the 5 hour cycle may be back. Not knowing which intraday cycle is dominant makes it impossible to guess where the intraday highs and lows are most likely, in terms of time. At this writing the 1 day cycle is down, but the low is due at 1 PM. A 3 hour low is a little overdue, but the 5 hour cycle low wouldn't be due until 2:15. Since 5 hours is the most common cycle, I'll use that one for the cmap projections and time points. The good news is that the 8 and 13 hour cycles have topped out and the down phase should run for the remainder of the day. The 3 day cycle looks busted as well, but its ozzie hasn't rolled over yet. The 8 day cycle is assumed to be in a swup for now, which means you shouldn't expect yesterday's lows to break for at least 2-3 days. Doc does not make trading recommendations. This update reports intraday time cycle estimates and centered moving average projections based on the Hurst cycle analysis method. Doc assumes no responsibility for the accuracy or inaccuracy of these estimates and projections. The market may or may not meet these projections. New stoolies should thoroughly familiarize themselves with the methodology before trading based on this method. There is no free lunch. Those who do not have the time or inclination to develop a trading strategy based on testing and research should not trade. Trade at your own risk. On the other hand, if you made any extra this week on account of The Stool, send it in!
AM Update 6/25/02 9:40 AM The upside cmaps of the move in progress look like 1002 on the SPX and 1481 on Nas. AM Update 6/25/02 9 AM Terms and methodology Fucutures are higher this morning and look like they want to turn up again. The 8 day cycle low was due today, raising the question of whether yesterday was it. The early selloff yesterday led to a near miss of the 8 day cycle downside cmaps, but it was close enough. 8 day cycle ozzies indicate the up phase is under way. Shifting down to the 3 day cycle, initial upside cmaps were approached or met yesterday. Both the 3 and 5 day cycle highs appear to be due today, so we'll have to see how the market acts as the highs from yesterday are approached. Don't know what the intraday cycle wave is going to look like either. The last one was 3 hours. If that repeats, it will head higher into a high at 11 AM, with a 1 day cycle low to follow at noon-1PM. The current 1 day cycle phase looks like a sideways down. Should get a clearer picture for the PM update.
People Are Stupid (6/24/02) Yours truly not excluded of course. Sometimes the most obvious things simply elude us, perhaps because they are too close to our noses. The market took off like a shot mid-day, leaving Doc all but certain that he had just witnessed an all too obvious government intervention. As the market was plunging into the abyss, across the board buying appeared suddenly and without notice. Then Doc looked at the charts, and what did he see right in front of his nose? The thing had turned at almost the exact closing low of the Nasdaq on September 21, at least in terms of the Nasdaq and SPX. Certainly that doesn't mean that it wasn't orchestrated and supported by "non-market" forces. But at least there is a less sinister explanation -- program trading based on the averages reaching the September low close. Now that the programs have triggered and done their dastardly deed, what next? Probably not much. Some shorts rushed to cover following the turn, but they did not continue to panic as they have in the past. As big as the rally was, for the most part, bears were winking and nudging each other with their elbows. It was more a "har har har" kind of thing, than outright fear among the shorts. By late afternoon, the panic subsided. There is no sign on the charts that anything significant happened, other than a manufactured "test" of the lows. After another day or two of this kind of "testing" (har har), the market will break down. In a final note, Doc has a sneaking suspicion that people in high places may be reading the Stool. Today he heard Abbotand Costello and PissAnt reporting on Crapvision the possibility of a "lost generation of investors." Now, you know Doc listens to Crapvision every day. (For inspiration of course.) And he has never once heard them discuss this before. As you also know, Doc wrote about the theme of losing a generation of investors this weekend. Surely, just a coincidence. Uh huh. The Feed
did $7.25 billion in 3 day repos, replacing $2 billion in weekend repos. This
is no surprise, as the total feed was bumping along at the lower edge of
the Fed's target band. It wasn't a massive feed, and probably played
little a role in the afternoon jam. Still they could come again tomorrow,
and it could be enough to hold the market together for a bit longer. The Slow Feedometer, which is the
17 day average of the daily excess Feed available to jam the market,
downticked again, in spite of the uptick in the fast feedometer (grey
line). We'll just have to see if the Feed makes an effort to pump it up
again. It shouldn't matter.
Portfolio Sphincters Index (SPX) and Sentiment The Sphincters Index also came roaring back, after coming within 5 points of the September 21 closing low of 965.80, closing up 3.5 points. Doc hates to tell the folks that participated in this farce that never in recorded history has a low been successfully tested nine months later. What happened today was a manufactured exercise in futility. The 17 day rate of change, which represents the 6-7 week cycle, upticked, but did not cross it's smoother. No signal there. The 6-7 week oscillator superimposed on the price chart, is still heading up however. That appears to be the result of this cycle beginning a weak sideways up phase. The 10-13 week cycle oscillator (navy) represents the governing cycle as it sinks. The 29 day rate of change remains in a flat pattern in negative territory, indicating a stable downtrend. A downside breakout breakout accompanying downward price acceleration would mark the final phase of the decline. The VIX fell to 29.87. On the inverted scale chart, as the Stool bands trend lower, VIX is moving toward the center of the channel. So fear levels remain relatively moderate. At this stage it's more like mild concern. At a major low, extreme fear readings will persist for several days. A buy signal will not be generated until the index drops below the blue band for several days and then reverses. In another words, it does not pay to anticipate. MaxVIX will not be recognizable until after the turn. The blue channel lines are the extension of a linear
regression channel from the February and May 2001 highs. The 6 month cycle
oscillator looks to be headed down again after a pause of several weeks. A
flat trend at this level signifies a stable downtrend. The trading
stoolicator shows that the key trading cycle is steadily weakening. The short cycle oscillator
is beginning a downturn. The 10-13 week cycle oscillator is trending
gradually lower. The centered moving average projections inched up to 932,
due in 3 to 6 weeks. Once they cut through the June low, ok not like a knife
through butter, the next stop is 950. The Cycle Conditions tables include cycle phase and a wild guess as to number of periods to the next turn, in days for the shortest cycles, weeks (W) or months (M) for the longer ones. This is a fluid exercise, in other words, the projections are likely to be wrong, but they force us to be vigilant for key turning points, and frequently work well enough to prevent costly misreadings. SPX Cycle Conditions as of 6/24/02
PTT - Periods Till Turn Nasgap Charts The Nasgap
actually ticked through the September 21 close of 1423. At the level of
1415, someone, or something, intervened, triggering one of those patented
short squeezeswe've gotten used to in this bear market. But unlike the
recent past, as dramatic as this one was, the Nas was only up 19, after
being up 35, an hour before the close. The 6 month
cycle time series is still drifting lower. The 10-13 week cycle
oscillator and the trading stoolicator are steadily declining. There's no
sign of a meaningful low here. The Nascrap
100 continues to lead the way, just as it did on the upside of the bubble.
It is trading well below the September lows in spite of today's rally. 1439 is
the last fibo number before the September low on the Nas. Looks like they
want to flirt with that level a bit before breaking down below 1400. Nasdaq Cycle Conditions as of 6/24/02
PTT
- Periods Till Turn AM Edition Features (Previous) The Bong has hit major
resistance (inverted price chart) and shows signs of reversing. The 17 day
rate of change is flashing an upturn signal. SOX are
sitting on the lower cycle channels. No signals yet, but if the ozzies
turn up, look for a swup. No sign of
an upturn yet in the Consumer Index but it is nearing trend support. Energy
stocks are on the cusp of an upturn but this is not a slam dunk. Bears
close watching over the next few days. The small
craps are sitting at long term cycle channel support with early warning
signs that the sector may go into a SWUP. This is another area that needs
close watching the next few days.
The bubble
ain't finished. Homebuilding stocks are headed higher again. Last hurrah. Doc warned
you about the HMO's last week. Will they find temporary support at 166, or
just gap i?. Wally is
getting late in an intermediate swup. But as Yogi says, it ain't over till
it's over. Mr. bill's
fan's don't want to let this swup die. Doc hates this stock as a trading
vehicle. Shorting it is no more than a test of macho. But if I were going
to do it, 55-56 would be the place, with a tight stop. Market Maker
Manager is also at a major infection point, and the indicators are
pointing both ways. If it breaks 121, the market will get infected. Infell held
at the September low. Lots of support here. It should swup for a few
weeks. GE is still
"swuppin". It will probably just keep drifting lower. Stoolie
riffraff suggested a look at FLIR. Doc likes their bubble gum. Looks to
Doc like this one is slowly but surely forming a massive top, with signs
that breakdown is imminent. 38-39 and 35 are obvious support levels. If I
weren't short this yet, I'd watch for a while for a better entry on a
reaction to resistance. Henceforth and forevermore, if you would like to request a "stock o'der", please post your request in Dear Dr. Stool. If you have not already registered for the message board, please do so. The only required info is user name and password which you choose yourself, and your email address, which you can keep private by selecting the keep private option. Doc looks forward to featuring your ideas. We've had some good ones! Uncle Buck's Illness
Buck just keeps getting sicker. With the intermediate cycle beginning to
top out, the collapse may actually accelerate in the weeks ahead. That's
kind of hard to believe. But if it doesn't recover to 108 and rally from
there, the collapse scenario becomes more likely. Golden Stool Starting to
see buy signals in HUI. The next few days will tell if the preliminary
indications are for real. See you in Intraday Stool. Dr. Stepan N. Stool Let me know what you think on the Stool Pigeons Wire. Renewals Welcome, and thank you for subscribing to the Anals of Stock Proctology. Your trial subscription will run for 90 days. At the end of that period your subscription will renew automatically, unless you cancel. If you wish to cancel your subscription use the button below. If you want to renew your subscription do nothing. Your subscription will renew and your credit card or Paypal bank account will be charged. Again, thanks for subscribing!
Explanation of Intraday Commentary-Build charts at http://www.livecharts.com. For custom time bars insert a comma after symbol and number of minutes, e.g. compx,90. This will give you a bar chart of the Nas with 90 minutes per bar. The one day cycle is usually most clear with 8 minute bars and 26/18 stochastics. It varies from day to day. Sometimes 6 minutes works best. Experiment to find the best fit for your trading style, and the market's dominant frequency at the time. The goal here is primarily to monitor the condition of the 8 and 13 day cycles. I typically use 90 minute bars with 26/18 stochastics for the 13 day cycle proxy on the indices during regular trading hours. Other cycles use 26/18 stochastics with the following: 8 days- 60 minute bars On the 24 hour futures charts, use a time per bar approximately 3 to 4 times the above number of minutes, to represent the cycles listed above. ABBREVIATIONS: cma: centered moving average |
|||||||||||||||||||||||||||||||||||||||||||||||||||||||||||||||||||||||||||||||||||||||||||||||||||||||||||||||

![[Most Recent XAU from www.kitco.com]](http://www.weblinks247.com/indexes/idx24_nasdaq_en_2.gif)
![[Most Recent XAU from www.kitco.com]](http://www.weblinks247.com/indexes/idx24_sp500_en_2.gif)
![[Most Recent Quotes from www.kitco.com]](http://kitconet.com/charts/metals/gold/t24_au_en_usoz_2.gif)
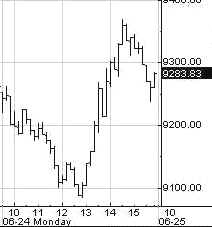
 The
stage managers (or somebody) stepped up to the plate Monday, triggering a
280 point intraday move in the Dow Inflatables. That's a lot of energy
expended for a 28 point net gain on the day. Unlike the Nas and SPX, the
Dow did not approach its September low.
The
stage managers (or somebody) stepped up to the plate Monday, triggering a
280 point intraday move in the Dow Inflatables. That's a lot of energy
expended for a 28 point net gain on the day. Unlike the Nas and SPX, the
Dow did not approach its September low.