|
Archives 12/30/01, 1/1/02, 1/2/02, 1/3/02, 1/4/02, 1/7/02, 1/8/02, 1/09/02, 1/10/02, 1/11/02, 1/14/02, 1/15/02, 1/16/02, 1/17/02, 1/18/02, 1/22/02, 1/23/02, 1/24/02, 1/25/02, 1/28/02, 1/29/02, 1/30/02, 1/31/02, 2/1/02, 2/4/02, 2/5/02, 2/06/02, 2/7/02, 2/9/02, 2/11/02, 2/12/02, 2/13/02, 2/14/02, 2/16/02, 2/19/02, 2/20/02, 2/21/02, 2/23/02, 2/25/02, 2/26/02, 2/27/02, 2/28/02, 3/1/02, 3/04/02, 3/05/02, 3/06/02, 3/7/02, 3/10/02,3/11/02, 3/12/02, 3/13/02, 3/14/02, 3/15/02, 3/18/02, 3/19/02, 3/20/02, 3/21/02, 3/22/02, 3/25/02, 3/26/02, 3/28/02, 3/30/02 4/1/02, 4/2/02, 4/3/02, 4/4/02, 4/6/02, 4/8/02, 4/9/02, 4/10/02, 4/11/02, 4/13/02, 4/15/02, 4/16/02, 4/17/02, 4/18/02, 4/20/02, 4/22/02, 4/23/02,4/24/02,4/25/02, 4/26/02, 4/27/02, 4/29/02, 4/30/02 5/01/02, 5/2/02, 5/4/02, 5/6/02, 5/07/02, 5/8/02, 5/09/02, 5/10/02, 5/13/02, 5/14/02, 5/15/02, 5/16/02, 5/17/02, 5/20/02, 5/21/02, 5/22/02, 5/23/02, 5/24/02, 5/28/02, 5/29/02, 5/30/02 6/01/02, 6/3/02, 6/4/02, 6/5/02, 6/6/02, 6/7/02, 6/10/02, 6/11/02, 6/12/02, 6/13/02, 6/14/02, 6/17/02, 6/18/02, 6/19/02, 6/20/02, 6/22/02, 6/24/02, 6/25/02, 6/26/02, 6/27/02, 6/30/02 7/1/02, 7/4/02, 7/5/02, 7/11/02, 7/14/02, 7/15/02, 7/16/02, 7/17/02, 7/18/02, 7/19/02, 7/22/02, 7/23/02, 7/24/02, 7/25/02, 7/27/02, 7/29/02, 7/30/02 8/1/02, 8/3/02, 8/5/02, 8/6/02, 8/7/02, 8/8/02, 8/10/02, 8/12/02, 8/13/02, 8/14/02, 8/15/02, 8/16/02, 8/19/02, 8/20/02, 8/21/02, 8/22/02, 8/23/02, 8/26/02, 8/27/02, 8/28/02, 8/29/02, 8/30/02 9/3/02, 9/4/02, 9/5/02. 9/6/02, 9/9/02, 9/10/02, 9/11/02, 9/12/02, 9/13/02, 9/16/02, 9/17/02
|
The Anals of Stock ProctologyPublished weeknights by
8:30PM Happy Acres, Florida Time The American Academy of Stock Proctology and Is your subscription up for renewal? If you want to renew, do nothing, unless your credit card has expired. Please be sure your credit card info is current. If your credit card has expired, you must enter the new expiration date in your Paypal account in order for your subscription to be processed. If you subscribed via Paypal, your subscription will be renewed for one year on the 90 day anniversary of your sign-up and your credit card will be charged. If you want to cancel, use the button at the bottom of the page. This applies only if you subscribed through Paypal. Mailed-in subscriptions are for 1 year. If you subscribed by prior contribution, I will send you a notice before your subscription expires. If you have any questions, see the subscription page and FAQ's. If you can't find the answer, email me. Update 9/19/02 12:45 PM Terms and methodology Pretty much according to script in AM, although the lows were a little early. NDX cmap was nailed. Missed the SPX and Nas by 3 points. The current up phase looks like a swup. The 5 hour cycle high could come at any time from 12:30 on, but the 1 day cycle will want to go higher until about 3 PM again. If they can't get past the cmaps posted below, look for the 5-8 day downside cmaps within 1-3 days. The market is beginning to show signs of trending.
Update 9/19/02 9:20 AM Terms and methodology The fucutures are way down this morning. Most of the damage was done immediately after the bell yesterday. Since then it's been mostly a drift. 5 hour and one day cycle lows are due at 10:30 and noon. Whether we get a swup or a jam after than may depend on how much Feed we get. They have to roll over $10.75 billion just to stay even. (Tanks GF!)
Doc does not make trading recommendations. This update reports intraday time cycle estimates and centered moving average projections based on the Hurst cycle analysis method. Doc assumes no responsibility for the accuracy or inaccuracy of these estimates and projections. The market may or may not meet these projections. New stoolies should thoroughly familiarize themselves with the methodology before trading based on this method. There is no free lunch. Those who do not have the time or inclination to develop a trading strategy based on testing and research should not trade. Trade at your own risk. Nobody's Listening (9/18/02) The level of apparent complacency, and the din of the cheerleading, grows ever louder amongst the portfolio sphincters. This brings forth the image of Rome burning while Nero fiddled, or a herd of ostriches with their heads up their, er..., uh... in the sand. Or the Schwab commercial where all the borkers in the boiler room are calling their sheep to buy, buy, except the one guy who forgot momentarily. It's as if they absolutely do not recognize that the secular trend is down. One guy on crapvision tonight went so far as to say that "there are tremendous opportunity costs to staying in cash." Which caused the thought to come to Doc's mind, "Yeah, the opportunity not to lose your shirt." Make no mistake, ladies and germs, these people recognize that the wheels are coming off their insane little way of life, and the look in their eyes belies the spew coming from their lips. It is the look of a deer caught in the headlights. The poor souls don't know what to do except read the same old scripts they've been reading all their professional lives. But nobody's listening any more. The Feed pumped in $2.75 billion in overnight repos, with no expirations. Tomorrow we'll have the normal Thursday expiration of the 28 day repos, in this case $2 billion, along with the $2.75 billion in overnight repos, and $6 billion in 6 day repos. The small addition keeps the Total Feed locked on the center line of the flat trend that began way back in June. It's also remaining below the 10% growth channel and near the lower edge of the 8% growth channel that it's been in this year. Al looks like he's stuck in the mess he made. Three trends are evident on
the Feed Index. One is the 10% growth trend beginning in May of 2001. Feed
growth has recently been at or below the lower boundary of that trend. The
blue channel going back to last December suggests that Al may now be
targeting an 8% growth rate. Then there's the golden box which says he's stopped growing Feed altogether over the last three months. The Feedometer is still in a mild downtrend, indicative of a gradual starvation diet for the markets. It may be dawning on them finally that all that money pumping has gotten them only inflation, and has solved nothing. Now they heave an unstable derivatives market with too low long term rates, CPI creeping up, and the market in the crapper. Nice going Al. Your legacy is complete. The
Feedometer theoretically
measures excess Feed available for bond or stock market jamming. The Mortgage Bonkers Ass. released their mortgage application index for last week. They were down, but that probably had as much to do with the overstatement the week before week from their lousy holiday week seasonal adjustment factor. The trend is still up. Considering the drop to record low interest rates, the only surprise is that last week was not up stronger. Doc has been expecting this enormous bulge in mortgage apps which began in July to begin showing up as massive increases in the broad money supply data. We'll get the weekly money supply figures from the Fed tomorrow. Given the immense rate of broad
money growth over the last year and a half. Today's announced uptick in
CPI should come as no surprise. It will only get worse. Most of the action was again in
the refi area. Purchase applications are still in an uptrend but have also
been making lower highs for three months. What next for the bubble?
Clearly, it's not over yet, but we'll keep an eye on it. A breakdown in
the purchase app trend should be the signal that the end is nigh. The other thing to watch is of
course, is bond yields. The 10 year yield hit the long term cmap range of
3.70-3.80. Now all that's needed is a turn confirmed by the
indicators.
All of Doc's
cycle charts
are powered by METASTOCK Portfolio Sphincters Index (SPX) and Sentiment The late day weakness brought the SPX to a close dead on the linear regression line from the August high. The 17 day rate of change is still downtrending, while the 29 day rate of change indicator for the 10-13 week cycle is building a top. (Somebody please tell him he's late.) One more downtick in that indicator will mean a sustained tumble is likely. However, it's still possible that a low in the 6-7 week cycle any day now could lead to a little pop. Unless of course, the low was at the beginning of the month. We'll know, if there's no bounce. The superimposed 6-7 week cycle oscillator dropped below the level of the September low, but held today. This is the lowest level this indicator has reached in this bear market, a sign that momentum is getting worse over time. The 10-13 week cycle oscillator continues to plunge. It should be 3 to 6 weeks before a 10-13 week low. Any bounces would be within the context of this cycle's down phase. The VIX fell to 40.89.
It is still in neutral territory in terms of the 6 month cycle Stool band.
A reading near 60, and possibly a good deal higher, is likely before
the next 10-13 week cycle low. The short cycle oscillator is finally topping out, again a little late, which is a sign of a weak longer term trend. However, don't panic if the indicator turns up here. It would simply mean a continuation of the swup-top in shorter cycles. Looking at the shorter waves on the price chart is making Doc wonder if the 6-7 week cycle low might not have been back at the beginning of the month. If it was, you can bet on a horrific plunge over the next 3-4 weeks as this cycle gets in gear with the down phase of the 10-13 week cycle. Doc is talking about the kind of thing that takes out the lows with a 40-50 point gap and go. How will we know? A failure to have a significant rally starting in the next 3 days would be a good start toward that end. The 10-13 week cycle oscillator is still in a top. This gives the market a lot of room to drop from here. The slope of the 6 and 10-12 month cycles up phase is slightly down. If this is the best they can do in a major cycle up phase like that, we are in for one helluva collapse over the next 4 months, much worse than anyone but the bear lunatic fringe even imagines. First we'll get the obligatory bounce from the retest. Then look out.
Fiber Nacho Dump- Support levels and downside targets.
Fiber Nacho Reflux- Resistance levels and upside targets The Cycle Conditions tables include cycle phase and a wild guess as to number of periods to the next turn, in days for the shortest cycles, weeks (W) or months (M) for the longer ones. This is a fluid exercise, in other words, the projections are likely to be wrong, but they force us to be vigilant for key turning points, and frequently work well enough to prevent costly misreadings. SPX Cycle Conditions as of 9/18/02
PTT - Periods Till Turn Nasgap Charts The Nas closed smack dab on the level of the early September low. The 29 day rate of change is still stuck in neutral. If it gets in gear with the declining 17 day rate of change, look for a move to 1200 pdq. The 10-13 week cycle is in a down phase that should last 3-6 weeks, plenty of time to do a helluva lot of damage under the right conditions. The 6 month
cycle indicator looks like it's topping out. Very late, but consider that
it was late at the top of the cycle in the summer, and the Nas dropped 500
points from the point of the signal. This is a similar situation, with the
slope of the "up" phase having only been flat just like it was last
May. The 4 week cycle has turned down. The 6-7 week cycle at first glance looks to be
within 4 days of a low, but could drop like a stone during that time. But
again, Doc is wondering if the low might not have been at the beginning of
the month, which would make the current action part of a top. The key to
this kind of ambiguity is to try to recognize its resolution as early as
possible, then take advantage of that. The next few days should tell. No
bounce from here, with a weak bounce from near the 1200 level would seal
the market's doom.
Fiber Nacho Dump- Support levels and downside targets.
Fiber Nacho Reflux- Resistance levels and upside targets Nasdaq Cycle Conditions as of 9/17/02
PTT
- Periods Till Turn AM Edition Features (Previous) These features are in morning edition, published around 9 AM ET US, or the Saturday Weak End Edition, published, uh, let's see, Saturday! Golden Stool The 13 day
cycle down phase and 6-7 week cycle sideways down phase continue. The cmap
is 126. There are signs Uncle Buck's Illness Buck got out of bed and
chased the nurse around the room a couple times in the last few days, and
now looks ready to collapse. Down 30 ticks overnight. Aerospace- Not gonna fly. Bonkers- Still topping out. Consumer- Top breakdown
coming. Drugs- Ditto Biodrech- Swupping while 6
month cycle tops out. Retail- 10-13 week and
shorter cycles topping Energy- Watch gauge up for
major infartion point as index drops. Trannies- Bottom dropping
ahead. Small craps- 10-13 week
topping followed by bottom dropping. Dirty SOX- Some short
cycles want to hold, but 6 month top is under way. Soft Where- Completion of
swup leads to big bottom dropping. Nutworkers- Long term
support broken. Bottom dropping into the abyss. Telecommies- Another new
low ahead. Stoolwethers Citicorpse-Call the
embalmer. 700 Story Derivatives Tower
©Windysrf- Tower collapsing. Fatass- Big turd dropped
then bounce, then stinker sinks. General Custer- makes last
stand General McClellan- Still
north of Potomac Wally- All mixed up. no
place to go. PiG- Lipstick has worn off.
Boyfriend will drop her. Market Maker Management-
Trying to keep up appearances. Amazin'- Bulls still runnin' AhOL- Stays stuck in range
as bottom pickers pile in. Mr. Bill- Swupping before
retest. Tell- Swup almost complete. Farmer In or Out- Still in.
Out soon. Crisco- Skidding to 11. BM- Bounces after bottom
dropping. See you in Intraday Stool. Dr. Stepan N. Stool Share your thoughts on the Stool Pigeons Wire.
Renewals Welcome, and thank you for subscribing to the Anals of Stock Proctology. Your trial subscription will run for 90 days. At the end of that period your subscription will renew automatically, unless you cancel. If you wish to cancel your subscription use the button below. If you want to renew your subscription do nothing. Your subscription will renew and your credit card or Paypal bank account will be charged. If you want to renew, be sure your credit card information in your Paypal account is current. Paypal will not renew your subscription if the card has expired! Again, thanks for subscribing!
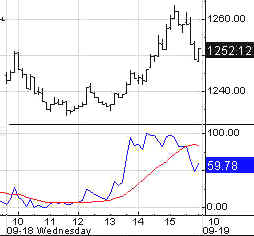
Explanation of Intraday Commentary-Build charts at http://www.livecharts.com. For custom time bars insert a comma after symbol and number of minutes, e.g. compx,90. This will give you a bar chart of the Nas with 90 minutes per bar. The one day cycle is usually most clear with 8 minute bars and 26/18 stochastics. It varies from day to day. Sometimes 6 minutes works best. Experiment to find the best fit for your trading style, and the market's dominant frequency at the time. The goal here is primarily to monitor the condition of the 8 and 13 day cycles. I typically use 90 minute bars with 26/18 stochastics for the 13 day cycle proxy on the indices during regular trading hours. Other cycles use 26/18 stochastics with the following: 8 days- 60 minute bars On the 24 hour futures charts, use a time per bar approximately 3 to 4 times the above number of minutes, to represent the cycles listed above. ABBREVIATIONS: cma: centered moving average
|
|||||||||||||||||||||||||||||||||||||||||||||||||||||||||||||||||||||||||||||||||||||||||||||||||||||||||||||||||||||


![[Most Recent HUI from www.kitco.com]](http://www.weblinks247.com/indexes/idx24_hui_en_2.gif)
![[Most Recent XAU from www.kitco.com]](http://www.weblinks247.com/indexes/idx24_sp500_en_2.gif)
![[Most Recent Quotes from www.kitco.com]](http://kitconet.com/charts/metals/gold/t24_au_en_usoz_2.gif)