|
Archives 12/30/01, 1/1/02, 1/2/02, 1/3/02, 1/4/02, 1/7/02, 1/8/02, 1/09/02, 1/10/02, 1/11/02, 1/14/02, 1/15/02, 1/16/02, 1/17/02, 1/18/02, 1/22/02, 1/23/02, 1/24/02, 1/25/02, 1/28/02, 1/29/02, 1/30/02, 1/31/02, 2/1/02, 2/4/02, 2/5/02, 2/06/02, 2/7/02, 2/9/02, 2/11/02, 2/12/02, 2/13/02, 2/14/02, 2/16/02, 2/19/02, 2/20/02, 2/21/02, 2/23/02, 2/25/02, 2/26/02, 2/27/02, 2/28/02, 3/1/02, 3/04/02, 3/05/02, 3/06/02, 3/7/02, 3/10/02,3/11/02, 3/12/02, 3/13/02, 3/14/02, 3/15/02, 3/18/02, 3/19/02, 3/20/02, 3/21/02, 3/22/02, 3/25/02, 3/26/02, 3/28/02, 3/30/02 4/1/02, 4/2/02, 4/3/02, 4/4/02, 4/6/02, 4/8/02, 4/9/02, 4/10/02, 4/11/02, 4/13/02, 4/15/02, 4/16/02, 4/17/02, 4/18/02, 4/20/02, 4/22/02, 4/23/02,4/24/02,4/25/02, 4/26/02, 4/27/02, 4/29/02, 4/30/02 5/01/02, 5/2/02, 5/4/02, 5/6/02, 5/07/02, 5/8/02, 5/09/02, 5/10/02, 5/13/02, 5/14/02, 5/15/02, 5/16/02, 5/17/02, 5/20/02, 5/21/02, 5/22/02, 5/23/02, 5/24/02, 5/28/02, 5/29/02, 5/30/02 6/01/02, 6/3/02, 6/4/02, 6/5/02, 6/6/02, 6/7/02, 6/10/02, 6/11/02, 6/12/02, 6/13/02, 6/14/02, 6/17/02, 6/18/02, 6/19/02, 6/20/02, 6/22/02, 6/24/02, 6/25/02, 6/26/02, 6/27/02, 6/30/02 7/1/02, 7/4/02, 7/5/02, 7/11/02, 7/14/02, 7/15/02, 7/16/02, 7/17/02, 7/18/02, 7/19/02, 7/22/02, 7/23/02, 7/24/02, 7/25/02, 7/27/02, 7/29/02, 7/30/02 8/1/02, 8/3/02, 8/5/02, 8/6/02
|
The Anals of Stock ProctologyPublished weeknights by
8:30PM Happy Acres, Florida Time The American Academy of Stock Proctology and Is your subscription up for renewal? If you want to renew, do nothing, unless your credit card has expired. Please be sure your credit card info is current. If your credit card has expired, you must enter the new expiration date in your Paypal account in order for your subscription to be processed. If you subscribed via Paypal, your subscription will be renewed for one year on the 90 day anniversary of your sign-up and your credit card will be charged. If you want to cancel, use the button at the bottom of the page. This applies only if you subscribed through Paypal. Mailed-in subscriptions are for 1 year. If you subscribed by prior contribution, I will send you a notice before your subscription expires. If you have any questions, see the subscription page and FAQ's. If you can't find the answer, email me. PM Update 8/8/02 12:45 PM Terms and methodology Doc is amazed as the next guy, but after that selloff on the open, the SPX actually turned around and hit the AM cmaps, and the Nasty looks like it will get close although the cmaps for the intraday cycles have adjusted down for the Nas. Originally the 8 day cycle high looked like it would come Friday, but with longer cycles starting to slope upward, the window for the high looks later, perhaps as late as Tuesday. We should assume an upward bias. Seems many of you are anxious to get short again. Doc sees no point in that. Take a vacation instead. Doc is having a miserable time filtering the intraday cycles. What worked on the last go round seems never to repeat lately. The price targets are more important. Lately a 9-10 hour cycle and the 3 hour wavelet seem to be working. They are best seen with the 26/18 stos, on 4 minute bars and 10 minute bars. As always you want to keep an eye on the 6 and 8 minute bars for the 5 hour and 1 day cycles, and now in particular, the 60 minute bars for the 8 day cycle. As long as that stays positive, you are going to have a tough time extracting profit from the short side. I'm looking at a possible 3 hour and 9 hour high developing right now. Keep in mind the enormous drain of Feed today, and those huge Treasury auctions. Liquidity is everything, and it would be a miracle if the Gang and everyone else aren't tapped out and needing to raise a little cash. So maybe we'll get some weakness this afternoon. The 5 hour- 1 Day cycle timings and cmaps below are actually derived form the observed 9 hour wave. No guarantees they'll repeat, but it's the best we can go on right now. Beware also a slim possibility that the market could start trending up. That is typical in the early stages of a 6 month cycle up phase. It's less likely today because of the big Feed draining operation, but you never know. Don't fight the tape! Doc does not make trading recommendations. This update reports intraday time cycle estimates and centered moving average projections based on the Hurst cycle analysis method. Doc assumes no responsibility for the accuracy or inaccuracy of these estimates and projections. The market may or may not meet these projections. New stoolies should thoroughly familiarize themselves with the methodology before trading based on this method. There is no free lunch. Those who do not have the time or inclination to develop a trading strategy based on testing and research should not trade. Trade at your own risk.
AM Update 8/8/02 9:15 AM Terms and methodology Upside cmaps consider both yesterday's close as well as the fucutures. Hence the ranges. The 1 day cycle high should be early, but I'd rather focus on the price targets, with all the wildness lately. The 5 day cycle is in the process of topping out, but there are slightly higher cmaps on the 8 day cycle high due tomorrow. 8 day cycle ozzies on the futures are starting to get toppy. The top could come today instead of tomorrow, but I wouldn't short without clear signs of reversal. Shorting is risky with longer cycles turning up, but if you can catch the top of the channel, with protection above, it's possible to scalp. Doc prefers vacation to that kind of trading.
It's AL-I-I-I-VE!!! (8/7/02) In the really big news today, CIBC World Markets chief strat-ego-ist Sobad Kumar lowered his year end target on the Sphincters Index to 1250. Now let's see here, 1250, that's a gain of roughly 42% in five months. And they say there's too much pessimism. In the financial sector, FleetEnema Financial (FBF) rose 1.1% after the banking and market making giant dismissed speculation about a possible merger with a U.S. rival as well as concerns about its liquidity and Latin America exposure. Read full story. While this story includes the usual nonsense about officers claiming everything is fine, and the the obligatory listing of all their problems, it also included this asstounding statement. "Despite its recent troubles, the bank is still highly coveted because of its New England banking network and its lucrative FleetSpecialists stock trading business." Ha! Ha! Make me laugh. I wonder if Fleet breaks out the operating results for the "lucrative FleetSpecialists stock trading business." It certainly would be interesting to see just how lucrative it's been after the pummeling they took in ENE, WMB, and a host of others. There is no way they could have been short enough stock to absorb that kind of pounding day after day. Doc continues to believe they had to eat it. And, in spite of the belief of most stoolies, the recent volatility, both up and down, probably hasn't been a picnic for them either. We'll take a look at their chart in the morning. Meanwhile, the massive pressure continues to build in the GSE mortgage bubble reflatulation that Doc has been worried about. This is not the same as a direct jam from the Feed, but it certainly has the potential to set off another wild boom similar to the one we saw in the fourth quarter. There is simply too much liquidity building to risk being heavily short anything until we see definitive signs that whatever is going on has been exhausted. The extreme volatility, and midnight raid reversals with little or no warning, present too much uncertainly to trade with confidence. If you must trade, try to keep it to a snack, rather than a full meal, until the rocking and rolling slows some. There may be more upside surprises looming. At the same time, the atmosphere is getting more constructive for gold and gold stocks, and the charts are beginning to reflect that. The
Feed added $5.25 Billion in overnight repos. There were no
expirations. This will expire tomorrow along with $2.5 billion in two day repos,
and $5.25 Billion in 3 day repos, for a total of $13 billion. Most
of these funds were added to help absorb the new Treasury Notes issued
Tuesday and Wednesday. It will be interesting to see if Al let's this
excess drain off. It's pretty clear that they did not pump this time
the way they did before the last big Treasury refunding in June. Doc
continues to suspect that they are nervously watching the explosion in the
mortgage market again, and fearing the after effects of the real estate
not-a-bubble. Al has created a monstuh, and he doesn't quite know what to
do about it. The Feedometer theoretically
measures the excess Feed available to the Gang of 22 to jam the markets.
We see the uptick in the last few days, but it wasn't enough to turn the
slow Feedometer, and unless they come with a huge Feed on Thursday, it
will probably continue to head lower. The mortgage
bubble monster has risen from the grave and is expanding fast. The same
kind of bulge was a major factor in the stock market rally in the fourth
quarter. That was also accompanied by massive Feed jamming, a condition
which isn't present so far this time. Doc didn't think they could do it, but lower mortgage rates have done the trick, bringing refi applicants out of the woodwork like so many millions of cockroaches scurrying out from under the floorboards. Doc suspects that the quality of the credit is on the same level. This will reliquefy the system for awhile, and drive explosive growth in M3 and MZM in the next couple of months. More drugs for the terminally ill addict. Some of the liquidity will seep into the stock market. M1 should also start to perk up, along with the economic data. We should start to see strong intermediate sell signals in bonds, with rising yields. Inflationary fears will again come to the fore. The price of gold and gold stocks will explode higher, and we could see a sympathetic move in energy stocks as inflationary expectations build. Financial stocks should get killed as rates begin rising again down the road. Anyway, that's
the theory. We'll let the market speak, read the charts, and see if the
theory plays out.
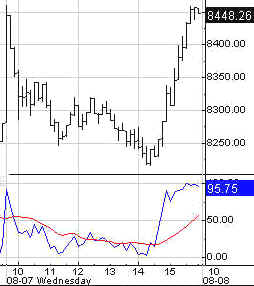
Portfolio Sphincters Index (SPX) and Sentiment
The cycle indicators suggest that the SPX is in an up phase in the 10-13 and 6-7 week cycle. Doc at first thought it would be sideways, but now isn't so sure. The cmap on the 6 month cycle low moved up to 790, and that was already hit. The 6 month cycle indicator is a hair away from confirming a turn. It is all but certain that the 6 month cycle has bottomed. That doesn't guarantee an up market in absolute terms, but the risk is definitely to the upside, and the trend should be no less than flat. The VIX fell to 43.07. In retrospect, the late July spike is also looking like a good low for the 6 month cycle. The 17 and 29 day rate of
change indicators which represent the 6-7 and 10-13 week cycles are also
turning more positive. The indicators still need to rise above last week's
peak to signal a more positive slope in the up phase. One more up day is
all it will take. For now, preliminary upside cmaps
suggest a high of 920 in the next couple of weeks, and maybe 950 a few
weeks after that. Let's worry about the first targets first. The
probability is growing that the market will have an upward
bias for the next month or two. The 6 month cycle oscillator still has not confirmed a bottom, but it is close. The trading stoolicator, looks "bottomish". Any more upturn will turn it in a positive direction. Positive is the opposite of down, in other words, not bearish, ahh, you get the picture. Doc can't say the word. Further rises in this indicator should be taken
seriously, should they come about. While an upturn doesn't
guarantee a big rally, trading the short side against it would be swimming
uphill. The short cycle oscillator looks like it's topping out but in the
initial stage of the 6 month cycle up phase, it can stay up at these
levels for days. Don't let the overbought position give you false hope
here. It's just another not-bearish sign. The entire 870 to 885 area is
a fiber nacho reflux zone. The Cycle Conditions tables include cycle phase and a wild guess as to number of periods to the next turn, in days for the shortest cycles, weeks (W) or months (M) for the longer ones. This is a fluid exercise, in other words, the projections are likely to be wrong, but they force us to be vigilant for key turning points, and frequently work well enough to prevent costly misreadings. SPX Cycle Conditions as of 8/7/02
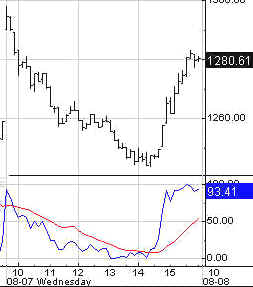
PTT - Periods Till Turn Nasgap Charts The 9 day double bottom is looking more formidable. We are hearing claims that the bottom, at long last, is finally in. It's not the bottom, but it sure looks like a 6 month cycle low may be in. For now, it appears the up phase will develop into a trading range with a high of 1375. The 10-13 week cycle oscillator says the Nas is in a swup. The oscillator is strengthening. This could last for weeks. I'd wait for the ozzies to move up more, or for some sign they were weakening, before shorting
It's still heavy sledding at 1285 and above. A 61.8% retracement of last
week's
selloff is just below 1300. Nasdaq Cycle Conditions as of 8/7/02
PTT
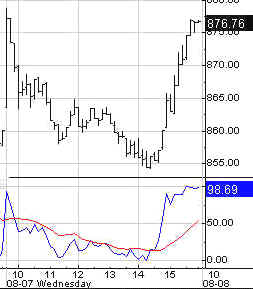
- Periods Till Turn Golden Stool The 13 day
cycle cmap on HUI is now 124. That cycle is nearing a peak, but the
4 and 6-7 week cycles are headed up. The 6 month cycle low
projection was 90-95. The 10-13 week cycle low projection was 100. The 10-13 week cycle ozzie is signaling that the low is in,
and other indicators are beginning to confirm. The 10-12 month cycle oscillator
can be expected to lag the price turn. We want to see it begin to flatten in the area of
the zero line then gradually turn up. The higher the level of the trough
in that indicator, the more bullish the implications. AM Edition Features (Previous) These features are in morning edition, published around 9 AM ET US, or the Saturday Weak End Edition, published, uh, let's see, Saturday! The bond yield chart,
interestingly, is, so far, not supporting the stock market's rally. Stock
prices and bond yields have invariably moved together in recent years. The
indicators suggest that yields should start turning up, in concert with
stock prices. Hasn't happened yet. Maybe today. They gapped open at 4.40. Uncle Buck's Illness Uncle Buck
first sold off overnight, then the midnight marauders showed up driving
Buck up to 108.50 from 107.70. It's testing the top of the channel again
along with longer term resistance. The reverse head and shoulders
breakout implies a move to 112. Aerospace -
Forming a reverse head and shoulders as it rebounds off the long term channel
band.. Biodrech-
The difference here is that while the intermediate cycles are positive and
the 1 year cycle is forming a bottom, the long term channel is down. Binkers-
Long term is down but intermediate trend should develop a range with
possible upward bias. Con-sumer-
Intermediate cycles more positive than banks. Drugs have
reached a key resistance trend level. The appear poised to head for the
upper edge of the long term channel around 330-35. Retailers
appear poised to break this downtrend. Homebubblers-
Signs this group should start rising from the intermediate trough. Small craps
will stop dropping for a few months. Energy- If
Doc's theory is correct, asset plays are the way to play it. The chart
looks promising for an intermediate rally. A caveat is that the
chart of energy prices themselves doesn't look so hot. So we'll see. Trannies-
The up phase should take the form of a trading range. Tech- Still
a wreck, but dangerous for a pop off the bottom of long term channels.
Here are the main groups. SOX- Soft-where Internut- Nutworkers-
Careful here. XTC-
Telecoms, aka X Telecoms- There is no afterlife after all. Fleet Enema
Financial- Here's that look Doc promised last night. Ugly, but ready for a
pause as shorts cover. Wally is
setting up shop between 47 and 50. Mr. Bill
will try to bull his way back to 50. Make My
Market- What is it that cow says on the Ameritrade commercial? IBM at an
infartion point. General
Custer is no longer imelting. Headed for a test of the recent high. Then
we'll see. Could get back to 35-36. Fannie will
frustrate the bears as the champagne bubble machine blows again. Crisco's a
nogo. See you in Intraday Stool. Dr. Stepan N. Stool Share your thoughts on the Stool Pigeons Wire.
Renewals Welcome, and thank you for subscribing to the Anals of Stock Proctology. Your trial subscription will run for 90 days. At the end of that period your subscription will renew automatically, unless you cancel. If you wish to cancel your subscription use the button below. If you want to renew your subscription do nothing. Your subscription will renew and your credit card or Paypal bank account will be charged. If you want to renew, be sure your credit card information in your Paypal account is current. Paypal will not renew your subscription if the card has expired! Again, thanks for subscribing!
Explanation of Intraday Commentary-Build charts at http://www.livecharts.com. For custom time bars insert a comma after symbol and number of minutes, e.g. compx,90. This will give you a bar chart of the Nas with 90 minutes per bar. The one day cycle is usually most clear with 8 minute bars and 26/18 stochastics. It varies from day to day. Sometimes 6 minutes works best. Experiment to find the best fit for your trading style, and the market's dominant frequency at the time. The goal here is primarily to monitor the condition of the 8 and 13 day cycles. I typically use 90 minute bars with 26/18 stochastics for the 13 day cycle proxy on the indices during regular trading hours. Other cycles use 26/18 stochastics with the following: 8 days- 60 minute bars On the 24 hour futures charts, use a time per bar approximately 3 to 4 times the above number of minutes, to represent the cycles listed above. ABBREVIATIONS: cma: centered moving average |
||||||||||||||||||||||||||||||||||||||||||||||||||||||||||||||||||||||||||||||||||||||||||||||||||||||||||||||||||||||

![[Most Recent HUI from www.kitco.com]](http://www.weblinks247.com/indexes/idx24_hui_en_2.gif)
![[Most Recent XAU from www.kitco.com]](http://www.weblinks247.com/indexes/idx24_sp500_en_2.gif)
![[Most Recent Quotes from www.kitco.com]](http://kitconet.com/charts/metals/gold/t24_au_en_usoz_2.gif)