|
10 Minute Bar Charts 6/21/02 Dow Jokes Inflatables
Archives 12/30/01, 1/1/02, 1/2/02, 1/3/02, 1/4/02, 1/7/02, 1/8/02, 1/09/02, 1/10/02, 1/11/02, 1/14/02, 1/15/02, 1/16/02, 1/17/02, 1/18/02, 1/22/02, 1/23/02, 1/24/02, 1/25/02, 1/28/02, 1/29/02, 1/30/02, 1/31/02, 2/1/02, 2/4/02, 2/5/02, 2/06/02, 2/7/02, 2/9/02, 2/11/02, 2/12/02, 2/13/02, 2/14/02, 2/16/02, 2/19/02, 2/20/02, 2/21/02, 2/23/02, 2/25/02, 2/26/02, 2/27/02, 2/28/02, 3/1/02, 3/04/02, 3/05/02, 3/06/02, 3/7/02, 3/10/02,3/11/02, 3/12/02, 3/13/02, 3/14/02, 3/15/02, 3/18/02, 3/19/02, 3/20/02, 3/21/02, 3/22/02, 3/25/02, 3/26/02, 3/28/02, 3/30/02 4/1/02, 4/2/02, 4/3/02, 4/4/02, 4/6/02, 4/8/02, 4/9/02, 4/10/02, 4/11/02, 4/13/02, 4/15/02, 4/16/02, 4/17/02, 4/18/02, 4/20/02, 4/22/02, 4/23/02,4/24/02,4/25/02, 4/26/02, 4/27/02, 4/29/02, 4/30/02 5/01/02, 5/2/02, 5/4/02, 5/6/02, 5/07/02, 5/8/02, 5/09/02, 5/10/02, 5/13/02, 5/14/02, 5/15/02, 5/16/02, 5/17/02, 5/20/02, 5/21/02, 5/22/02, 5/23/02, 5/24/02, 5/28/02, 5/29/02, 5/30/02 6/01/02, 6/3/02, 6/4/02, 6/5/02, 6/6/02, 6/7/02, 6/10/02, 6/11/02, 6/12/02, 6/13/02, 6/14/02, 6/17/02, 6/18/02, 6/19/02, 6/20/02
|
The Anals of Stock ProctologyPublished weeknights by
8:30PM Happy Acres, Florida Time The American Academy of Stock Proctology and Dr. Stool will be traveling from June 29 to July 14. The Anals will not be regular during that time. An abbreviated version of the nightly commentary may be published, when internet access is available. Doc will post a message on the Stool Pigeons Wire on days the Anals will be published. Intraday updates will not be published. (Last time Doc took a vacation, the market bottomed.) PM Update 6/24/02 1 PM Terms and methodology The market busted through the AM cmaps again, and were in range of the 8 day cmaps from this morning, but it looks like they are no pointing even lower. The market is trending smoothly. Intraday cyclicality and projections are now a non-issue. A sideways up phase looks like it's due to begin now (1 PM), but it shouldn't amount to much. Stay focused on the big picture. We will interrupt regular programming on breaking cycle news. Doc does not make trading recommendations. This update reports intraday time cycle estimates and centered moving average projections based on the Hurst cycle analysis method. Doc assumes no responsibility for the accuracy or inaccuracy of these estimates and projections. The market may or may not meet these projections. New stoolies should thoroughly familiarize themselves with the methodology before trading based on this method. There is no free lunch. Those who do not have the time or inclination to develop a trading strategy based on testing and research should not trade. Trade at your own risk. On the other hand, if you made any extra this week on account of The Stool, send it in!
AM Update 6/24/02 9 AM Terms and methodology Today's intraday cycle picture is so murky, it's almost not worth a guess. In the last couple of days we've seen a 3 hour cycle, a 5 hour cycle, and something that looks like 8 hours. The market is touching all the fiber nacho time counts. The most common cycle is 5 hours, so if you are working probabilities, then 11:30 is the best bet for an AM low. More important is the fact that the market is appears to be trending, making the intraday wavelets less important in the scheme of things. Doc thinks we should be focused on the longer term projections at this point.
Going Vertical (6/22/02) The market is in the final weeks of the first major bear market within the twenty year secular bear. The lows should be reached in late July or August, with a possible retest or lower low in October-November. Shorts should be covered at the July-August low, and possibly reloaded on a rally. We'll see when we get there. Whether the forecast October-November low will be the low of this bear cycle remains to be seen. The rally to follow could be humongous, but it will be a secular bear market rally, in any case. In the final stages of the current decline, the market should go vertical, plunging to levels that no one but we stoolies and other hardcore "crackpot" bears would have believed possible. We are looking at, at least the low 900 area on the SPX, and 1100 to 1200 on the Nasdaq. This is the beginning of the real capitulation phase, the one from which no one of this generation will return. It will, once and for all, crush the long term bulls. It's going to last three to six weeks, and will be followed by another cleanout in the fall. The financial and psychological damage to our economic system will be profound. It is the inevitable fruit of the seeds of destruction that were planted in this credit bubble years ago. The 1929-32 bear market saw the Dow lose 90% of its value in 35 months. On March 24 of 2000, the Nasdaq 100 index hit 4816, the greatest institutional capital bubble in world history. Today, 27 months later, the Nasdaq 100 stands at 1035, a loss of 80%. In January 1932- 27 months after the market's peak in August 1929, the Dow had lost 80% of it's value. This market is well on it's way to being the worst bear market in history, as befits the bubble that engendered it. The Feed
did $2 billion in weekend repos, Friday. That's an add, as nothing was
expiring. But it was surprisingly small, in view of what's going on in
the stock market. The total Feed is still at the trend
level which has triggered furious pumping in the last 15 months, but
this time, the market is melting down and Al is still sitting on his
hands. Might be because Uncle Buck has Al's hands tied behind his back. It
will be interesting to see how The Fed responds to this unfolding crisis. The Slow Feedometer, which is the
17 day average of the daily excess Feed available to jam the market,
downticked again, signaling that Al has taken his foot off the
accelerator. The last time he did, the SPX dropped 80 points in 8 weeks.
This time it has a head start and a full head of steam. It's hard to
imagine that they won't immediately step on the gas again to support stock
prices, but they have a much bigger problem with the crashing dollar, and
a potential tidal wave of capital flowing out of the US.
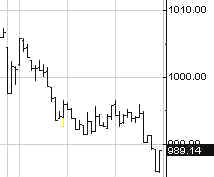
Portfolio Sphincters Index (SPX) and Sentiment The Sphincters Index is now in triple digits, at 989, after shedding 17 points. The 17 day rate of change, which represents the 6-7 week cycle, is slowly declining. The 6-7 week oscillator superimposed on the price chart, is still heading up. It's late and out of phase because the up phase was so short and weak. Like Doc always says, "If this is the up phase, I can't wait to see the down." The 10-13 week cycle oscillator (navy) represents the governing cycle as it sinks. The 29 day rate of change is still in a flat pattern in negative territory, indicating a stable downtrend. A downside breakout breakout accompanying downward acceleration would mark the final phase of the decline. The VIX actually fell Friday, to 31.28. On the inverted scale chart, as the Stool bands trend lower, VIX has begun to moderate toward the center of the channel. This can go on for weeks. Extreme fear will persist for several days at a 10-12 month cycle low. A buy signal will not be generated until the index drops below the blue band for several days and then reverses. The final extremes at the bottom could be as low, or lower, than the levels reached in September. In another words, it does not pay to anticipate. MaxVIX will not be recognizable until after the turn. The blue channel lines are the extension of a linear
regression channel from the February and May 2001 highs. The 6 month cycle
oscillator looks to be headed down again after a pause of several weeks. A
flat trend at this level signifies a stable downtrend. The trading
stoolicator shows that the key trading cycle is steadily weakening. The short cycle oscillator
is beginning a downturn. The 10-13 week cycle oscillator is trending
gradually lower. The centered moving average projections are beginning to
ratchet down and now point to 925. Once they cut through the June low like a knife
through butter, the next stop is 950. This chart shows two possible extrapolations of
the long term secular trend channel. If this isn't the bottom, and it
isn't, then it would appear the SPX is headed for a break below 900 within
4-8 weeks. That should be the 10-12 month cycle low, and the point at
which all shorts should be covered. The Cycle Conditions tables include cycle phase and a wild guess as to number of periods to the next turn, in days for the shortest cycles, weeks (W) or months (M) for the longer ones. This is a fluid exercise, in other words, the projections are likely to be wrong, but they force us to be vigilant for key turning points, and frequently work well enough to prevent costly misreadings. SPX Cycle Conditions as of 6/21/02
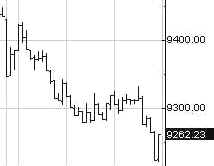
PTT - Periods Till Turn Nasgap Charts The Nasgap
shaved another 24 points to close at 1440. The 6 month
cycle time series is drifting lower. The 10-13 week cycle
oscillator and the trading stoolicator are also slowly declining. This can
get a lot worse. The
computer projections cannot keep up with the rate of downward acceleration
on the Nascrap 100. Headed for triple digits this week, this index was
over 4700 in March of 2000. When Doc says this is the greatest bear market
in history, it's within reason. Keep in mind the losses would be even
worse, if the index hadn't been rebalanced, and if the stocks that had
gone to zero weren't replaced. 1439 is
the last fibo number before the September low. Notice where Friday's
selloff stopped. It will probably be gapped on Monday. The Nas
has broken an 8 year trendline. It's headed for 1000. Nasdaq Cycle Conditions as of 6/21/02
PTT
- Periods Till Turn AM Edition Features (Previous) If the long term chart can
be believed, bond yields are headed toward record lows over the long haul.
OK. It can't be believed. The daily chart is at an
infection point. Major resistance levels (Upside down chart) and
cyclicality suggest yields should bottom here. Indicators are in position
to signal a turn but there are no signals yet. Let's blow through a few key long term sector charts. Will the Dirty Sox get a temporary bounce off the level of the September low? Do you believe in miracles?
The poodits
have been saying for the last two years that you have to buy and hold for
the long term, 3-5 years. Art Smokin' Hogan came on Crapvision the other
day, and when pointedly asked about that said, "Oh No, long term
means twenty years, not 3-5 years." His face was twitching
uncontrollably as he said it. Anybody who bought software stocks 3-5
years ago is under water, drowned in fact. The Street
says the Retail stocks are in a bull market, and that's where people
should be. Yeah...Right... Looks like a mammoth distribution to this
observer. Let's see how it handles sitting at trend support. Soon to
become resistance! The Street
has also been telling us about the bull market in small craps. Which leads
Doc to this question: What the hell are they talking about? It's a
cyclical market, headed for a whopper of a cyclical downer. And it's just
getting started. Ditto for
the midcaps, which are about to turn the secular trend channel flat. Wall Street
loves HMO's. I warned last week that this group is bad news because
consumers hate HMO's, and HMO's make strange bedfellows with politics. The
Supremes came on record this week singing that states can sue the HMO's on
behalf of patients. Stock prices may have nothing to do with the economy,
but they have everything to do with perception. There are news headlines
in the HMO's future. And they won't be good ones. Just look at that nifty
double top. Back in 2000
when the tech rout got started, the Street went on drugs. The big rally in
drugs in 2000 coincides exactly with the first selloff in tech. This is a
great example of how rotation works in a bear market. Go back and read the
market news recaps from that period. I mean how stupid and unredeemable
are these people? Consumer
stocks are the Street's latest hiding place. The roster of shelters is
rapidly growing shorter. If you want
a stock to represent the consumer sector, then Wally is it. If this were a
bull market you might say, gee, this looks like a good entry area. But
something makes you suspicious. Maybe it's that big smelly old bear.
Ultimately, Wally may be the last man standing, but the next couple weeks
could be ugly. If it has
anything to do with monopolies, courts and lawsuits, it has only one way
to go. Down. A lot of institutional money is parked here. Boy will they be
sorry when this thing breaks 50. What does
MMM stand for? Market Maker Management. The heaviest of the Dow
heavyweights is the pipsqueak that roars on a daily basis. The wave that
supported the entire Dow is about to roll over. Another Dow
heavyweight is Procto and Gamble. You gotta wonder where the Dow would be
if it weren't for these two, or better if it were a cap weighted average.
They can't do that though. Might look too much like the real market. They
need the Dow as a diversion. Anyway, this uptrend looks over, too. IBM has established
a nice secular downtrend channel that gives us an idea where the low of
this move might be. Mid 50's, but a holding action first at 65. GE, the
greatest buy and hold stock in the history of the world, is a loser for
anyone who bought in the last 3 years. 25-24 looks inevitable in this
phase. Stoolie
larry cud low suggested a long term look at MHK. Mohawk Industries. WOW!
That was some move. It could get down to 58-60 in the short run, but with
this much mo behind it, it'll take a long time topping out. The last cycle
took over a year to top out. Henceforth and forevermore, if you would like to request a "stock o'der", please post your request in Dear Dr. Stool. If you have not already registered for the message board, please do so. The only required info is user name and password which you choose yourself, and your email address, which you can keep private by selecting the keep private option. Doc looks forward to featuring your ideas. We've had some good ones! Uncle Buck's Illness The very long term view
makes clear that Uncle Buck has a choice. He either makes an intermediate
low here, or he crashes. Doc 's been hearing all the poodits say the
dollar's decline has been orderly. They don't know what they're talking
about. Friday's break signals a move to 100. This is why I'm skeptical of
the long term bond yield chart. I suppose bond yields could fall
concurrent with a dollar collapse, although you'd expect otherwise. The
only way it could happen would be for domestic capital to accelerate out
of stocks. This would offset the foreign capital leaving US Bonds. Stocks
would have no support whatsoever, under the circumstances. Looking at the
daily chart, what is striking is that the 10-13 week cycle oscillator is
just starting to turn over. This collapse is just beginning. Golden Stool Gold stocks
are basing nicely as they head towards concurrent short and intermediate
term cycle lows. This upturn isn't confirmed yet however. There may be
more work to do before prices take off again. I'm not worried about the
slight rollover in the 10-12 month cycle. The absolute level is so high,
that the trend can correct by merely slowing a bit. A sideways down phase
could still have prices pushing higher, although not as fast as in the
last six months. The price of
gold has hit long term resistance and needs to consolidate for a few
months in the 315-330 range before breaking out. See you in Intraday Stool. Dr. Stepan N. Stool Let me know what you think on the Stool Pigeons Wire. Welcome To New Subscribers Welcome, and thank you for subscribing to the Anals of Stock Proctology. You may note some subtle differences in style now that this is no longer a free service. The perspective is still bearish, but it will have a more balanced approach than my message board ravings. You won't see me screaming "BUY" about anything except perhaps gold, but you will see stronger indications of areas and times when I think it might be a good idea to avoid being short. And I promise that I will lose my temper from time to time to keep you entertained! There's also a new feature, Doc's By Request Stock O' The Day. If you have a stock you're interested in, send an email to [email protected], naming the stock, and why you think Doc should look at it, in 25 words or less. 26 words, and you're disqualified! Those that look interesting, Doc will try to feature here within the next day or two. If you have suggestions about other features you'd like to see, send them along to [email protected]. Again, thanks for subscribing!
Explanation of Intraday Commentary-Build charts at http://www.livecharts.com. For custom time bars insert a comma after symbol and number of minutes, e.g. compx,90. This will give you a bar chart of the Nas with 90 minutes per bar. The one day cycle is usually most clear with 8 minute bars and 26/18 stochastics. It varies from day to day. Sometimes 6 minutes works best. Experiment to find the best fit for your trading style, and the market's dominant frequency at the time. The goal here is primarily to monitor the condition of the 8 and 13 day cycles. I typically use 90 minute bars with 26/18 stochastics for the 13 day cycle proxy on the indices during regular trading hours. Other cycles use 26/18 stochastics with the following: 8 days- 60 minute bars On the 24 hour futures charts, use a time per bar approximately 3 to 4 times the above number of minutes, to represent the cycles listed above. ABBREVIATIONS: cma: centered moving average |
|||||||||||||||||||||||||||||||||||||||||||||||||||||||||||||||||||||||||||||||||||||||||||||||||||||||||||||||

![[Most Recent XAU from www.kitco.com]](http://www.weblinks247.com/indexes/idx24_nasdaq_en_2.gif)
![[Most Recent XAU from www.kitco.com]](http://www.weblinks247.com/indexes/idx24_sp500_en_2.gif)
![[Most Recent Quotes from www.kitco.com]](http://kitconet.com/charts/metals/gold/t24_au_en_usoz_2.gif)
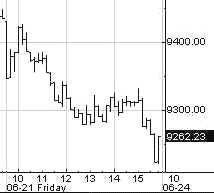
 The
bull case took a beating Friday, as the Dow lost 178 points to 9253. What
makes matters worse is that this plunge comes on the heels of a 400 point
upside reversal last week. The bear has finally conditioned dip buyers,
and various and sundry bulls, to disbelieve all rallies. That's going to
make the next few weeks very interesting. The question is, who is going to
commit to this market? The stage managers? No way. They have the most to
lose. They will let their short positions and their hedges ride until they
sense the moment of sheer panic and then exhaustion. That's when they'll
step in.
The
bull case took a beating Friday, as the Dow lost 178 points to 9253. What
makes matters worse is that this plunge comes on the heels of a 400 point
upside reversal last week. The bear has finally conditioned dip buyers,
and various and sundry bulls, to disbelieve all rallies. That's going to
make the next few weeks very interesting. The question is, who is going to
commit to this market? The stage managers? No way. They have the most to
lose. They will let their short positions and their hedges ride until they
sense the moment of sheer panic and then exhaustion. That's when they'll
step in.