|
Archives 12/30/01, 1/1/02, 1/2/02, 1/3/02, 1/4/02, 1/7/02, 1/8/02, 1/09/02, 1/10/02, 1/11/02, 1/14/02, 1/15/02, 1/16/02, 1/17/02, 1/18/02, 1/22/02, 1/23/02, 1/24/02, 1/25/02, 1/28/02, 1/29/02, 1/30/02, 1/31/02, 2/1/02, 2/4/02, 2/5/02, 2/06/02, 2/7/02, 2/9/02, 2/11/02, 2/12/02, 2/13/02, 2/14/02, 2/16/02, 2/19/02, 2/20/02, 2/21/02, 2/23/02, 2/25/02, 2/26/02, 2/27/02, 2/28/02, 3/1/02, 3/04/02, 3/05/02, 3/06/02, 3/7/02, 3/10/02,3/11/02, 3/12/02, 3/13/02, 3/14/02, 3/15/02, 3/18/02, 3/19/02, 3/20/02, 3/21/02, 3/22/02, 3/25/02, 3/26/02, 3/28/02, 3/30/02 4/1/02, 4/2/02, 4/3/02, 4/4/02, 4/6/02, 4/8/02, 4/9/02, 4/10/02, 4/11/02, 4/13/02, 4/15/02, 4/16/02, 4/17/02, 4/18/02, 4/20/02, 4/22/02, 4/23/02,4/24/02,4/25/02, 4/26/02, 4/27/02, 4/29/02, 4/30/02 5/01/02, 5/2/02, 5/4/02, 5/6/02, 5/07/02, 5/8/02, 5/09/02, 5/10/02, 5/13/02, 5/14/02, 5/15/02, 5/16/02, 5/17/02, 5/20/02, 5/21/02, 5/22/02, 5/23/02, 5/24/02, 5/28/02, 5/29/02, 5/30/02 6/01/02, 6/3/02, 6/4/02, 6/5/02, 6/6/02, 6/7/02, 6/10/02, 6/11/02, 6/12/02, 6/13/02, 6/14/02, 6/17/02, 6/18/02, 6/19/02, 6/20/02, 6/22/02, 6/24/02, 6/25/02, 6/26/02, 6/27/02, 6/30/02 7/1/02, 7/4/02, 7/5/02, 7/11/02, 7/14/02, 7/15/02, 7/16/02, 7/17/02, 7/18/02, 7/19/02, 7/22/02, 7/23/02, 7/24/02, 7/25/02, 7/27/02, 7/29/02, 7/30/02 8/1/02, 8/3/02, 8/5/02, 8/6/02, 8/7/02, 8/8/02, 8/10/02, 8/12/02, 8/13/02, 8/14/02, 8/15/02, 8/16/02, 8/19/02, 8/20/02, 8/21/02, 8/22/02, 8/23/02, 8/26/02, 8/27/02, 8/28/02, 8/29/02, 8/30/02 9/3/02, 9/4/02, 9/5/02. 9/6/02, 9/9/02, 9/10/02, 9/11/02, 9/12/02, 9/13/02, 9/16/02, 9/17/02, 9/18/02, 9/19/02, 9/20/02, 9/23/02, 9/24/02, 9/25/02, 9/26/02, 9/27/02, 9/30/02 10/1/02, 10/2/02, 10/3/02, 10/4/02, 10/7/02, 10/8/02, 10/9/02, 10/10/02, 10/11/02, 10/14/02, 10/15/02, 10/16/02, 10/17/02, 10/18/02, 10/21/02, 10/22/02, 10/23/02, 10/24/02, 10/25/02, 10/28/02, 10/29/02, 10/30/02, 10/31/02
|
The Anals of Stock ProctologyPublished weeknights by
8:30PM Happy Acres, Florida Time The American
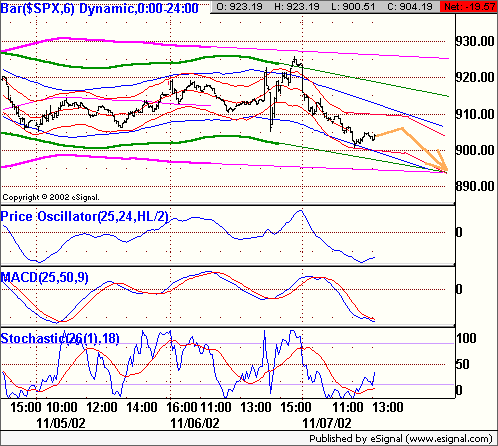
Academy of Stock Proctology and Is your subscription up for renewal? If you want to renew, do nothing, unless your credit card has expired. Please be sure your credit card info is current. If your credit card has expired, you must enter the new expiration date in your Paypal account in order for your subscription to be processed. If you subscribed via Paypal, your subscription will be renewed for one year on the 90 day anniversary of your sign-up and your credit card will be charged. If you want to cancel, use the button at the bottom of the page. This applies only if you subscribed through Paypal. Mailed-in subscriptions are for 1 year. If you subscribed by prior contribution, I will send you a notice before your subscription expires. If you have any questions, see the subscription page and FAQ's. If you can't find the answer, email me. Doc does not make trading recommendations. This update reports time cycle estimates and centered moving average projections based on the Hurst cycle analysis method. This publication is for entertainment and educational purposes only. Doc assumes no responsibility for the accuracy or inaccuracy of the estimates and projections presented. The market may or may not meet the projections. New stoolies should thoroughly familiarize themselves with the methodology before trading based on this method. Those who do not have the time or inclination to develop a trading strategy based on testing and research should not trade. Trade at your own risk. Yadda yadda. How's your motha? Mid Day Outlook 11/7/02 1 PM They came down to the revised downside camp of 901 (posted on Intraday Stool) at 12:30 and turned on schedule but the bounce looks pathetic so far. This market has the look, fell and smell of a burned out hulk. There's no upside cmap on the 1 day cycle, but there is a downside cmap of 893 on the 2-3 day cycle, the low of which is due this afternoon or tomorrow. If there's no follow through on the 1 day cycle up phase, then look for the low to come in the 9-10 hour time frame, which would be in the last half hour today, at 894 +/-. Here's the cycle map guess for the PM 5 Day Cycle______ 2-3 Day Cycle_______ 9-10 Hr Cycle_______ 5 Hr- 1 Day Cycle
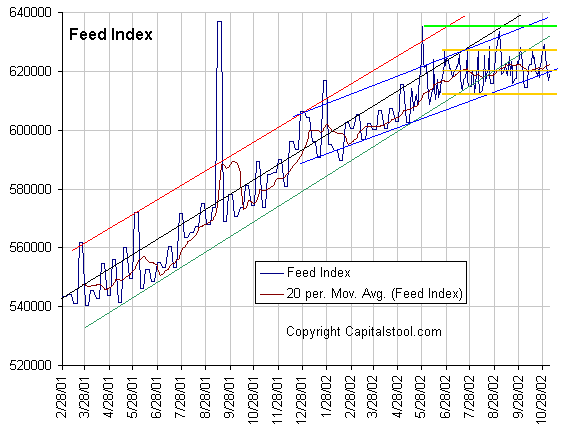
Pre Market Outlook 11/7/02 9:15 AM The 1 day cycle high was at the close yesterday. Based on the fucutures, look for a low of 914 right after the open. The 5 hour and 1 day lows are not due until 11-12:30. We'll probably see lots of gyration between the opening gap down and the 5 hour 1 day lows. Expect the initial reaction to fill the gap, and maybe hit the 3 day cmap of 927. Then another slide into the lows again later in the AM. One thing's for sure. It will be nerve wracking if Doc is right. Sell The News, Part Three (11/6/02) Mr. Bill gets off the hook. Shrub gets a sweep. Al cuts the big one. Crisco beats by a penny. Stoolies, it just doesn't get any better than this. All's right with the world. The bull stampedes on. Last weekend Doc said sell the news. Monday or Wednesday, he said. Doc stands by that, even though there is not yet confirmation of a top from the cycle indicators. The cmaps have only moved up a little. There are no price surprises. If we lived in a vacuum and weren't constantly being buffeted by the emotional stress of day after day of big news, we'd look at the charts and say that everything is proceeding according to plan. If the market should blow its top and run away to the upside tomorrow, then that WOULD be outside the plan, and we'd have to start questioning. But that's always the way it is a major tops. These are the times when bears most deeply question their own sanity, or that of everybody else. That's where we are and that's how it should be. If you are feeling depressed and anxious, you should feel good about that. In fact, if you are feeling suicidal that's the best news of all! Don't worry, be happy! The end is nigh! So Doc still says sell the news. OK he didn't say, short the news, at least not without protection. But the time is right and the price is right. Now all we need is for our trusty indicators to say go. For that, we must wait patiently, regardless of how we feel. The Feed sat quietly while Al cut the big one. There were no expirations and no additions. $4 billion in two day repos and $2 billion in 28 day repos expire Turdsday. Unless the Feed begins pumping Thursday, the rate cut is purely symbolic. With the Feed controlling both the price and supply of money, what you get is rationing. Of course there is a black market for the stuff. It's called the GSE's and what the Fed did today will have no impact on that, or anything else, for that matter. Total Feed remains in the center of the 5 month long flat range, and at the longer term 8% growth lower channel line. The Fed's balance sheet has not grown at all in more than 5 months. This coincides with the period in which the mortgage market has been booming. Al has been leaning against the tide in an attempt to keep money growth from exploding into yet another bubble with even more disastrous consequences, such as finally ruining his rapidly fading reputation. When a moron like Larry Crudlow can scream like a 14 year old cheerleader on the announcement of the 1/2 point cut, when every egonomist in the world with an opinion can appear on crapvision crowing what a brilliant move it was, is there any doubt in your mind that this is going to end badly? As Doug Noland and Bill Fleckenstein put it so well, they can't cure what ails the economy and the financial system by giving it more of what made it sick in the first place. $23 billion in 5 year notes were auctioned Tuesday and $18 billion in 10 Year Notes were auctioned Wednesday. This is all brand new debt ladies and germs. The Fed better start running the printing presses overtime, or it doesn't matter what they peg short term rates at. Longer rates will start ratcheting higher. The notes will be issued on November 15. That's when they have to be paid for. Look for increasing pressure on the market without a giant Feed. Normally the market breaks down on Cut Day, and The Feed pumps the next morning. Since the market was strong after the announcement, it will be interesting to see what they have on the program for us on Turdsday. A big Feed and they can hold the market together for a few more days. But, if no Feed, then no jam. Three trends are evident on
the Feed Index, which is the total Fed holdings of loans and securities. One is the 10% growth trend beginning in May of 2001. Feed
growth has recently been at or below the lower boundary of that trend. The
blue channel going back to last December suggests that Al may now be
targeting an 8% growth rate. Then there's the golden box which says he's stopped growing Feed altogether over the last
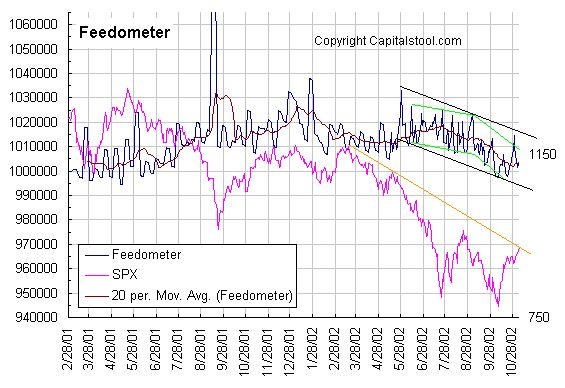
five months. The Feedometer is still near the bottom of its 5 month range. Al probably expects the new credit coming in from the late lamented mortgage bulge to keep things liquid. Doc suspects that they may only respond if the markets go into meltdown mode. We'll find out today if they really intend to be proactive, or reactive. The
Feedometer theoretically
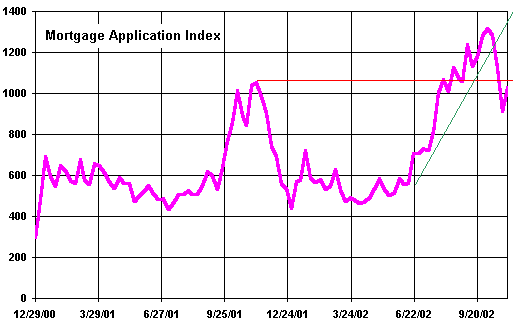
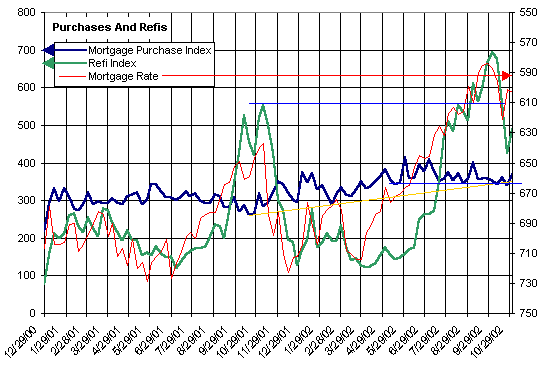
measures excess Feed available for bond or stock market jamming. The Mortgage Bonkers Ass. weekly
mortgage applications index bounced back a bit. Although the trend has
reversed, liquidity continues to pour in to the system as these loans are
funded and purchased by the GSE's. The bulge in money growth that was
expected as a result has been partially offset by the Feed's stinginess. Both refi's and purchase
applications bounced. Over the next couple of weeks, assuming long rates
continue to trend higher, the spigot will be turned off. Even if rates
simply remain at current levels, the refi bulge will continue to subside,
with disastrous effects. Given the funding lag, the biggest part of the
bulge is still ahead over the next 4 weeks. We should begin to see the
negative effects of the decline in applications in mid-December. Keep in
mind that many of these applications will not fund as a result of the
uptick in mortgage rates. This is a ticking time bomb, and may be one of
the reasons Al cut the big one. Now we wait to see if he steps up with mo
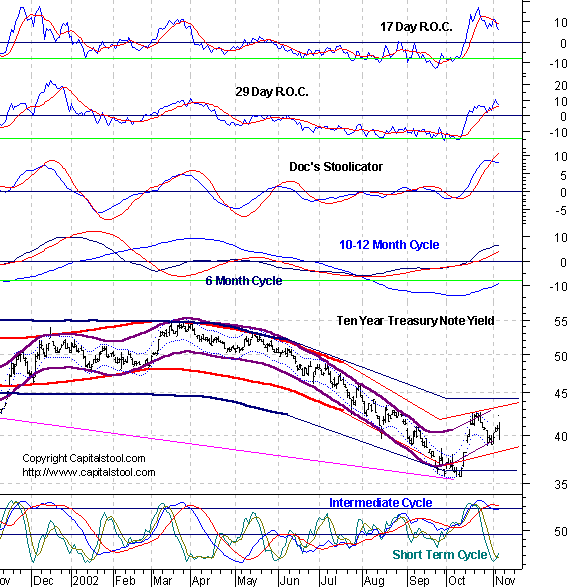
money. Bond yields
gapped higher for the third day in a row, but closed lower after the
Treasury auction closed. Short cycles are bottoming but the 10-13 week
cycle is topping out, and it should go sideways for the next month or two.
The 6 month and 10-12 month cycles are heading up. Yields should trade in
the 3.90 to 4.50 range, then begin moving solidly higher beginning
in mid-December-January.
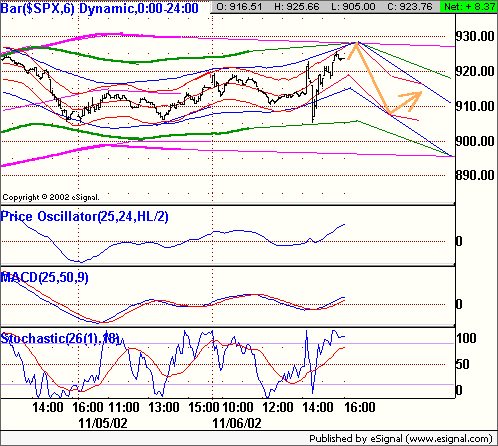
Intraday Outlook - A 1 day cycle high is due in the first hour. The cmap of 923 was hit late Wednesday. There's a 3 day cycle cmap of 927. The CSCO aftermarket nonsense didn't hold up, and all of the big tech stocks ended the after hours session down from the close. As the 1 day cycle turns down in mid morning, profit taking should drive prices down into 5 hour and 1 day cycle lows around 11 AM and 12:30. Below is the best guess map for Turdsday morning. Check for the pre-market update around 9 AM, when Doc will consider the impact of the fucutures action. 5 Day Cycle______ 2-3 Day Cycle_______ 9-10 Hr Cycle_______ 5 Hr- 1 Day Cycle
OK, Doc knows what you're thinking. What if
he's wrong? If that's the case, the market might blow out to 940-960 to
end it. It might look something like this. Aargh. If the market isn't
pulling back sharply by 11 AM, this becomes a real possibility. All of Doc's
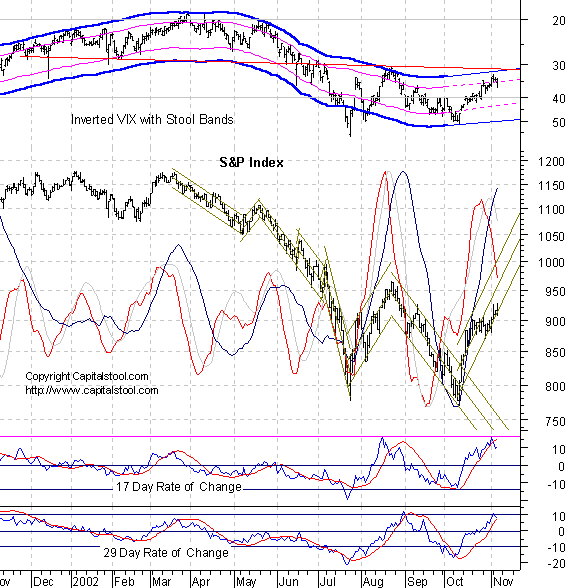
cycle charts below are powered by METASTOCK Portfolio Sphincters Index (SPX) and Sentiment Sentiment and Momentum Indicators
The 17 day rate of change is a proxy for the
6-7 week cycle. the 29 day rate of change is a proxy for the 10-13 week
cycle. The dark blue overlaid line is the 10-13 week cycle
oscillator, while the red line is the 6-7 week cycle oscillator. The VIX
is a measure of implied options volatility reflecting relative fear or
complacency. It is plotted below on an inverse scale to better show the
relationship to the price chart. The "Stool Bands may reflect either
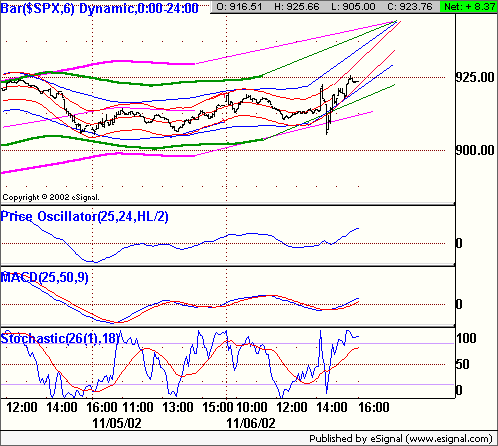
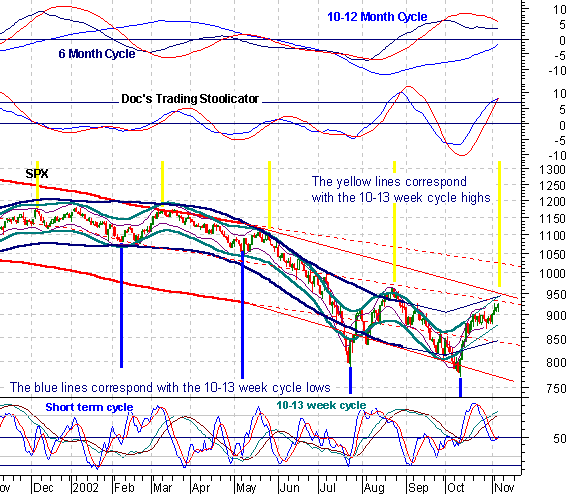
6 month or 10-12 month cycles. Short Term Cycles The cmaps on the 8-13 day cycles are 940-950. Thursday is the zero day, the latest day they should peak. The 4 week cycle is not a factor. The 6-7 week cycle is still in a top, with the cmap also rising to 940. The overlaid cycle indicator is headed down. This is either a sideway down phase, or prices should now begin to drop sharply. The 17 day rate of change also turned down on Tuesday and is now diverging. Normally that's a reliable sign of an imminent cycle high which will be confirmed when the indicator turns lower. 10-13 Week Cycle This cmap inched up to 945. The top is due at any time over the next 12 days. Tops on this cycle are often marked by a couple weeks of churning after a blowoff day. We had a blowoff day Monday. The 29 day rate of change is at a top level but must turn down to confirm the high. Cycle oscillators remain in position to confirm a top within a day or two, but being in position is one thing. Until they actually turn, prices will tend to go up. VIX The VIX Stool Bands are trending up on the inverted scale chart and the index is in the upper sell signal band. A break of the trend is all that's needed to signal a turn. Cycle Chart Virtually everyone was expecting a 4 year low in the current time frame. But bubbles are peculiar. The tsunami wave spawns atypical wave responses. The November 1929 low was at a 3 year anniversary. The next important low was in July 1932. At other times we have seen cycles run 4.5 years, or 3 years. Focusing in a 4 year low is a bad idea, especially when the whole world expects it. Cycles vary in duration, and long term indicators do not suggest that the this was the bear market low. The most obvious long term wave this time has been approximately two years in duration, and the last low was in mid 2001. So we should look for the next one around mid-year next year, give or take 3 months either way. That would also correspond with the 10-12 month cycle which bottomed in July and is now in the midst of a sideways up phase in the range of 780 to 950. A retest of the August high is possible, but it's more likely that the current rally will fall short. The rally is part of a 6 month cycle top within the 10-12 month cycle up phase. Significantly lower lows look like they will be delayed until well into next year. 925 and 960 are areas of heavy resistance. The Cycle Conditions tables include cycle phase and a wild guess as to number of periods to the next turn, in days for the shortest cycles, weeks (W) or months (M) for the longer ones. This is a fluid exercise, in other words, the projections are likely to be wrong, but they force us to be vigilant for key turning points, and frequently work well enough to prevent costly misreadings. SPX Cycle Conditions as of 11/6/02
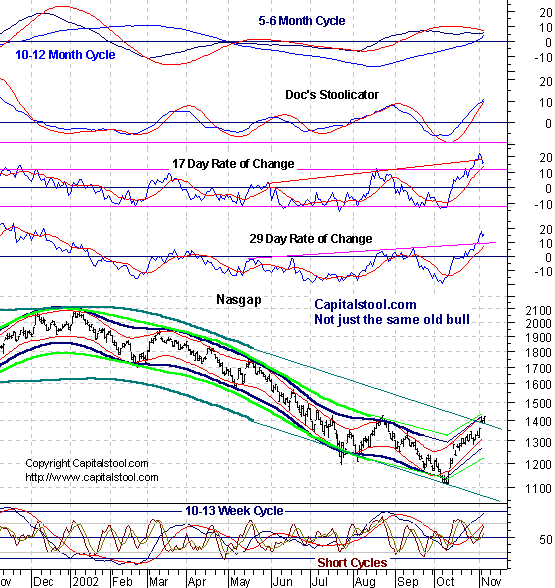
PTT - Periods Till Turn Nasgap Charts Cycle Chart Short Term Cycles The 8 and 13 day cycle cmap solidified at 1440 with a top phase due now. The 6-7 week cycle cmap rose to 1420, which it hit on Monday and again today. The 17 day rate of change is now in a negative divergence, but did not flash a sell signal. The first good sized down day should do it. 10-13 Week Cycle The 10-13 week cycle cmap trailed actual prices moving up to 1410. This is unusual since the cmaps normally remain well ahead of price. Price has blown the top of the major trend channel. That's usually what happens at an overextended top. It looks like a breakout, but it also looks like an exhaustion move. Doc thinks that's what it is. We are about to find out if he's right. The "4 Year Cycle" looks like it bottomed last year, lasting only 3 years as a result of the influence of the tsunami bubble wave. The Nasty may actually have been in a 3-4 year cycle up phase since then, with the current move being the rigor mortis rally before the Nas heads for its ultimate price objective of negative 400. Note that as the 10-12 month cycle oscillator has moved up, the market has moved sideways in a range of 1400 to 1100. The top could form in that cycle at any time over the next month or two. By 2007, when a 12 year low is due, the Nas will be the National Toilet Paper Exchange. There is massive resistance above current levels. The going will get a lot tougher from here. Nasdaq Cycle Conditions as of 11/6/02
PTT
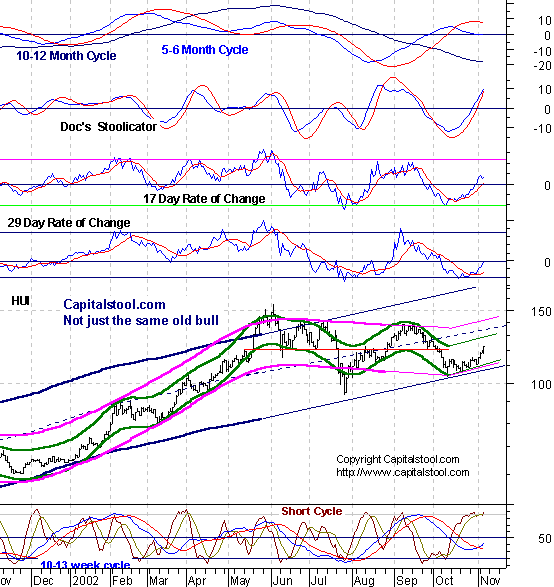
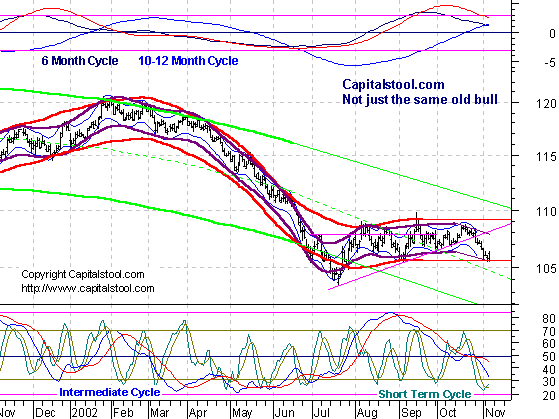
- Periods Till Turn Long Bong Hit - See top of page. AM Edition Features (Previous) These features are in morning edition, published between 7:30-8 AM ET US, or the Saturday Weak End Edition, published, uh, let's see, Saturday! Golden Stool The 10-13 week
cycle up phase is beginning to accelerate out of its base. The 10-12 month
cycle oscillator is beginning to trough. The 13 day cycle cmap has moved
up to 125. Other short cycle cmaps are lagging, a sign of a possible
pullback. The preliminary 10-13 week cycle cmap is 132. That will change
as more data is added. Uncle Buck's Illness
Uncle B has come down to a critical support level. After rallying
overnight, he's sitting precariously at 105.60 at 7:30 AM NY time. The
short cycle oscillator says up for a few days, but so far that's a no go.
Looking at longer term oscillators at the top of the chart, it appears
that Uncle B is headed for a sustained decline after a brief period of
attempting to hold on in the 105-104 area. Then, goodbye! As goes Buck, so
goes the stock market. Suctor Watch and Stoolwethers- Now posted on separate page. Updated each morning between 8 AM and 9:30 AM NY time. See you in Intraday Stool. Dr. Stepan N. Stool Share your thoughts on the Stool Pigeons Wire.
Renewals Welcome, and thank you for subscribing to the Anals of Stock Proctology. Your trial subscription will run for 90 days. At the end of that period your subscription will renew automatically, unless you cancel. If you wish to cancel your subscription use the button below. If you want to renew your subscription do nothing. Your subscription will renew and your credit card or Paypal bank account will be charged. If you want to renew, be sure your credit card information in your Paypal account is current. Paypal will not renew your subscription if the card has expired! Again, thanks for subscribing!
Explanation of Intraday Commentary-Build charts at http://www.livecharts.com. For custom time bars insert a comma after symbol and number of minutes, e.g. compx,90. This will give you a bar chart of the Nas with 90 minutes per bar. The one day cycle is usually most clear with 8 minute bars and 26/18 stochastics. It varies from day to day. Sometimes 6 minutes works best. Experiment to find the best fit for your trading style, and the market's dominant frequency at the time. The goal here is primarily to monitor the condition of the 8 and 13 day cycles. I typically use 90 minute bars with 26/18 stochastics for the 13 day cycle proxy on the indices during regular trading hours. Other cycles use 26/18 stochastics with the following: 8 days- 60 minute bars On the 24 hour futures charts, use a time per bar approximately 3 to 4 times the above number of minutes, to represent the cycles listed above. ABBREVIATIONS: cma: centered moving average
|

![[Most Recent HUI from www.kitco.com]](http://www.weblinks247.com/indexes/idx24_hui_en_2.gif)
![[Most Recent XAU from www.kitco.com]](http://www.weblinks247.com/indexes/idx24_sp500_en_2.gif)
![[Most Recent Quotes from www.kitco.com]](http://kitconet.com/charts/metals/gold/t24_au_en_usoz_2.gif)