|
Archives 12/30/01, 1/1/02, 1/2/02, 1/3/02, 1/4/02, 1/7/02, 1/8/02, 1/09/02, 1/10/02, 1/11/02, 1/14/02, 1/15/02, 1/16/02, 1/17/02, 1/18/02, 1/22/02, 1/23/02, 1/24/02, 1/25/02, 1/28/02, 1/29/02, 1/30/02, 1/31/02, 2/1/02, 2/4/02, 2/5/02, 2/06/02, 2/7/02, 2/9/02, 2/11/02, 2/12/02, 2/13/02, 2/14/02, 2/16/02, 2/19/02, 2/20/02, 2/21/02, 2/23/02, 2/25/02, 2/26/02, 2/27/02, 2/28/02, 3/1/02, 3/04/02, 3/05/02, 3/06/02, 3/7/02, 3/10/02,3/11/02, 3/12/02, 3/13/02, 3/14/02, 3/15/02, 3/18/02, 3/19/02, 3/20/02, 3/21/02, 3/22/02, 3/25/02, 3/26/02, 3/28/02, 3/30/02 4/1/02, 4/2/02, 4/3/02, 4/4/02, 4/6/02, 4/8/02, 4/9/02, 4/10/02, 4/11/02, 4/13/02, 4/15/02, 4/16/02, 4/17/02, 4/18/02, 4/20/02, 4/22/02, 4/23/02,4/24/02,4/25/02, 4/26/02, 4/27/02, 4/29/02, 4/30/02 5/01/02, 5/2/02, 5/4/02, 5/6/02, 5/07/02, 5/8/02, 5/09/02, 5/10/02, 5/13/02, 5/14/02, 5/15/02, 5/16/02, 5/17/02, 5/20/02, 5/21/02, 5/22/02, 5/23/02, 5/24/02, 5/28/02, 5/29/02, 5/30/02 6/01/02, 6/3/02, 6/4/02, 6/5/02, 6/6/02, 6/7/02, 6/10/02, 6/11/02, 6/12/02, 6/13/02, 6/14/02, 6/17/02, 6/18/02, 6/19/02, 6/20/02, 6/22/02, 6/24/02, 6/25/02, 6/26/02, 6/27/02, 6/30/02 7/1/02, 7/4/02, 7/5/02, 7/11/02, 7/14/02, 7/15/02, 7/16/02, 7/17/02, 7/18/02, 7/19/02, 7/22/02, 7/23/02, 7/24/02, 7/25/02, 7/27/02, 7/29/02, 7/30/02 8/1/02, 8/3/02, 8/5/02, 8/6/02, 8/7/02
|
The Anals of Stock ProctologyPublished weeknights by
8:30PM Happy Acres, Florida Time The American Academy of Stock Proctology and Is your subscription up for renewal? If you want to renew, do nothing, unless your credit card has expired. Please be sure your credit card info is current. If your credit card has expired, you must enter the new expiration date in your Paypal account in order for your subscription to be processed. If you subscribed via Paypal, your subscription will be renewed for one year on the 90 day anniversary of your sign-up and your credit card will be charged. If you want to cancel, use the button at the bottom of the page. This applies only if you subscribed through Paypal. Mailed-in subscriptions are for 1 year. If you subscribed by prior contribution, I will send you a notice before your subscription expires. If you have any questions, see the subscription page and FAQ's. If you can't find the answer, email me. PM Update 8/9/02 12:30 PM Terms and methodology The AM downside cmaps for the 1 day cycle were met or slightly violated, but basically held. The 8 day cycle uptrend was not broken. New projections are below. If Doc were thinking about scalping a short, he'd be focused on how Mr. Market behaves in the vicinity of the 5-8 day cycle cmaps. And even then he wouldn't be too anxious. He would not trust any 5 hour or 1 day cycle highs to be a good short entry until those longer waves look like they have started to roll over. Doc gets the feeling that game of chicken between bulls and bears has begun. Perhaps we'll see some tightening of the recent volatility. Doc does not make trading recommendations. This update reports intraday time cycle estimates and centered moving average projections based on the Hurst cycle analysis method. Doc assumes no responsibility for the accuracy or inaccuracy of these estimates and projections. The market may or may not meet these projections. New stoolies should thoroughly familiarize themselves with the methodology before trading based on this method. There is no free lunch. Those who do not have the time or inclination to develop a trading strategy based on testing and research should not trade. Trade at your own risk.
AM Update 8/9/02 10:30 AM Terms and methodology If the SPX doesn't hold 891, the cmap for the 5 hour cycle would drop to 885. On Nas if 1290 doesn't hold, the cmap drops to 1275. AM Update 8/9/02 9:30 AM Terms and methodology Running late today. Cmaps are as posted. Will update as needed. Doc does not make trading recommendations. This update reports intraday time cycle estimates and centered moving average projections based on the Hurst cycle analysis method. Doc assumes no responsibility for the accuracy or inaccuracy of these estimates and projections. The market may or may not meet these projections. New stoolies should thoroughly familiarize themselves with the methodology before trading based on this method. There is no free lunch. Those who do not have the time or inclination to develop a trading strategy based on testing and research should not trade. Trade at your own risk.
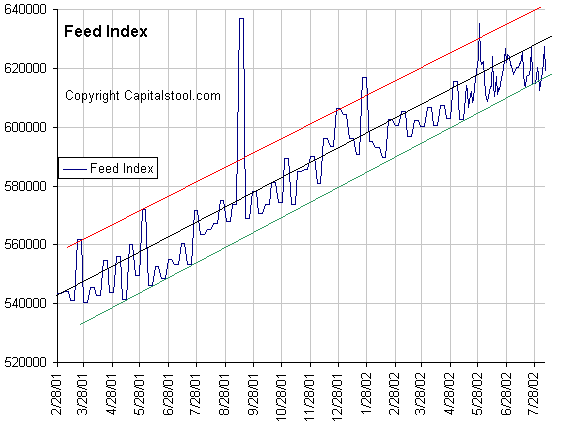
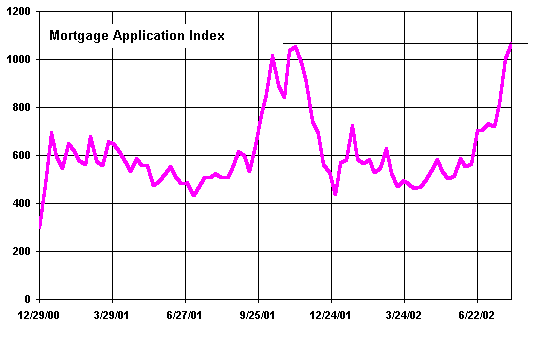
It's Not The Economy Stoolpid! (8/8/02) The Feed added $3 billion in overnight repos, only partially replacing $4 billion of expiring 28 day repos. It then added $5.25 billion in overnight repos while $13 billion in overnight to 3 day repos expired. The result was a net drain of $8.75 billion. Thursday's $5.25 billion will expire Friday. Most
of the funds drained today were added to help absorb the new Treasury Notes issued
Tuesday and Wednesday. Doc believes that Al is nervously watching the explosion in the
mortgage market again, and fearing the ultimate collapse of the real estate
not-a-bubble, not-a-mania. Al has created a monstuh, and he doesn't quite know what to
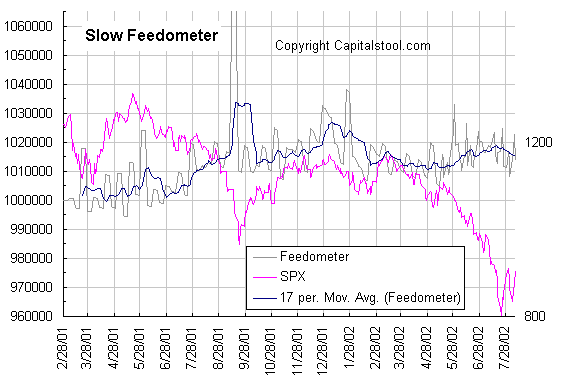
do about it. The Feedometer theoretically
measures the excess Feed available to the Gang of 22 to jam the markets.
It's heading down, but there's liquidity rushing into the market from the
sudden explosion in the broader money supply. Perhaps the sheeple
are using their CapitalOne cards to average down again. Whatever, it is
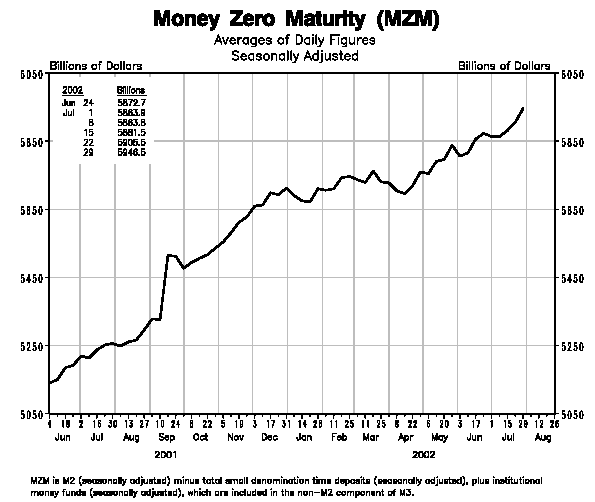
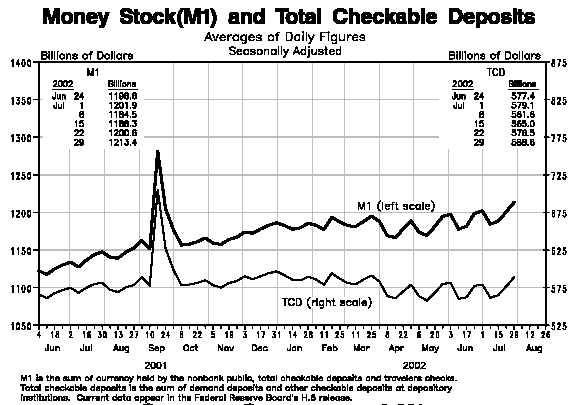
enough to sustain the market until the mortgage bulges subsides again. Doc is repeating the chart and comments below from yesterday because it ties in with the monetary data released by the Fed today in its regular Thursday night update on the M's and various other monetary measures. The mortgage
bubble monster has risen from the grave and is expanding fast. The same
kind of bulge was a major factor in the stock market rally in the fourth
quarter. That was also accompanied by massive Feed jamming, a condition
which isn't present so far this time. Again, from Wednesday:
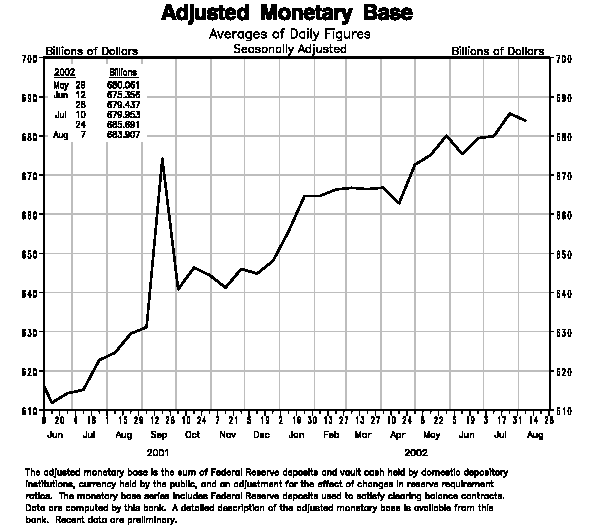
Lo and behold,
comes tonight's data. First the monetary base through August 7 confirms
what we've seen lately in the total Feed. Al has cut down on the beans and
broccoli in his diet in the last two weeks. In spite of
that, the broad money supply as measured by MZM (through 7/29) is
exploding upward at an accelerating pace. And just as Doc
suspected, some of the excess flatulence from this renewed bubble has
finally begun to seep into M1, and will soon be reflected in the time
lagged economic data. Economic activity and inflation are in the process
of heating up. As Doc constantly reminds you, pay no attention to current economic data. It's ancient history. The market and the economy are driven by the same fuel source and respond nearly instantaneously in today's wired world. Doc is not one who subscribes to the ridiculous theory that there's a lag between monetary activity and and economic activity. Sure it may take up to a month or two for some of the money to go through the system, but when it becomes money it's in the system and goes to work immediately. No lag. Especially when it comes to the market. The lousy economic data we saw over the last couple of weeks have absolutely nothing to do with what the market is doing now. The market is a real time liquidity meter, and right now there is excess and growing liquidity, thanks entirely to the meltdown in bond yields and the resulting reflatulation of the mortgage bubble. It's money in the bank that economic data will also explode upward in the weeks to follow, just another manifestation of the volatility in a financial system that's come undone and is careening out of control. But whatever the economic data, you must train yourself to pay no attention to it. It has nothing to do with stock prices now or in the future. There is no way that future stock price changes can be predicted by looking at month old economic data, which is going to be revised again and again anyway. It may be good sport, and fun to complain about. And yes, some traders are sharp enough to recognize a news driven counter trend reaction and take advantage of it. But for most it's a waste of time if your primary concern is understanding the market, or better yet making money from it.
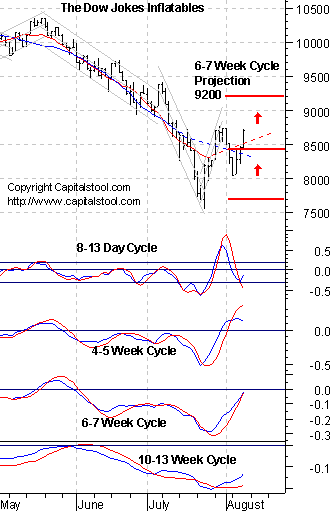
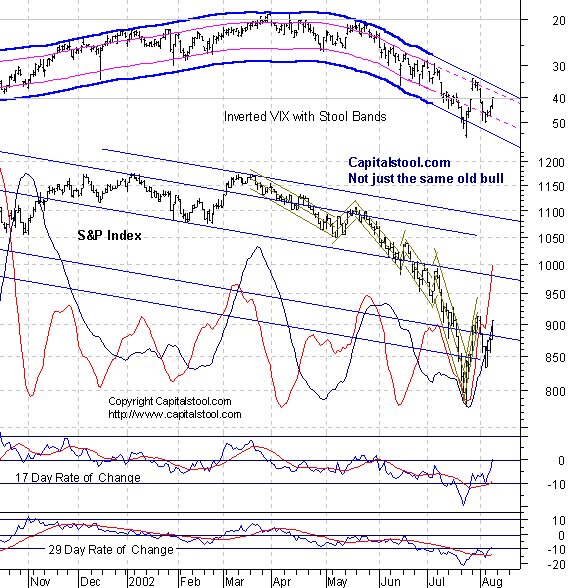
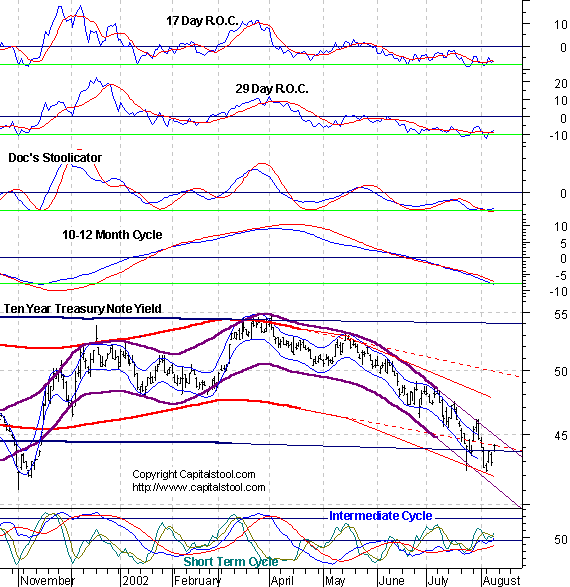
Portfolio Sphincters Index (SPX) and Sentiment
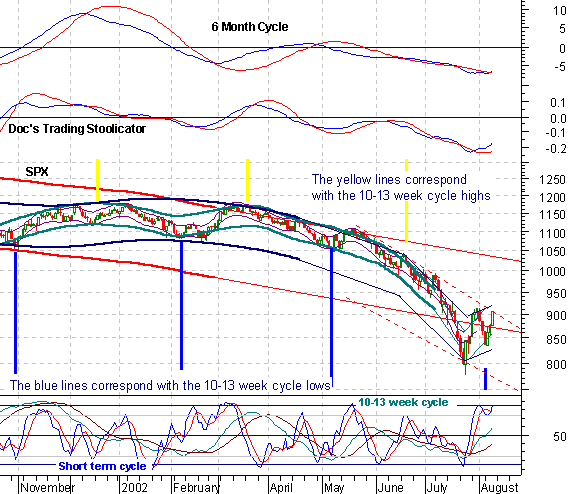
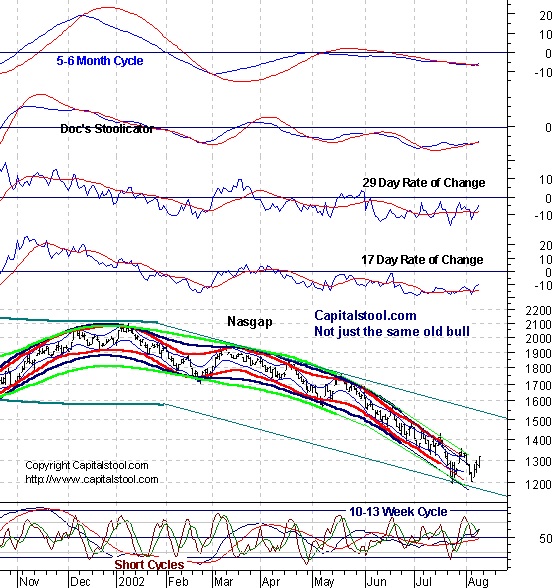
All cycles from 8 days to 6 months are apparently in gear to the upside. It looks like the slope of the up phase will be positive, perhaps strongly so, as opposed to the hoped for sideways up phase. The 6 month cycle indicator is starting to confirm the turn. confirming a turn. Whipsaws happen, but this is a smooth indicator that doesn't shift easily. Doc wouldn't bet against this turn. The VIX fell to 39.81. In retrospect, the late July spike is also looking like a good low for the 6 month cycle. Further confirmation will come when the channel begins to turn sideways. The 17 and 29 day rate of
change indicators which represent the 6-7 and 10-13 week cycles are
confirming the upturn, and the 17 day rate of change suggests the move
could be explosive. Cmaps
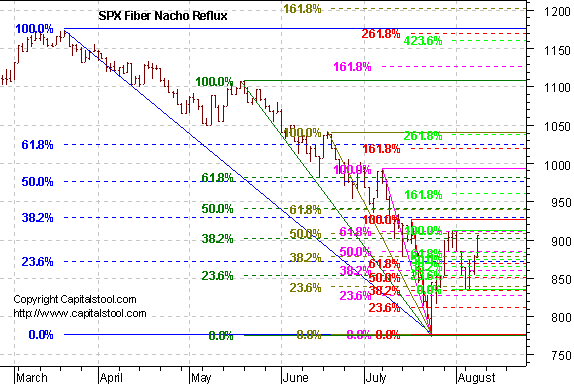
suggest highs of 940 to 980 in the next couple of weeks, and could move
higher. The
probability is growing that the upward
bias could last a month or two. The 6 month cycle oscillator is starting to turn up. The trading stoolicator is coming out of its trough, all signs which are the opposite of bearish. There's a technical term for that, but it shall never pass Doc's lips. The short cycle oscillator looks like it's topping out, but in the
initial stage of the 6 month cycle up phase, it can stay up at these
levels for days. Don't let the overbought position give you false hope. It's just another not-bearish sign. Shorting
this market, on anything other than an intraday scalp with protection,
could be hazardous to your health 910 is the next fiber nacho
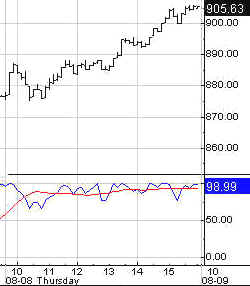
reflux. If it gaps that look for 930, then 940. The Cycle Conditions tables include cycle phase and a wild guess as to number of periods to the next turn, in days for the shortest cycles, weeks (W) or months (M) for the longer ones. This is a fluid exercise, in other words, the projections are likely to be wrong, but they force us to be vigilant for key turning points, and frequently work well enough to prevent costly misreadings. SPX Cycle Conditions as of 8/8/02
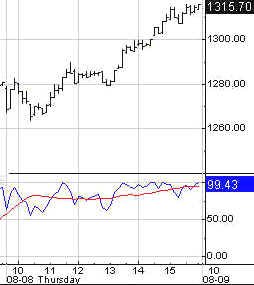
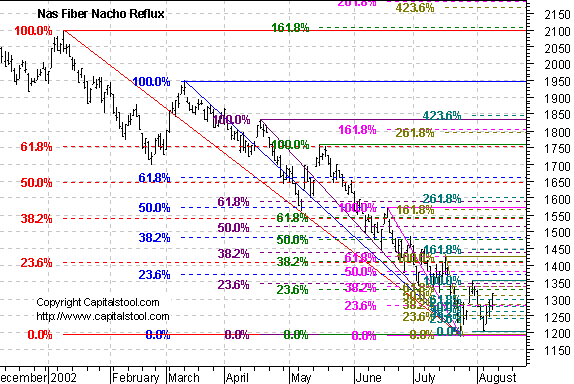
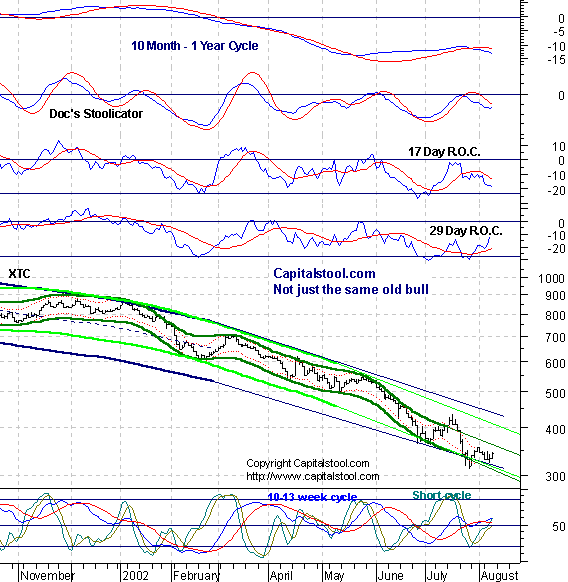
PTT - Periods Till Turn Nasgap Charts The Nas is heading for the baseline of the double bottom pattern around 1355. The 6 month cycle oscillator is starting to confirm the turn.
The 10-13 week cycle oscillator says the Nas is in a swup. That could soon
lose the "sw". There's less confirmation of the upturn than with
the SPX. It's probably just a minor lag. Cmaps are pointing to the 1345-85
area. The 6 month cycle low cmap has moved up to 1130-1150. That hasn't
been met, but it may not be until the next 6 month cycle. However, on the
slim chance this rally fails near term, that would be the target for the
final low on this wave.
1335-55 is an area of heavy fiber nacho reflux activity. Nasdaq Cycle Conditions as of 8/8/02
PTT
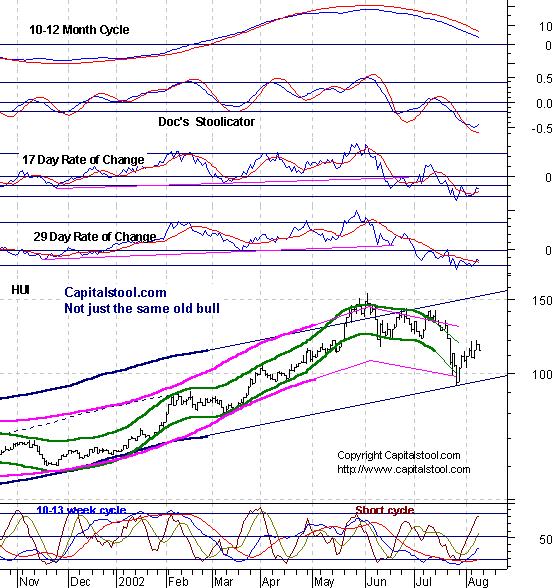
- Periods Till Turn Golden Stool The 13 day
cycle cmap on HUI is now 121. That cycle has topped and should pull
back, but the 4, 6-7 and 10-13 week cycles are headed up. The 10-13
week cycle low projection was 100. The 10-12 month cycle oscillator can be
expected to lag the price turn. We want to see it begin to flatten in the
area of the zero line then gradually turn up. The higher the level of the
trough in that indicator, the more bullish the implications. AM Edition Features (Previous) These features are in morning edition, published around 9 AM ET US, or the Saturday Weak End Edition, published, uh, let's see, Saturday! The intermediate cycle is
turning up. The short cycle oscillator upturn above the zero line could
lead to a sharp upmove. The stoolicator is beginning to reverse from the
extreme lows which launched the November move up. Still looking for
confirmation from the rate of change indicators. An up day today would do
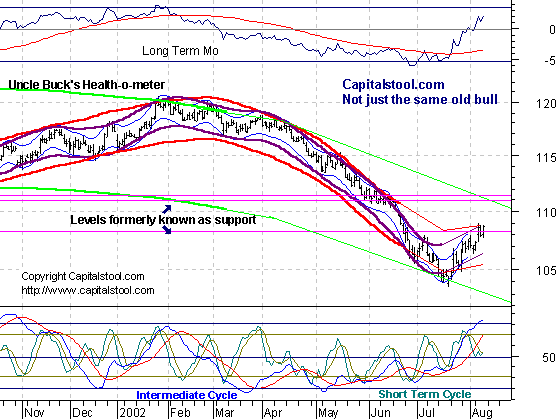
it. Uncle Buck's Illness Buck continues his wild ways, dropping from 108.8 to 108 overnight before sticking his head up a little this morning. The Intermediate oscillator is getting into toppy territory, but it will take some days or even weeks to turn it lower.
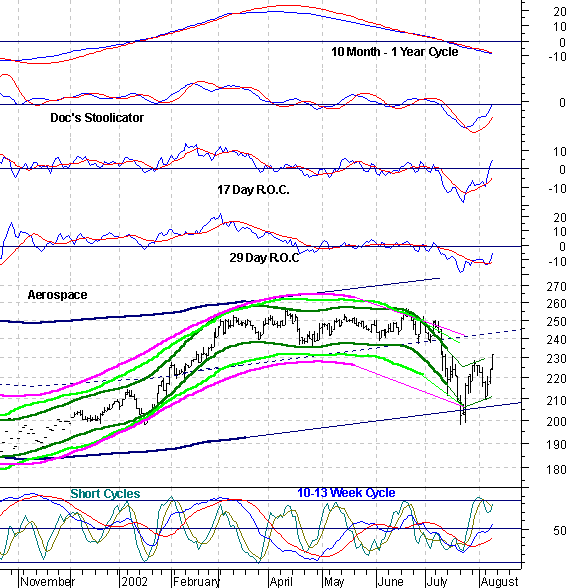
Aerospace is
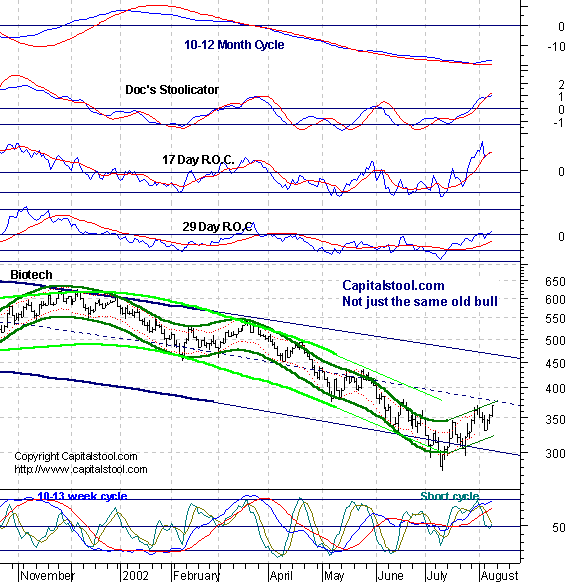
taking off out of a reverse head and shoulders. Biodrech-
Floating higher as it nears a breakout from reverse head and shoulders,
but the 10-13week cycle oscillator is headed into topping territory. Will
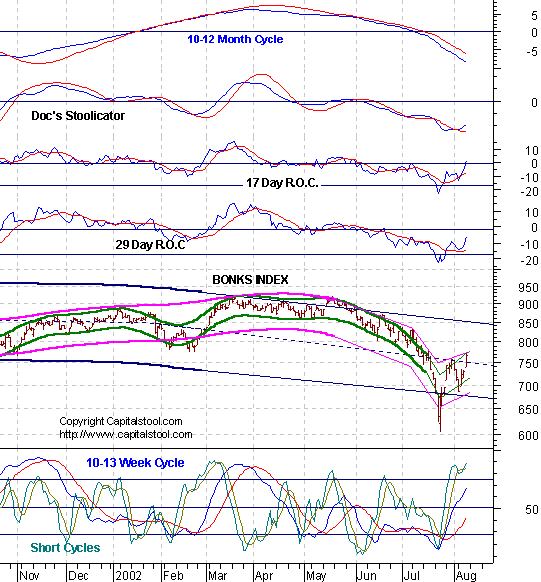
breakout be fakout? Bonkers- The
IMF drops thirty big one on Brazil and the scum floats toward the surface. Consumer-
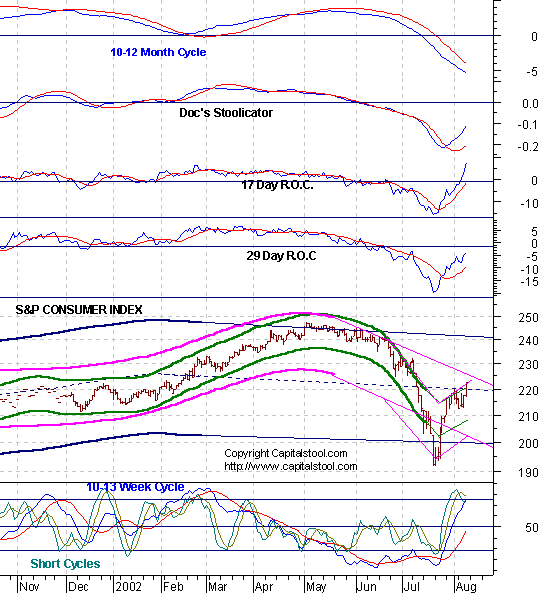
Suddenly soap and food are trading like internet stocks in 1999-2000.
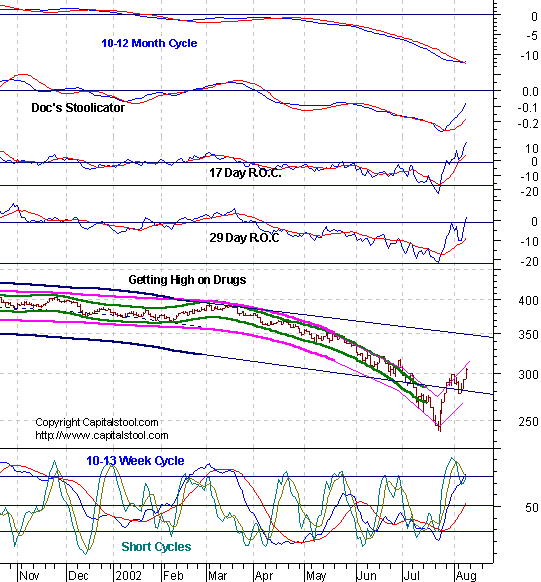
Tough to make sense of it, with two possible forecasts, as shown. Drugs are
making people high. Headed for testing at the upper long term channel
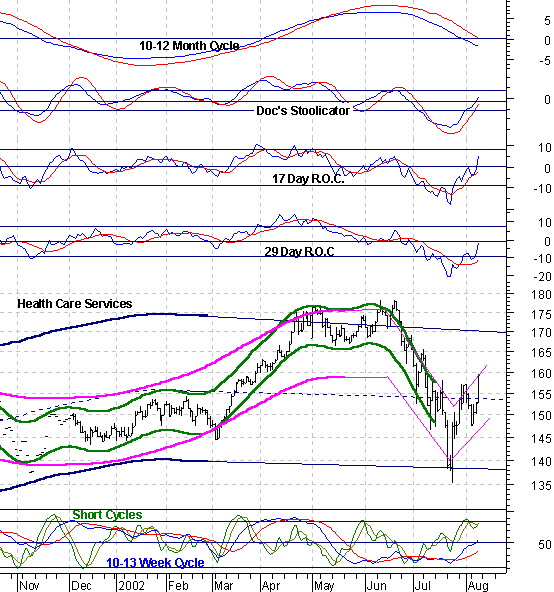
projection. Healthcare
stocks- Going back to test the highs. Is this volatility the wave of the
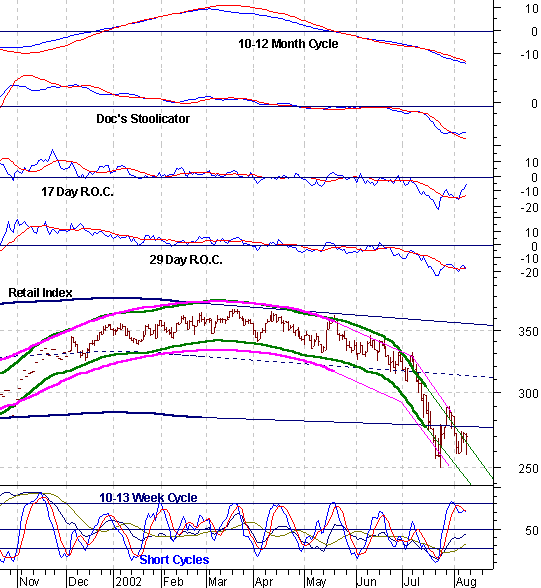
future? Retailers struggled
yesterday. Is this the first chink in the market's armor, or will they
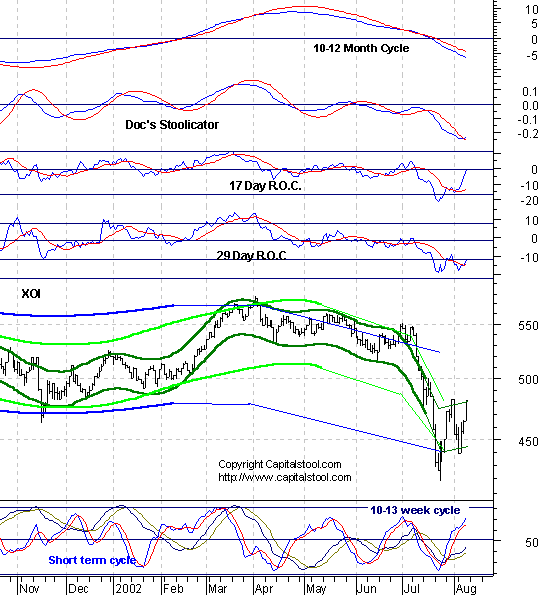
follow the stampede higher? Energy
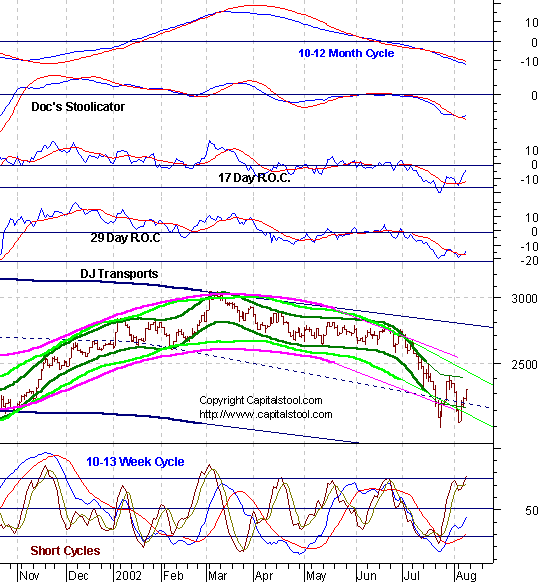
stocks are beginning to feel the power. Trannies are
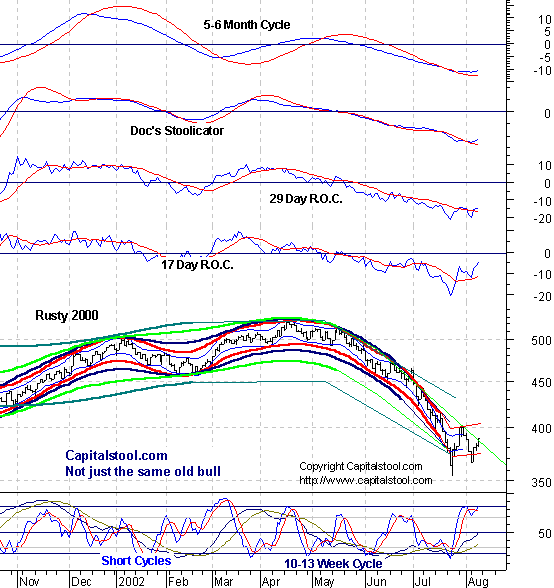
taxiing, but may not reach takeoff speed. Small craps-
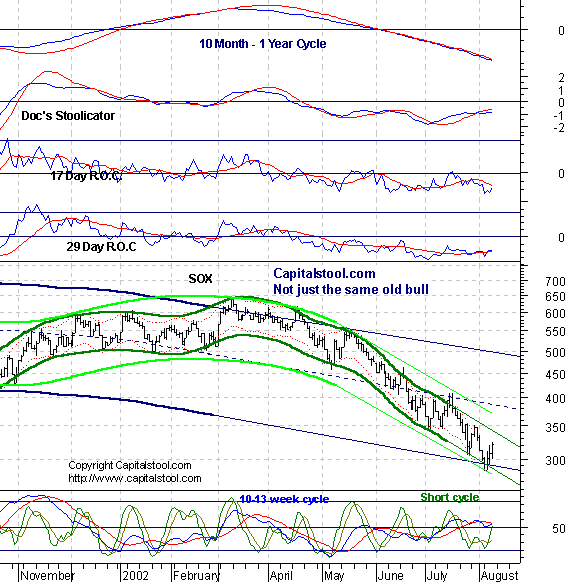
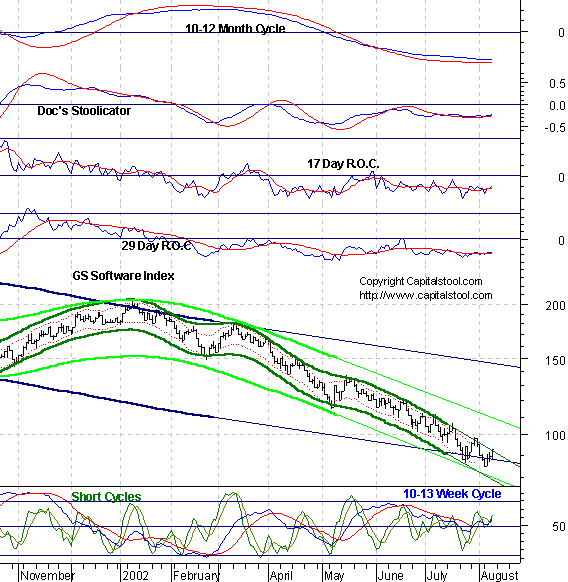
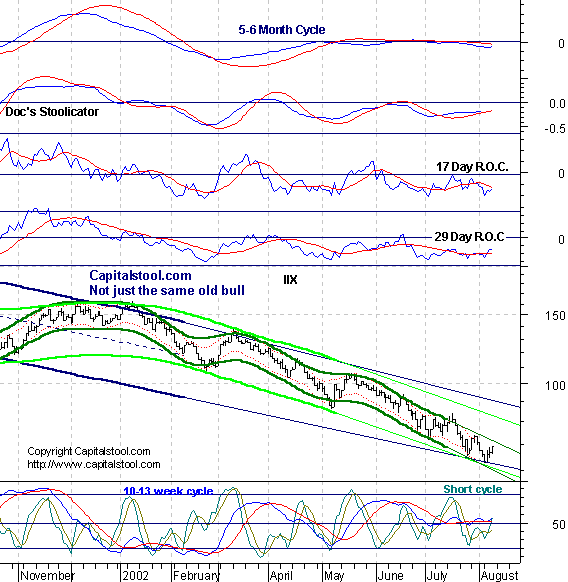
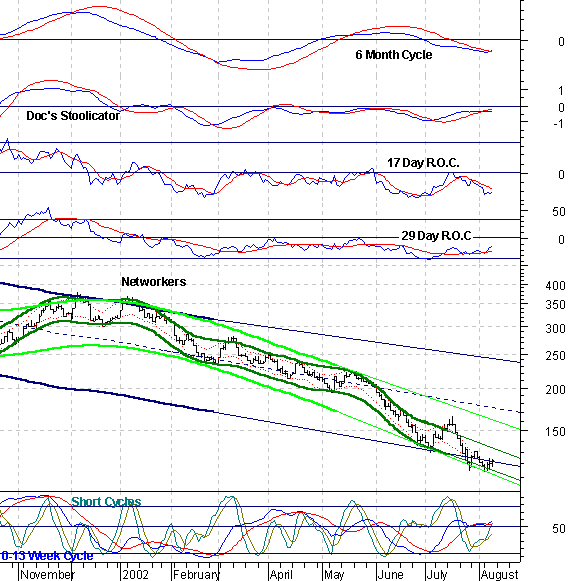
Looks like they can float too. Tech Review-
Some could bounce, but still moribund overall. Soft Where Internut Nutworkers X-the
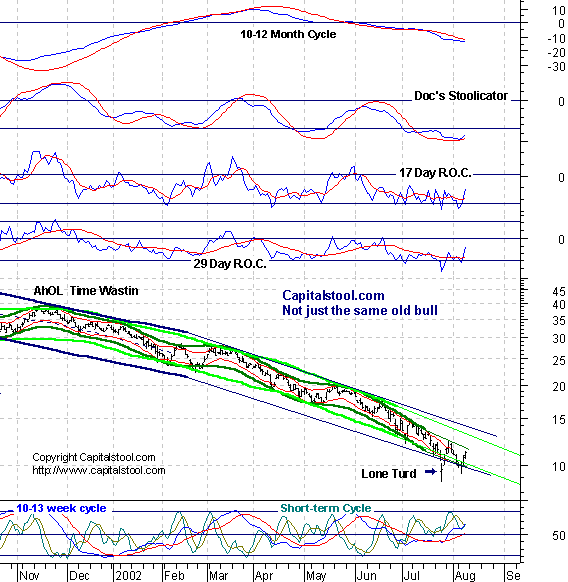
Telecoms AhOL - May
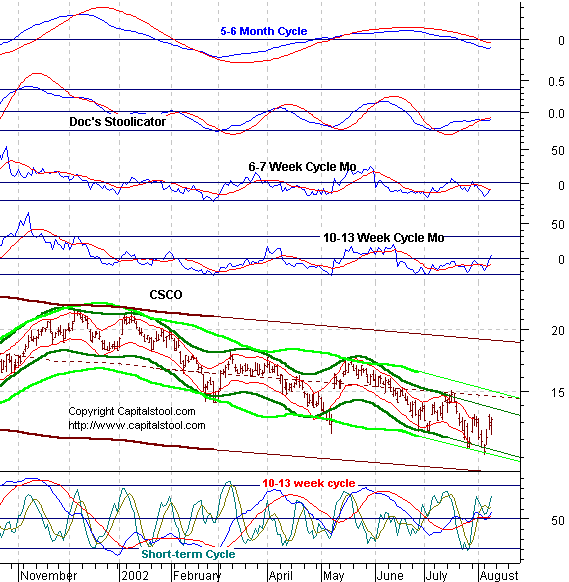
plop up a bit or it could come out sideways. Crisco- lit
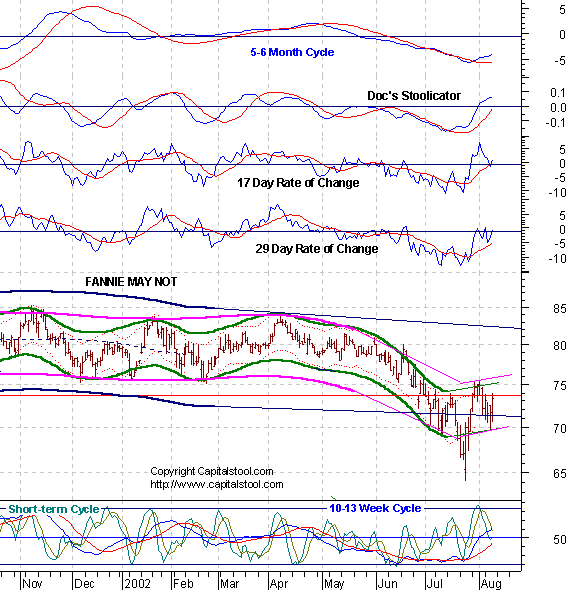
the grease fire in this market, but flamed out itself. Fannie just
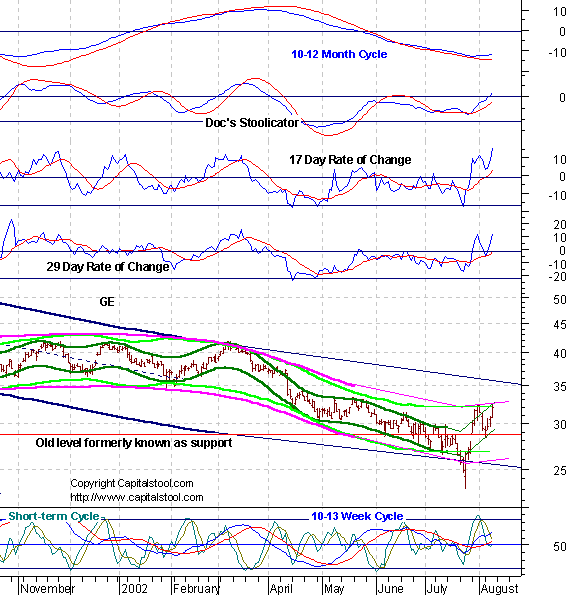
sits there, but the intraday volatility is stunning. GE- All
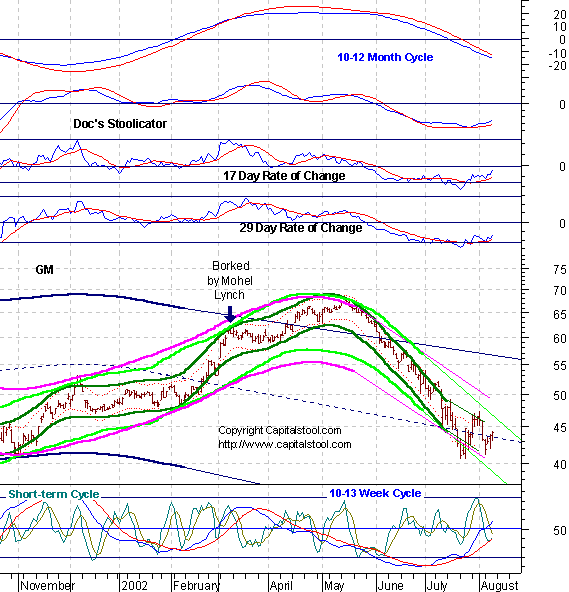
signs point higher. GM- Can't
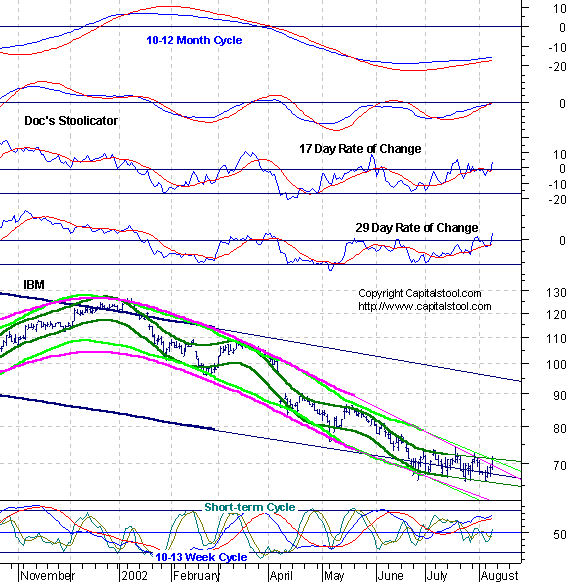
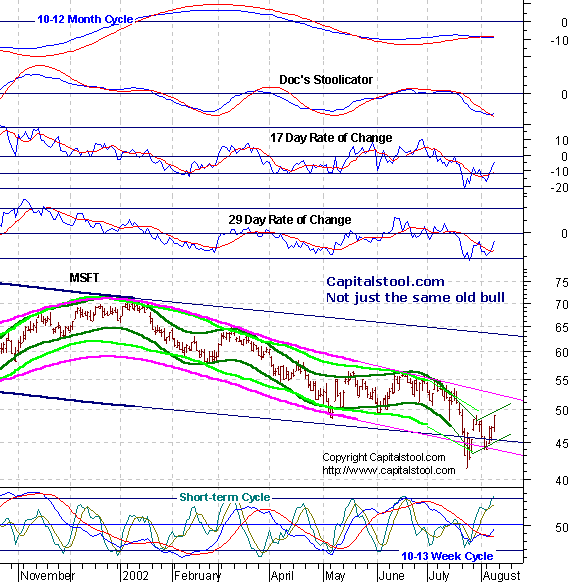
get traction in this swup. Getting to 46 will be an achievement. IBM- IF it
stays in this range, it will be the prime short candidate when the market
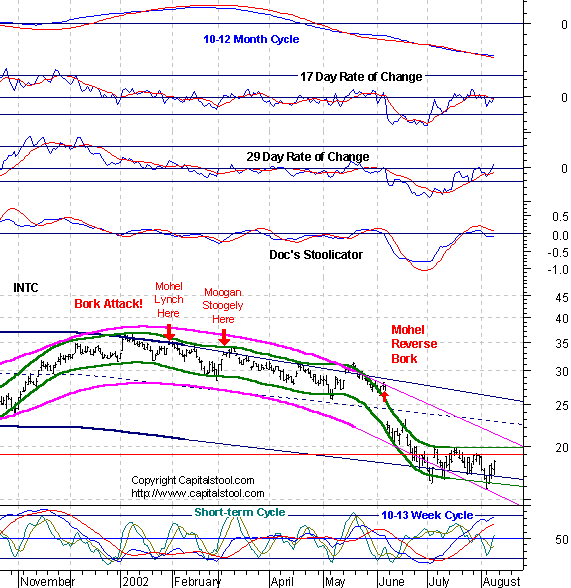
peaks. INTC- Same
chart. Same conclusion. IF it stays in this range it will lead the market
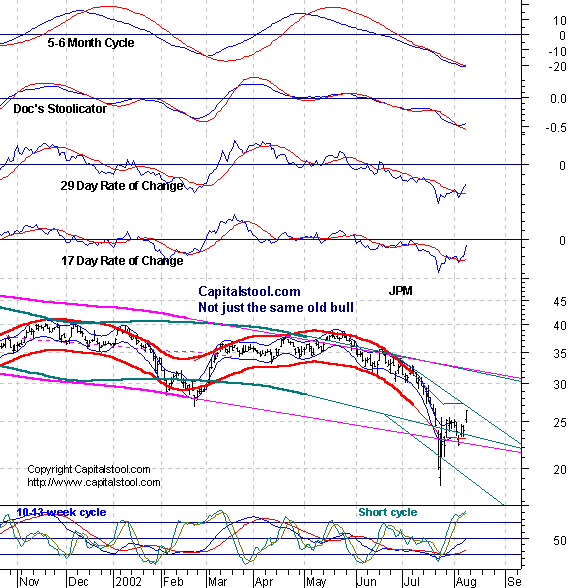
down when the rally ends. JPM- That
IMF bailout wasn't for Brazil. It's for Chase and Fleet Enema, and all the
other scumbags who have fueled this credit bubble. It buys a little time,
that's all. There are two possible scenarios, here. Bearish, and more
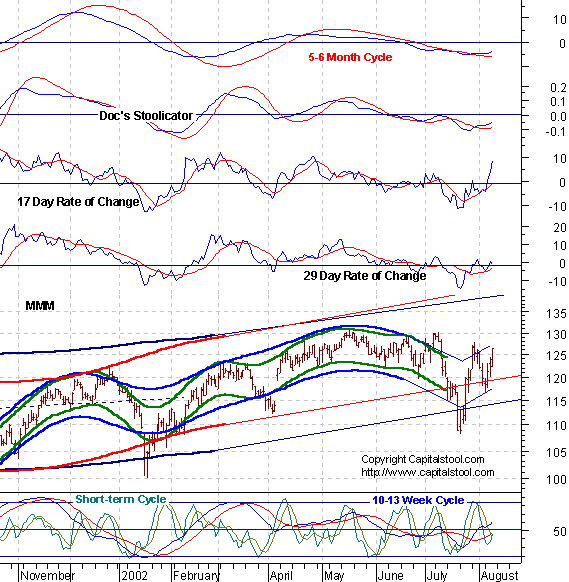
bearish. MMM- The
stage managers favorite prop. They'll use this to churn the market higher.
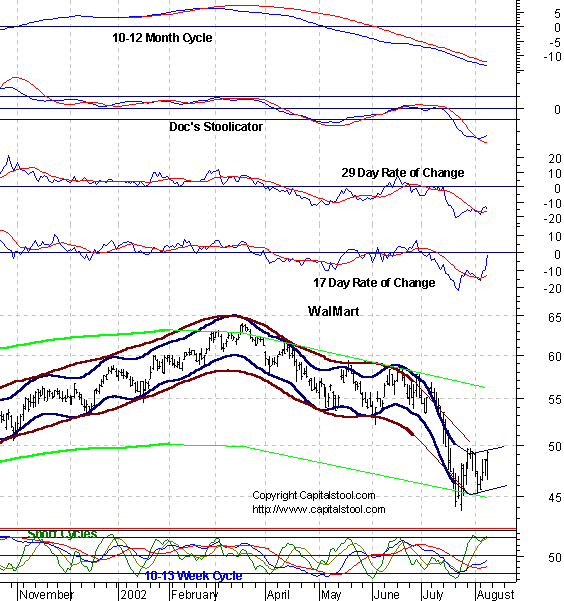
Check out the volatility! Mr. Bill-
Jailbreak! He's trying to go over the wall. Call the cops. Wally will
face his first real test at 50. Is the up phase flat, or really up? See you in Intraday Stool. Dr. Stepan N. Stool Share your thoughts on the Stool Pigeons Wire.
Renewals Welcome, and thank you for subscribing to the Anals of Stock Proctology. Your trial subscription will run for 90 days. At the end of that period your subscription will renew automatically, unless you cancel. If you wish to cancel your subscription use the button below. If you want to renew your subscription do nothing. Your subscription will renew and your credit card or Paypal bank account will be charged. If you want to renew, be sure your credit card information in your Paypal account is current. Paypal will not renew your subscription if the card has expired! Again, thanks for subscribing!
Explanation of Intraday Commentary-Build charts at http://www.livecharts.com. For custom time bars insert a comma after symbol and number of minutes, e.g. compx,90. This will give you a bar chart of the Nas with 90 minutes per bar. The one day cycle is usually most clear with 8 minute bars and 26/18 stochastics. It varies from day to day. Sometimes 6 minutes works best. Experiment to find the best fit for your trading style, and the market's dominant frequency at the time. The goal here is primarily to monitor the condition of the 8 and 13 day cycles. I typically use 90 minute bars with 26/18 stochastics for the 13 day cycle proxy on the indices during regular trading hours. Other cycles use 26/18 stochastics with the following: 8 days- 60 minute bars On the 24 hour futures charts, use a time per bar approximately 3 to 4 times the above number of minutes, to represent the cycles listed above. ABBREVIATIONS: cma: centered moving average |
||||||||||||||||||||||||||||||||||||||||||||||||||||||||||||||||||||||||||||||||||||||||||||||||||||||||||||||||||||||

![[Most Recent HUI from www.kitco.com]](http://www.weblinks247.com/indexes/idx24_hui_en_2.gif)
![[Most Recent XAU from www.kitco.com]](http://www.weblinks247.com/indexes/idx24_sp500_en_2.gif)
![[Most Recent Quotes from www.kitco.com]](http://kitconet.com/charts/metals/gold/t24_au_en_usoz_2.gif)