|
Archives 12/30/01, 1/1/02, 1/2/02, 1/3/02, 1/4/02, 1/7/02, 1/8/02, 1/09/02, 1/10/02, 1/11/02, 1/14/02, 1/15/02, 1/16/02, 1/17/02, 1/18/02, 1/22/02, 1/23/02, 1/24/02, 1/25/02, 1/28/02, 1/29/02, 1/30/02, 1/31/02, 2/1/02, 2/4/02, 2/5/02, 2/06/02, 2/7/02, 2/9/02, 2/11/02, 2/12/02, 2/13/02, 2/14/02, 2/16/02, 2/19/02, 2/20/02, 2/21/02, 2/23/02, 2/25/02, 2/26/02, 2/27/02, 2/28/02, 3/1/02, 3/04/02, 3/05/02, 3/06/02, 3/7/02, 3/10/02,3/11/02, 3/12/02, 3/13/02, 3/14/02, 3/15/02, 3/18/02, 3/19/02, 3/20/02, 3/21/02, 3/22/02, 3/25/02, 3/26/02, 3/28/02, 3/30/02 4/1/02, 4/2/02, 4/3/02, 4/4/02, 4/6/02, 4/8/02, 4/9/02, 4/10/02, 4/11/02, 4/13/02, 4/15/02, 4/16/02, 4/17/02, 4/18/02, 4/20/02, 4/22/02, 4/23/02,4/24/02,4/25/02, 4/26/02, 4/27/02, 4/29/02, 4/30/02 5/01/02, 5/2/02, 5/4/02, 5/6/02, 5/07/02, 5/8/02, 5/09/02, 5/10/02, 5/13/02, 5/14/02, 5/15/02, 5/16/02, 5/17/02, 5/20/02, 5/21/02, 5/22/02, 5/23/02, 5/24/02, 5/28/02, 5/29/02, 5/30/02 6/01/02, 6/3/02, 6/4/02, 6/5/02, 6/6/02, 6/7/02, 6/10/02, 6/11/02, 6/12/02, 6/13/02, 6/14/02, 6/17/02, 6/18/02, 6/19/02, 6/20/02, 6/22/02, 6/24/02, 6/25/02, 6/26/02, 6/27/02, 6/30/02 7/1/02, 7/4/02, 7/5/02, 7/11/02, 7/14/02, 7/15/02, 7/16/02, 7/17/02, 7/18/02, 7/19/02, 7/22/02, 7/23/02, 7/24/02, 7/25/02, 7/27/02, 7/29/02, 7/30/02 8/1/02, 8/3/02, 8/5/02, 8/6/02, 8/7/02, 8/8/02, 8/10/02, 8/12/02, 8/13/02, 8/14/02, 8/15/02, 8/16/02, 8/19/02, 8/20/02, 8/21/02, 8/22/02, 8/23/02, 8/26/02, 8/27/02, 8/28/02, 8/29/02, 8/30/02 9/3/02, 9/4/02, 9/5/02. 9/6/02, 9/9/02, 9/10/02, 9/11/02, 9/12/02, 9/13/02, 9/16/02, 9/17/02, 9/18/02, 9/19/02, 9/20/02, 9/23/02, 9/24/02, 9/25/02, 9/26/02, 9/27/02, 9/30/02 10/1/02, 10/2/02, 10/3/02, 10/4/02, 10/7/02, 10/8/02, 10/9/02, 10/10/02, 10/11/02, 10/14/02, 10/15/02, 10/16/02, 10/17/02, 10/18/02, 10/21/02, 10/22/02, 10/23/02, 10/24/02, 10/25/02, 10/28/02, 10/29/02, 10/30/02, 10/31/02 11/1/02, 11/4/02, 11/5/02, 11/6/02, 11/7/02, 11/8/02, 11/11/02, 11/12/02, 11/13/02, 11/14/02, 11/15/02, 11/18/02, 11/19/02, 11/20/02, 11/21/02, 11/22/02, 11/25/02, 11/26/02, 11/27/02, 11/29/02 12/2/02,
12/3/02, 12/4/02,
12/5/02 1/1/03, 1/2/03, 1/03/03, 1/6/03, 1/7/03, 1/8/03, 1/9/03, 1/10/03, 1/13/03, 1/14/03, 1/15/03, 1/16/03, 1/17/03, 1/21/03, 1/22/03, 1/23/03, 1/24/03, 1/27/03, 1/28/03, 1/29/03, 1/30/03, 1/31/03 2/3/03, 2/4/03, 2/5/03, 2/6/03, 2/7/03, 2/10/03, 2/11/03, 2/12/03, 2/13/03, 2/14/03, 2/18/03
 Doc's view of the Street. |
The Anals of Stock ProctologyPublished weeknights by
8:30PM Happy Acres, Florida Time The American
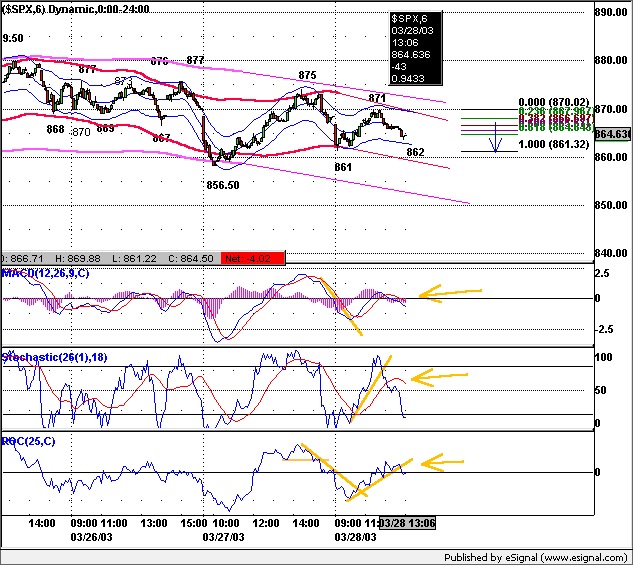
Academy of Stock Proctology and Is your subscription up for renewal? If you want to renew, do nothing, unless your credit card has expired. Please be sure your credit card info is current. If your credit card has expired, you must enter the new expiration date in your Paypal account in order for your subscription to be processed. If you subscribed via Paypal, your subscription will be renewed for one year on the 90 day anniversary of your sign-up and your credit card will be charged. If you want to cancel, use the button at the bottom of the page. This applies only if you subscribed through Paypal. Mailed-in subscriptions are for 1 year. If you subscribed by prior contribution, I will send you a notice before your subscription expires. If you have any questions, see the subscription page and FAQ's. If you can't find the answer, email me. Big Fine Print Doc does not make trading recommendations. This update reports time cycle estimates and centered moving average projections based on the Hurst cycle analysis method, and other techniques. This publication is for entertainment and educational purposes only. Doc assumes no responsibility for the accuracy or inaccuracy of the estimates and projections presented. The market may or may not meet the projections. Stoolies should thoroughly familiarize themselves with the methodology before trading based on this method. Those who do not have the time or inclination to develop a trading strategy based on testing and research should not trade. Trade at your own risk. Yadda yadda. How's your motha? More disclaimers at the bottom of the page. Intraday Updates 2/20/03 12:45 PM The market has stalled with the SPX at support as market makers pin prices while closing options and rolling over options hedges. A 5 hour cycle low is due at 2 PM and the one day cycle low is due around 3:30, but cycles are notoriously unreliable in scam week. They could just as easily cycle every two or 3 hours. Downside cmaps are just below current price levels. One more bounce is likely before prices turn lower in a couple days. A 3 day cycle low is overdue, but 3 and 5 day cycles are interchangeable. The low could be tomorrow. The 8 day cycle is in a sideways down phase, another reason for expecting another rally attempt. All of which could be wrong. That's why we have indicators. No forecast required. Just follow them. 9:15 AM Lots of news this morning. All bad. Thinking about our semi-regular feature here, Oh Yes We Have No Inflation, today's news about the record WHOA!Price index brings a tear to Doc's eye. Phew. No matter. Why? Because, as we all know, news is what, class? That's right NOISE! The market will go upon its merry way, especially in options expiration week, better known to the cognoscenti as scam week. So after a massive overnight ram and jam, suddenly most of that is reversed and the pre market fucutures will close near yesterday's NY close, a non event. Normally when this happens however, someone is going to try to run prices up toward the overnight high which was nearly 852. This time, who knows? More likely at some point they will try to approach the upside cmap of 848. Because it's scam week there's no point in guessing intraday cycle timing, but Doc will guess anyway. The high will be on the open or soon after, and the lows would be due at 2 PM and 3:30, ideally. During scam week, Doc would focus on cmaps rather than time frames. Chart below. Get regular updates throughout the day in Stooltrading. Pre Market Update at 9:15 AM NY time. Intraday Wednesday - The market made its high at the opening bell. The 1 day cycle high expected at 11 AM did not materialize. The up phase simply aborted, out of exhaustion from Tuesday's blowoff. It's also scam week, which makes intraday cyclicality a non issue. The unwinding of hedges and pinning of prices to allow closing positions in an orderly manner dominates the tape. Given all that, the expected 1 day cycle low at 3:30 appeared right on schedule, and the tape was jammed in the last half hour as usual. The 3:30 low was also a 3 day cycle low. The timing of the intraday high tomorrow is anybody's guess, but for now, the cmap looks like 845. The 8 day cycle is also topping out. Cmaps are around 855, but could be pulled down to the high of 852 already hit, if the first few hours are weak tomorrow. There's an outside chance of a run into teh 860's. Get StoolieSignal Special offer here only! The cycle map below is en estimate of how the market might behave over the next few hours. Should the pattern be broken, the map should be redrawn to fit the actual. Cmaps and times shown are guidelines only. Cycles vary in wavelength and amplitude. Directional changes within an hour of the expected turn and a few points of the cmap should be respected. The indicators rule. Times and prices are the projected cycle highs and lows with cmaps. 5-8 Day Cycle______ 2-3 Day Cycle_______ 5 Hr-1 Day Cycle
Wednesday's
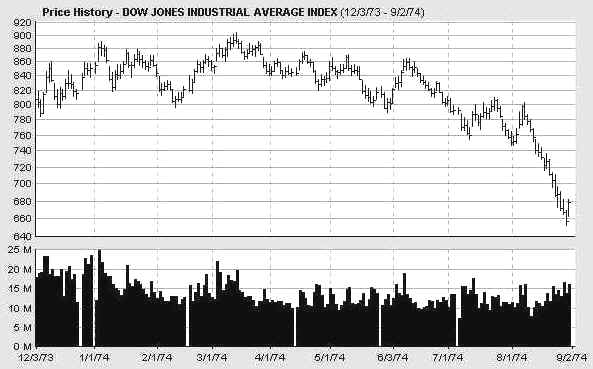
Markets Choose Your History 2/19/03 Last night Doc showed correlations between the length of the period of bubble unwinding and big rallies. Wasn't too good for the bear case. Fortunately history does not always repeat in the same way. What those markets had, which this one hasn't had, is massive waves of panic selling. Cycle projections over the next few weeks are very iffy. The 10-13 week cycle could be forming a long shallow trough if prices can hang around current levels for another week or so. On the other hand, the wave might still plunge if the the market breaks down again within a couple of days. Currently, cmaps indicate a shallow trough that would take the shape of a trading range. Maybe there's something about that 800 number. When you dial 1-800- BEARMKT, it takes a few tries to get through.
In the 1973-74 bear market the Dow called the 800 number four times in seven months before finally getting through at the end of the seventh month.
In today's world, mutual fun portfolio sphincters get paid to buy stocks. They are under a mandate to stay fully invested. That's a relatively new phenomenon historically. Back in the old days, money managers would sell stocks from time to time to raise cash if they didn't like the outlook. They even actually panicked at times. Today, portfolio sphincters never panic. Hell, they never sell! They have two modes, buy, or hold. The public, which ultimately holds the purse strings, has been conditioned to never sell. Furthermore, much of the money is in 401K plans where it is virtually impossible to sell. So yes Virginia, there is manipulation. It's not so much direct gummit interference. Mostly it's a market structure which discourages and inhibits selling at all costs. So what we get is this drip drip bounce drip drip bounce stuff. The bounces are driven by short covering. The drips are driven by a lack of buying in the face of ever present selling due to the underlying cash needs of families and businesses. The stock market is after all, a primary source of funds. What do people do when they need a down payment for a house? Or tuition for their beer-swilling, deadbeat kids in college? That's why Doc thinks this phase of the bear can last a lot longer than 31-39 months. There simply hasn't ever been any liquidation. Willful liquidation is a necessary prerequisite for a big rally because it provides the cash build necessary to fuel a rally. It's a buildup of cash that investors don't actually need for some other purpose. It takes heavy volume selling to get that, and this market is going in the opposite direction volume wise. Yesterday, on Crapvision, Maria Barfaroma was gloating about the huge increase in mutual fun cash positions over the past few months. My goodness, they are all the way up to 4.7% vs. 4.2%. Anyone with half a brain will recognize that this is virtually no change at all, and is effectively zero, given cash levels needed to meet redemptions and pay expenses. Cripes, most of those crooks take out two percent of the portfolio value annually to pay themselves their nice big fat salaries and bonuses. Beside the point of course. The point is that mutual funds actually raised cash in the 70's bear market. Cash in excess of 10% even 15% was the norm. In today's market, as volume declines and prices decline, total cash declines, but cash as a percent of total assets increases as a result of the decline in portfolio value. This is the opposite of liquidation! It is the opposite of what's needed for this market to rally. Below is the new NY Compost Heap Index. It's a float weighted index of Big Bored stocks, excluding all the preferred stock riff raff. So it's a real index now. Looks just like the Sphincters Index as a matter of fact. On this chart you can clearly see that intermediate rallies have been preceded by big volume liquidations. The biggest one came last summer. A second liquidation came in October, and we got a somewhat less robust rally. The recent liquidation was even smaller. It raised enough cash to drive a small rally, that's all. Volume is always difficult to
interpret. But with investible cash scarce, it's going to take a major
selling wave to build up the kind of liquidity needed to power a major
rally. As long as the bagholders remain complacent and do not sell, this
market isn't going anywhere but down. It may seem counterintuitive, but with
no new money coming into the system, they gotta sell before they can buy. Meanwhile
it's just drip drip drip. Doc's Pooper Scooper. Be a Johnny Applestool! Help spread the Stool! Feel free to repost snippets from the Anals on message boards around the web. Just give a link back! Many tanks - Doc The Feed drained just over $5 billion. They added $994 million in permanent money with a coupon pass, and $9 billion in overnight repos. $15 billion in overnight repos expired. Turdsday, the $9 billion in overnight repos along with $9.5 billion in 7 and 8 day repos will expire, as well as the usual 28 day repos in the amount of $4 billion. That's $22.5 billion to be refunded. Doc believes that the enormous Feed on Tuesday was related to the weather in the Northeast, and in New York in particular. Bank transaction clearing operations were effected and market making activities were severely curtailed as well. If indeed, this was the reason, the move should be completely unwound over the next couple of days, with today's drain being the first step. So much for the Snowzilla Feed. Two
trends are evident on the Feed Index, which is the total Fed holdings of
loans and securities. One is the 10% growth trend beginning in May of
2001. The blue channel going back to last December suggests a 5% growth rate. Look at the 4 week moving
average (brown line) and compare it with the slope of the two larger
channels for an indication for whether the slope of short term growth is
slower or faster than the 2 longer term trends. A number of stoolies are convinced there was something diabolical about this Feed. Doc doesn't think so, but we'll know in a day or two if this spike isn't completely reversed. One of your fellow stoolies also pointed out today in IDS, (sorry I forgot who, but in your heart you know you're right. ;-)) that when the Feedometer reaches top of gold channel, the stock market tends to doink. Could be because Al has used up all his bullets, and has to call in some chips. At any rate, Doc does not think the Snowzilla Feed was bullish for stocks. Come to think of it, Doc doesn't think anything is bullish for stocks. Except for maybe a whole lot of selling. The
Feedometer theoretically measures excess Feed available for bond or stock
market jamming. Al selects a trend level he feels is needed to reflatulate
the economy. The Feedometer measures the difference between the apparent
trend target, and actual day to day Feeding (Fastow Feedometer), as well
as a four week moving average (Slowmo Feedometer). A break above the
orange trendline might indicate a more aggressive jamming policy. 10 Year Bond yields fell
sharply. Cmaps up to 13 weeks point only as low as 3.75-3.80. There's no sign the trading range will be broken. Dow Inflatables- The 13 day cycle cmap rose to 8150, but the 4 week cmap is only at 8090. The 4
and 6-7 week cycles frequently combine or alternate, although the 6-7 week
cycle is normally dominant. The chart below has an oscillator which is a composite
of the two cycles. It is still rising but near a top zone. 8050 is resistance.
Getting through there would signal a probably upside extension, and an
early upturn in the 10-13 week cycle. All of Doc's daily cycle charts
are powered by METASTOCK Portfolio Sphincters Index (SPX) and Sentiment Cycle Chart Short Term Cycles The short cycle oscillator rose again and is now in the distribution zone, aka overbought. The 6-7 week cycle is in an up phase, with 4-9 days to go. Cmaps are 853 to 863. This should be starting to churn out of gas. The 6-7 week cycle oscillator on the chart below is still rising sharply as is the 17 day rate of change. It usually takes several days of distribution to reverse the momentum in this situation. The sequence of these indicators turning down, followed by a higher low, will mark a more important cycle low, probably no sooner than mid-March. Normally, a 10-13 week cycle bottom is preceded by a positive divergence in these indicators. The current configuration does not support a big rally. 10-13 Week Cycle Roughly 3 to 6 weeks should remain in the 10-13 week cycle down phase. The cycle oscillators upticked but the 29 day ROC did not confirm. There's still not enough there to signal a cycle upturn. Doc is vigilant, but the conditions are bearly cause for alarm yet. All indicators for this cycle would need to turn to signal a substantial rally. Follow the indicators if it happens. So far, it hasn't. The preliminary downside cmap for this cycle has risen to 810, a level we hit last Turdsday. It would be very unusual to get a big rally without going back for a retest first. For that reason, Doc expects a shallow trough in the 10-13 week cycle over the next month or so, unless the market turns sharply lower right away. Sentiment VIX fell again. (up on the inverted scale chart). In the context of the current cycle, the reading is neutral. The next significant intermediate cycle low should reach at least 50-60. A reading in the low 30's would be a renewal of the intermediate sell signal.
The 17 day rate of change is a proxy for the
6-7 week cycle. The 29 day rate of change is a proxy for the 10-13 week
cycle. The dark blue overlaid line is the 10-13 week cycle
oscillator, while the red line is the 6-7 week cycle oscillator. The VIX
is a measure of implied options volatility reflecting relative fear or
complacency. It is plotted below on an inverse scale to better show the
relationship to the price chart. The "Stool Bands" may reflect
either 6 month or 10-12 month cycles. The Cycle Conditions tables include cycle phase and a wild guess as to number of periods to the next turn, in days for the shortest cycles, weeks (W) or months (M) for the longer ones. This is a fluid exercise, in other words, the projections are likely to be wrong, but they force us to be vigilant for key turning points, and frequently work well enough to prevent costly misreadings. SPX Cycle Conditions as of 2/19/03
PTT - Periods Till Turn Suctor Watch and Stoolwethers- Updated each morning between 8 AM and 9:00 AM NY time. Nasgap Charts The Nas is expected to behave more like the SPX with the continued de-weighting of tech. In the interest of publishing the Anals earlier in the evening Doc is presenting the charts and data without commentary, as it is largely redundant relative to the SPX commentary above. Cycle Chart Nasdaq Cycle Conditions as of 2/18/03
PTT
- Periods Till Turn Suctor Watch and Stoolwethers- Updated each morning between 8 AM and 9:00 AM NY time. Long Bong Hit - See top of page. Golden Stool 2/19/03 PM Gold finally had an
up day, as the chain reaction fallout from last week's surprise increase in margin requirements
began to wind down.
Short cycle cmaps held at 340-345 on a closing basis. Long term upside cmaps have come down, now at only
375 - 385.
The 9 month cycle oscillator looks like a top but the down phase should be
sideways. Short cycle lows are due
this week, and the short cycle oscillator is in the bottoming zone. Doc
thinks accumulation will renew here, but that a trading range of 345-385 could
last for months, or longer.
Long Term HUI Dumpty cracked but didn't break. Very short cycles have turned up but probably won't get far right away. More base building is needed. The 4 month (or 13 week, take your pick) cycle bottom is due. Cmaps are 131-133. Both short cycle and the 13 week cycle oscillators are in the bottom/accumulation zone. HUI Cycle Conditions as of 2/19/03
Uncle Buck's Illness Uncle Buck fell and couldn't get up after jumping out of bed on Tuesday. Short cycle upside cmaps remained at 101, but it may not get there as short cycles appear to be turning down. Buck is still in a 13 week cycle swup in a range of 99 to 101. Chart as of 2/19/03 close Uncle B and SPX (gray line on chart)
usually move together because Uncle Buck's index measures the flow of
capital into and out of US paper assets. The relative magnitude of the
moves varies and wide divergences are followed by convergence.
Central banks intervening to buy dollars are not
going to help stock prices, and cannot drive sustainable advances in the
dollar.
Longer term, Buck is going much lower. Get StoolieSignal Special offer here only! Suctor Watch and Stoolwethers- Now posted on separate page. Updated each morning between 8 AM and 9:00 AM NY time. See you in Intraday Stool. Dr. Stepan N. Stool Share your thoughts on the Stool Pigeons Wire.
Renewals Thank you for subscribing to the Anals of Stock Proctology. Your trial subscription will run for 90 days. At the end of that period your subscription will renew automatically, unless you cancel. If you wish to cancel your subscription use the button below. If you want to renew your subscription do nothing. Your subscription will renew and your credit card or Paypal bank account will be charged. If you want to renew, be sure your credit card information in your Paypal account is current. Paypal will not renew your subscription if the card has expired!
Explanation of Intraday Commentary-Build charts at http://www.livecharts.com. For custom time bars insert a comma after symbol and number of minutes, e.g. compx,90. This will give you a bar chart of the Nas with 90 minutes per bar. The one day cycle is usually most clear with 8 minute bars and 26/18 stochastics. It varies from day to day. Sometimes 6 minutes works best. Experiment to find the best fit for your trading style, and the market's dominant frequency at the time. The goal here is primarily to monitor the condition of the 8 and 13 day cycles. I typically use 90 minute bars with 26/18 stochastics for the 13 day cycle proxy on the indices during regular trading hours. Other cycles use 26/18 stochastics with the following: 8 days- 60 minute bars On the 24 hour futures charts, use a time per bar approximately 3 to 4 times the above number of minutes, to represent the cycles listed above. About centered moving average projections. ABBREVIATIONS: cma: centered moving average |


![[Most Recent HUI from www.kitco.com]](http://www.weblinks247.com/indexes/idx24_hui_en_2.gif)
![[Most Recent XAU from www.kitco.com]](http://www.weblinks247.com/indexes/idx24_sp500_en_2.gif)
![[Most Recent Quotes from www.kitco.com]](http://kitconet.com/charts/metals/gold/t24_au_en_usoz_2.gif)