|
10 Minute Bar Charts 6/25/02 Dow Jokes Inflatables
Archives 12/30/01, 1/1/02, 1/2/02, 1/3/02, 1/4/02, 1/7/02, 1/8/02, 1/09/02, 1/10/02, 1/11/02, 1/14/02, 1/15/02, 1/16/02, 1/17/02, 1/18/02, 1/22/02, 1/23/02, 1/24/02, 1/25/02, 1/28/02, 1/29/02, 1/30/02, 1/31/02, 2/1/02, 2/4/02, 2/5/02, 2/06/02, 2/7/02, 2/9/02, 2/11/02, 2/12/02, 2/13/02, 2/14/02, 2/16/02, 2/19/02, 2/20/02, 2/21/02, 2/23/02, 2/25/02, 2/26/02, 2/27/02, 2/28/02, 3/1/02, 3/04/02, 3/05/02, 3/06/02, 3/7/02, 3/10/02,3/11/02, 3/12/02, 3/13/02, 3/14/02, 3/15/02, 3/18/02, 3/19/02, 3/20/02, 3/21/02, 3/22/02, 3/25/02, 3/26/02, 3/28/02, 3/30/02 4/1/02, 4/2/02, 4/3/02, 4/4/02, 4/6/02, 4/8/02, 4/9/02, 4/10/02, 4/11/02, 4/13/02, 4/15/02, 4/16/02, 4/17/02, 4/18/02, 4/20/02, 4/22/02, 4/23/02,4/24/02,4/25/02, 4/26/02, 4/27/02, 4/29/02, 4/30/02 5/01/02, 5/2/02, 5/4/02, 5/6/02, 5/07/02, 5/8/02, 5/09/02, 5/10/02, 5/13/02, 5/14/02, 5/15/02, 5/16/02, 5/17/02, 5/20/02, 5/21/02, 5/22/02, 5/23/02, 5/24/02, 5/28/02, 5/29/02, 5/30/02 6/01/02, 6/3/02, 6/4/02, 6/5/02, 6/6/02, 6/7/02, 6/10/02, 6/11/02, 6/12/02, 6/13/02, 6/14/02, 6/17/02, 6/18/02, 6/19/02, 6/20/02, 6/22/02
|
The Anals of Stock ProctologyPublished weeknights by
8:30PM Happy Acres, Florida Time The American Academy of Stock Proctology and Dr. Stool will be traveling from June 29 to July 14. The Anals will not be regular during that time. An abbreviated version of the nightly commentary will be published when internet access is available. Doc will post a message on the Stool Pigeons Wire on days the Anals will be published. Intraday updates will not be published. (Last time Doc took a vacation, the market bottomed.) Subscription Renewals are coming up! Did you subscribe nearly 90 days ago? If you want to renew, do nothing. If you subscribed via Paypal, your subscription will be renewed automatically on the 90 day anniversary and your credit card will be charged. If you want to cancel, use the button at the bottom of the page. This applies only if you subscribed through Paypal. Mailed-in subscriptions are for 1 year. If you subscribed by prior contribution, I will send you a notice before your subscription expires. If you have any questions, email me. PM Update 6/26/02 1 PM Terms and methodology Surprise, surprise, but was it really? The market simply behaved in character when it came roaring back in mid morning. The averages didn't get close to the AM cmaps, which were based on the fucutures action, but it bears repeating that this is not unusual, and when they miss the futures lows on the first try, they usually get there on the second. So we'll see. The reaction to the FOMC meeting is going to be real interesting to say the least. Normally, the market goes flat in the hours before the announcement. It should be weak afterwards. The 1 day cycle low was at the open. It looks like the high would be due at 12:30 under normal circumstances. So we should have peaked already. The 3 day cycle low is due tomorrow, the 5 day is just topping out, and the 8 day is in the third day of a swup, if you can believe that. Downside pressure should be increasing for the rest of the week. Upside for the remainder of today should be limited to no more than the earlier highs. If they get beyond that, it's the 6-7 week cycle swup at work. Nothing more. Doc does not make trading recommendations. This update reports intraday time cycle estimates and centered moving average projections based on the Hurst cycle analysis method. Doc assumes no responsibility for the accuracy or inaccuracy of these estimates and projections. The market may or may not meet these projections. New stoolies should thoroughly familiarize themselves with the methodology before trading based on this method. There is no free lunch. Those who do not have the time or inclination to develop a trading strategy based on testing and research should not trade. Trade at your own risk. On the other hand, if you made any extra this week on account of The Stool, send it in!
AM Update 6/26/02 9 AM Terms and methodology Today is the day we've all been waiting for. The AM cmaps are based on the fucutures. The second number is a worst case forecast if the first number breaks. It's not likely, but I'm posting the numbers just in case. I also think the 3 day cmaps will hold. My guess is that there will be a good sized bounce once the panic is exhausted this morning, but that bounce will be heavily sold later. Lots of poodits are hoping for a selling climax this morning. Longer cycle cmaps say there's at least a little more downside. Note that the cmaps for the Nas Comp are derived from the Nas 100 targets and are more likely to be off. Once the market opens I'll take a second look. Also, be aware that stocks do not always follow the fucutures immediately, although if they do not do so initially, there's a good chance that they will on a second wave. Thanks to those of your who have sent in additional contributions! I appreciate your support!
Trend Following (6/25/02) Those of you who complain that Crapvision is always pumping the bull case have it wrong. Crapvision is definitely turning more bearish, featuring more negatives. They breathlessly broke the Worldcom fraud story tonight. Maria talks all the time about the poor market liquidity, and that the cash isn't going to come off the sidelines. Cripes, Herass and Insane had Martin Weiss and two other independent analysts on for 15 minutes tonight. Martin Weiss used to be treated with derision for his extreme bearishness. Now he is an honored statesman. Even nice guy Bull Grifter had an extremely confrontational interview with FedEx CEO Fred Smith earlier today. The media are trend followers like everyone else. They do what the focus groups tell them to do. They have no agenda. Their only aim is to attract an audience and sell advertising. And at this point their advertisers need them more than ever. So crapvision, and SeeBS.Markethype, and Bumberg and all the rest, are now going into their muckraking phase. No one wants to hear the bullshit anymore. The sheeple want validation that Wall Street is full crooks. That way they can rationalize their own stupidity. So that's what crapvision will give them. Just as if they were reporting it straight all along. Whatever sells best. Eventually they'll go off the air, but for now, they'll follow the crowd. Which brings up another point -- sentiment. Sentiment indicators follow the trend, just like the media. As this secular bear market hangs around longer and longer, (Richard Rodgers' statement that it's in the third inning seems about right) sentiment numbers will tilt increasingly toward reflecting greater and greater bearishness. That is normal. It is NOT a contrary indicator. Until the late 1990s we never before saw the kinds of bullishness that market the sentiment numbers in the final phase of the bubble. It took years of ever more bullish sentiment readings before the market finally turned. And sentiment continued to get even more bullish after the market topped. The sentiment data is meaningless in raw form. Sentiment moves in trends and cycles, just like stock prices. Sentiment follows stock prices, more often than not. If you want to devote a lot of time and effort researching sentiment that's fine. But understand that sentiment needs to be analyzed in terms of trends, cycles, and timing indicators, just like prices. Most importantly, sentiment is never any better than a confirming indicator to what the price action tells you. It is simply a means of fleshing out the picture, of making the story a little more interesting. But you can absolutely trade successfully simply by focusing on the price action. Sentiment analysis is no more than a harmless diversion if done properly. The VIX is not a black box. The Feed did $3 billion in overnight repos. There were no rollovers. The total Feed index, the total of loans and securities held by the Fed, rose again, and is now near the center of its 10% growth channel. This steady pumping by the Feed may be contributing to the profitless economic recovery, but it is not helping the market at all. Nor is additional pumping likely to. For the Fed, the risk is that they keep pumping right up to the top of the channel, the stock market doesn't respond, the dollar collapse accelerates, and bonds start to join in the collapse. Then once they've pumped to the top of their target range, what do they do? Pump more? As for what they say tomorrow, who
cares? The Slow Feedometer, which is the
17 day average of the daily excess Feed available to jam the market,
dipped again, in spite of the uptick in the fast feedometer (grey
line). Although the excess Feed has been generally rising since mid-May,
it's done nothing to support stock prices. This looks like a replay of
last summer. The Fed can force feed, but it can't force the players to
stick it where the sun never shines. It's called pushing on a string,
ladies and germs. When the Gang of 22 sees an opening, they'll put it to
work in the stock market. For now, the play is in bonds, and even that's
starting to look a little shaky. The seeds of reversal are beginning to
sprout on the bond market chart.
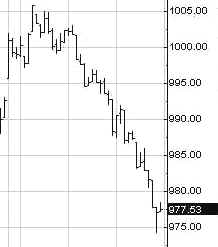
Portfolio Sphincters Index (SPX) and Sentiment The Sphincters Index unloaded for a loss of 16, after being up 14 in the morning. It is now within 11 points of the September 21 closing low of 965.80. The breakdown is inevitable. The dollar has broken its September lows decisively. The Nasdaq 100 has broken its September low decisively. The die is cast. The 17 day rate of change, which represents the 6-7 week cycle, broke to a new low in this cycle. The 6-7 week oscillator superimposed on the price chart, inexplicably is still heading up. This reflects an ever so slight diminution of downward momentum and signals that, yes, Virginia, this is the 6-7 week cycle up phase. We hate to think what comes next. The 10-13 week cycle oscillator (navy) is plunging, and has a long way to go before reaching a bottoming zone. The 29 day rate of change finally broke down from that flat pattern in negative territory. This means the 10-13 week cycle is beginning an acceleration into its final weeks. The VIX rose to 31.47. On the inverted scale chart, as the Stool bands trend lower, VIX is riding the lower half of the channel, but it is by no means at an extreme. Fear levels remain relatively moderate and are consistent with the market's trend. At a major low, extreme fear readings will persist for several days. A buy signal will not be generated until the index drops below the blue band for several days and then reverses. In another words, it does not pay to anticipate. MaxVIX will not be recognizable until after the turn. Always keep in mind that sentiment is, at best, coincident, and often lags. It is merely a tool to help in our understanding of the environment. Sentiment indicators are not magic bullets. They are interesting, but they can just as easily be ignored. Price indicators tell us all we need to know. The blue channel lines are the extension of a linear
regression channel from the February and May 2001 highs. The 6 month cycle
oscillator is barely drifting lower. A
flat trend in negative territory signifies a stable downtrend. The trading
stoolicator is signaling a downward acceleration. The short cycle oscillator
is plunging. The 10-13 week cycle oscillator is trending
gradually lower. The centered moving average projections fell to 900-915,
due in 3 to 6 weeks. This is going to get very ugly the next few days. The next fibo stopping point is 950. The Cycle Conditions tables include cycle phase and a wild guess as to number of periods to the next turn, in days for the shortest cycles, weeks (W) or months (M) for the longer ones. This is a fluid exercise, in other words, the projections are likely to be wrong, but they force us to be vigilant for key turning points, and frequently work well enough to prevent costly misreadings. SPX Cycle Conditions as of 6/25/02
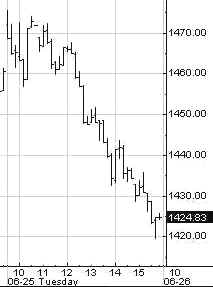
PTT - Periods Till Turn Nasgap Charts The Nasgap
blew out 36 chunks, after chugging 15 points higher in the morning. It is
dead on the September 21 close of 1423. One can only wonder what kind of
gap we will see in the morning after the horrible news from Micron and
Worldcom. Let's just say that it should start out with a 13 at the
beginning. And the luck will get worse from there. The 6 month
cycle time series is just drifting lower. The 10-13 week cycle
oscillator and the trading stoolicator are steadily declining. The
market's been trending and it sure looks like that trend is about to
accelerate down. The Nascrap
100 continues to lead the way as it always has, through both the bull and
bear cycles. The September lows are but a faint memory. The next
fibo level beyond the 1387 low is 1365. That could be the opening print
tomorrow. Short covering will almost certainly come in there, only to
reload later on a bounce. If we get one. Nasdaq Cycle Conditions as of 6/25/02
PTT
- Periods Till Turn AM Edition Features (Previous) We continue to see signs of
possible reversal to the upside. Today could change that. The bond market
response to the carnage in stocks will be of great interest. SOX- The
chart can't keep up with the speed of the breakdown. And it's just getting
started. The telecom
group illustrates why Doc always says to short the weak groups. They get
weaker. Those early June sell signals could not have been more timely. The
bottom is dropping out this morning. Where's Dover Sole? Who knows? The
one-year cycle cmap is 260. The 4 year cycle cmap is 100. Now, it's
time for our review of The Street's favorite groups. By definition, when
The Street is universally bullish on something, it's a short. Aerospace?
Top! Small Crap?
Major breakdown. Bonks? Major
reversal. Consumer
stocks? Make me laugh. Cramer's been screaming to buy these for months.
Look at that Hunchback reversal. Retail?
Completing top. Bubble
Builders? WHOPsaw! Remember what that means? A whipsaw, only bigger. It's
when a stock breaks out above key resistance, then immediately reverses.
Almost always a top. HMO's?
"What'd I tell ya?" says Doc. Wall Street's been loving the
HMO's. The public hates HMO's. The public wins. Wally has
sell signals. Would you look at this? The whole chart is a giant
Hunchback! Mr. Bill.
Time's up for the swup. Houston, we have sell signals. Market Maker
Management- Another top pattern coming to fruition. Gotta be careful
though. It's the stage manager's number one prop, the first one they jam. GE- The
business radio talk show hosts' favorite. Downturns in intermediate cycle
indicators. The next two weeks could be ghastly. Stoolie bontchev, who is a very fine technician and chartist, sent in a request for LMT. He said,
Doc would agree. The trend is intact, but LMT will not buck the market forever. Doc doesn't like Aerospace because it is universally loved by Wall Street. Therefore, by definition, it must be wrong. Expect LMT to build a top in the weeks and months ahead.. By the way, 70 was the one year cycle centered moving average projection.
Henceforth and forevermore, if you would like to request a "stock o'der", please post your request in Dear Dr. Stool. If you have not already registered for the message board, please do so. The only required info is user name and password which you choose yourself, and your email address, which you can keep private by selecting the keep private option. Doc looks forward to featuring your ideas. We've had some good ones! Uncle Buck's Illness
Buck is trading near 106 this morning. Off the bottom of the chart. Based
on the downturn in the intermediate cycle ozzie, this is just starting. Golden Stool The buy
signals in the oscillators are looking real good this morning. See you in Intraday Stool. Dr. Stepan N. Stool Let me know what you think on the Stool Pigeons Wire. Renewals Welcome, and thank you for subscribing to the Anals of Stock Proctology. Your trial subscription will run for 90 days. At the end of that period your subscription will renew automatically, unless you cancel. If you wish to cancel your subscription use the button below. If you want to renew your subscription do nothing. Your subscription will renew and your credit card or Paypal bank account will be charged. Again, thanks for subscribing!
Explanation of Intraday Commentary-Build charts at http://www.livecharts.com. For custom time bars insert a comma after symbol and number of minutes, e.g. compx,90. This will give you a bar chart of the Nas with 90 minutes per bar. The one day cycle is usually most clear with 8 minute bars and 26/18 stochastics. It varies from day to day. Sometimes 6 minutes works best. Experiment to find the best fit for your trading style, and the market's dominant frequency at the time. The goal here is primarily to monitor the condition of the 8 and 13 day cycles. I typically use 90 minute bars with 26/18 stochastics for the 13 day cycle proxy on the indices during regular trading hours. Other cycles use 26/18 stochastics with the following: 8 days- 60 minute bars On the 24 hour futures charts, use a time per bar approximately 3 to 4 times the above number of minutes, to represent the cycles listed above. ABBREVIATIONS: cma: centered moving average |
|||||||||||||||||||||||||||||||||||||||||||||||||||||||||||||||||||||||||||||||||||||||||||||||||||||||||||||||

![[Most Recent XAU from www.kitco.com]](http://www.weblinks247.com/indexes/idx24_nasdaq_en_2.gif)
![[Most Recent XAU from www.kitco.com]](http://www.weblinks247.com/indexes/idx24_sp500_en_2.gif)
![[Most Recent Quotes from www.kitco.com]](http://kitconet.com/charts/metals/gold/t24_au_en_usoz_2.gif)
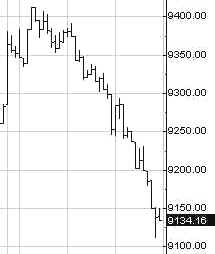
 They
played a little pretend with the Dow again today, first pushing to a gain
of 135, forcing some shorts to cover, and then as usual, they flushed. The
Dow closed with a loss of 155, at 9126. Can you imagine? 9000 will soon be
a memory.
They
played a little pretend with the Dow again today, first pushing to a gain
of 135, forcing some shorts to cover, and then as usual, they flushed. The
Dow closed with a loss of 155, at 9126. Can you imagine? 9000 will soon be
a memory.