|
Archives 12/30/01, 1/1/02, 1/2/02, 1/3/02, 1/4/02, 1/7/02, 1/8/02, 1/09/02, 1/10/02, 1/11/02, 1/14/02, 1/15/02, 1/16/02, 1/17/02, 1/18/02, 1/22/02, 1/23/02, 1/24/02, 1/25/02, 1/28/02, 1/29/02, 1/30/02, 1/31/02, 2/1/02, 2/4/02, 2/5/02, 2/06/02, 2/7/02, 2/9/02, 2/11/02, 2/12/02, 2/13/02, 2/14/02, 2/16/02, 2/19/02, 2/20/02, 2/21/02, 2/23/02, 2/25/02, 2/26/02, 2/27/02, 2/28/02, 3/1/02, 3/04/02, 3/05/02, 3/06/02, 3/7/02, 3/10/02,3/11/02, 3/12/02, 3/13/02, 3/14/02, 3/15/02, 3/18/02, 3/19/02, 3/20/02, 3/21/02, 3/22/02, 3/25/02, 3/26/02, 3/28/02, 3/30/02 4/1/02, 4/2/02, 4/3/02, 4/4/02, 4/6/02, 4/8/02, 4/9/02, 4/10/02, 4/11/02, 4/13/02, 4/15/02, 4/16/02, 4/17/02, 4/18/02, 4/20/02, 4/22/02, 4/23/02,4/24/02,4/25/02, 4/26/02, 4/27/02, 4/29/02, 4/30/02 5/01/02, 5/2/02, 5/4/02, 5/6/02, 5/07/02, 5/8/02, 5/09/02, 5/10/02, 5/13/02, 5/14/02, 5/15/02, 5/16/02, 5/17/02, 5/20/02, 5/21/02, 5/22/02, 5/23/02, 5/24/02, 5/28/02, 5/29/02, 5/30/02 6/01/02, 6/3/02, 6/4/02, 6/5/02, 6/6/02, 6/7/02, 6/10/02, 6/11/02, 6/12/02, 6/13/02, 6/14/02, 6/17/02, 6/18/02, 6/19/02, 6/20/02, 6/22/02, 6/24/02, 6/25/02, 6/26/02, 6/27/02, 6/30/02 7/1/02, 7/4/02, 7/5/02, 7/11/02, 7/14/02, 7/15/02, 7/16/02, 7/17/02, 7/18/02, 7/19/02, 7/22/02, 7/23/02, 7/24/02, 7/25/02, 7/27/02, 7/29/02, 7/30/02 8/1/02, 8/3/02, 8/5/02, 8/6/02, 8/7/02, 8/8/02, 8/10/02, 8/12/02, 8/13/02, 8/14/02, 8/15/02, 8/16/02, 8/19/02, 8/20/02, 8/21/02, 8/22/02, 8/23/02, 8/26/02, 8/27/02, 8/28/02, 8/29/02, 8/30/02 9/3/02, 9/4/02, 9/5/02. 9/6/02, 9/9/02, 9/10/02
|
The Anals of Stock ProctologyPublished weeknights by
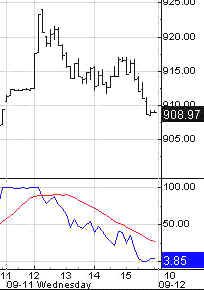
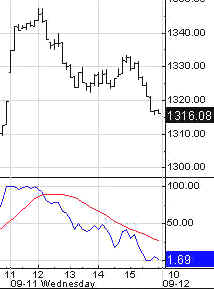
8:30PM Happy Acres, Florida Time The American Academy of Stock Proctology and Is your subscription up for renewal? If you want to renew, do nothing, unless your credit card has expired. Please be sure your credit card info is current. If your credit card has expired, you must enter the new expiration date in your Paypal account in order for your subscription to be processed. If you subscribed via Paypal, your subscription will be renewed for one year on the 90 day anniversary of your sign-up and your credit card will be charged. If you want to cancel, use the button at the bottom of the page. This applies only if you subscribed through Paypal. Mailed-in subscriptions are for 1 year. If you subscribed by prior contribution, I will send you a notice before your subscription expires. If you have any questions, see the subscription page and FAQ's. If you can't find the answer, email me. Update 9/12/02 12:30 PM Terms and methodology The 1 day cycle high was due at noon, and a 5 hour high is due between 12:30 and 1:30. The highs of Nas 1298 and SPX 897 should hold. Those two cycles could line up for an afternoon tanking. It's too early for downside cmaps on the 1 day cycle. Cmaps derived from a two day cycle, the low of which would be hit late today or early tomorrow are Nas 1273, SPX 885, and NDX 905. The downside cmaps for the 8 day cycle are preliminary.
Update 9/12/02 9:45AM The open should have been the 1 day cycle low. But it now appears the 5 hour high was at 3 PM, and that the 5 hour low isn't due until noon. At that point, the 1 day cycle should be topping. The cycles are juxtaposed. When this happens, a 3 hour choppy wave often results. The AM low cmaps were slightly too conservative. The Nas could have a 5 hour cycle low of 1292 and the NDX 923. The SPX cmap drops to 897. Update 9/12/02 9:15AM Terms and methodology A concurrent 5 hour and 1 day cycle low is due on the open. After that look for a rebound with highs likely at 10:30 and or noon. Mid-day update will be around 12:30.
Doc does not make trading recommendations. This update reports intraday time cycle estimates and centered moving average projections based on the Hurst cycle analysis method. Doc assumes no responsibility for the accuracy or inaccuracy of these estimates and projections. The market may or may not meet these projections. New stoolies should thoroughly familiarize themselves with the methodology before trading based on this method. There is no free lunch. Those who do not have the time or inclination to develop a trading strategy based on testing and research should not trade. Trade at your own risk. This Too Shall Pass (9/11/02) It's difficult to write cynically on a day when we remember the deaths of so many innocents. We have all suffered, and we should recognize that Wall Street has suffered more than everyone else. I make fun of the people there each and every day. I've been there. I know. But these are still human beings, and in spite of my criticism of them, they deserve a measure of compassion for what they have been through. Just as we felt compassion when Michael Corleone offed Fredo. It certainly was wonderful to see the operation of unfettered free markets today. Just a day of honest brokers executing trades without interference or manipulation. God bless Wall Street and God Bless the folks at Nasdaq, who couldn't wait a stinkin' hour, while the dead, including many of Nasdaq's own, were being honored. The Feed took no action today, and nothing was expiring. $6 billion in 2 day repos will expire Thursday, along with the usual $4 billion in 28 day repos. That's a lot of dough to roll. Three trends evident on the Feed Index. One is the 10% growth trend beginning in May of 2001. Feed growth has recently been at or below the lower boundary of that trend. The blue channel going back to last December suggests that Al may now be targeting an 8% growth rate. Then there's the golden box which says he's stopped growing Feed altogether over the last three months. Doc
suspects that the 8% growth channel will be the path for awhile. To
his simple mind this remains a hyper-inflationary policy, great for gold.
Many of you have tried to explain why we will have deflation. Doc isn't
saying you're wrong. He's just not not smart enough to understand the
reasoning behind the arguments. Maybe if the money supply were imploding,
but it's snot. The Feedometer, which theoretically
measures excess Feed available for bond or stock market jamming, remains
in the lower portion of its 3 month range. Al does not appear to be using
monetary policy to support the market at this point. To the contrary, it
looks like they used the recent rally as a cover for slowing Feed growth a
bit. On Thursday, they will have a lot of Feed to renew. They'll probably
do most of it, if not all, but won't add too much beyond the rollover. Today, we got our weekly report
for last week from the Mortgage Bonkers Ass., otherwise known as Don
Corleone Inc. When it comes to rackets, stock borkers look like pikers
next to these guys. It looks like up, up, and away for the momo gauge
application index. The MBA's at the MBAA use a seasonal adjustment factor which
is way out of whack when it comes to holiday weeks. Indeed this looks like
a massive breakout, but let's wait until next week to be sure. This is so
big, you can't even call it a bubble anymore. It's a raging inferno, a
boiling cauldron of flaming hot gases. If our theory is correct, we are
going to see a veritable explosion in the monetary aggregates in the next
two months. Gold should go through the roof. As for stocks, they may get
some support, but the public is too busy chasing runaway residential real
estate inflation to give a damn anymore. The vast majority of the action is
in refis. That's where the breakout is. More than 72% of the new
applications are refi. Purchases have not gotten past the May-July highs.
(The index is seasonally adjusted.) We need to keep an eye on bond yields,
they were up 8 bps today. This could be the final blowoff in this
boom. Bond yields are damned close to a
major infartion point, regardless of the fact that long term cmaps may be
a hair lower. This move has all the earmarks of the final blowoff of a
massive bubble. Don't forget, bonds have been in a secular bull market for
longer than stocks. The buying of bonds has everything to do with a
mortgage derivatives meltup. This too shall pass.
All of Doc's
cycle charts
are powered by METASTOCK Portfolio Sphincters Index (SPX) and Sentiment The VIX rose to 37.23. The 30.96 reading on August 22 was the 10-13 week cycle high. The indicator may make several touches of that band before the 6 month cycle up phase is complete. Or it may not. A move below 35 could mark a short term high, but short cycle tops normally last up to a week, so there's no need to jump the gun. A reversal from here would also confirm a short term top. The 17 day rate of change, a proxy for the 6-7 week cycle, is still holding in a flat pattern in neutral territory. The superimposed 6-7 week cycle oscillator (red line) upticked Monday from the level which launched previous bounces, but now it's just laying there. That's a bit odd. It could mean one of a number of things, one of which would be a crash, and the other a delayed blastoff. Too bad they're diametrically opposed. The 10-13 week cycle oscillator (dark blue)
is unambiguous. It should be at least
4 weeks, and as much as 7 weeks, before a low in this cycle. Doc had
expected the down
phase would be sideways, with prices breaking
lower only near the end of the cycle. Now he's not so sure that it might
not break down sooner, given the failure of the 6-7 week cycle people to generate
much buying enthusiasm. If the 17 day rate of change breaks
down instead of up, that's a failed up phase and a sign that the market is
trending down. If both
the 17 day and 29 day R.O.C.'s drop below zero, get shorty. Look to
shorter cycles for the best entry timing. The 6 month cycle oscillator remains in a weak up phase. The slope of the up phase isn't even positive at this point. If that persists for a few more weeks, when this thing turns down, there is going to be some mind boggling damage. There is time to observe, however. No need to jump the gun. The trading stoolicator is heading down. As currently configured, it mimics the 10-13 week cycle. The 10-13 week cycle oscillator topped out last week, and is gradually moving lower. It can fall a long way, but it's too early to say for sure whether or not this is a sideways up phase, or one which will have a more negative slope. Keep an eye on both the 17 and 29 day rates of change for any sign that the market is either strengthening or weakening. The short cycle oscillator is correcting upward. The best short sales are usually when this indicator gets to 70 or higher, and the 10-13 week oscillator is declining. We're getting close to that condition. Short term upside cmaps have
been met. A pullback should be getting under way. It's too early to
project downside cmaps. Doc plotted a linear
regression channel from The March 2000 top to the April 2001 low. Then he
extrapolated that forward from the second red vertical line. Then he drew
a series of other linear regression channels with a variety of starting
and ending points. Other than increasing wave amplitude, this sucker
hasn't deviated one iota from the trend that was established in the first
12 months of the bear market. Now, if it doesn't get through the central
regression line within a few weeks, that is a clear sign that things are
getting worse.
Fiber Nacho Dump- Support levels and downside targets.
Fiber Nacho Reflux- Resistance levels and upside targets The Cycle Conditions tables include cycle phase and a wild guess as to number of periods to the next turn, in days for the shortest cycles, weeks (W) or months (M) for the longer ones. This is a fluid exercise, in other words, the projections are likely to be wrong, but they force us to be vigilant for key turning points, and frequently work well enough to prevent costly misreadings. SPX Cycle Conditions as of 9/11/02
PTT - Periods Till Turn Nasgap Charts The Nas pooped out Wednesday. The 17 day rate of change is treading water and the 29 day rate of change is slowly rolling over. A move of these two momentum indicators off the neutral line in the same direction will signal a move with some staying power, regardless of direction. It's beginning to look like that will be down. The 10-13 week cycle
is in a down phase that should
last 4-6 weeks. The 6-7 and 10-12 month cycles are still headed up, but
the slope of the up phase is flat, at best. The 4 and 6-7 week cycles are
supposed to be in an up phase, but there are hints of early failure. A lot
of people are looking for a weak October with new lows. Just because many
people expect something doesn't mean it can't happen. The way the
indicators are lined up now, it looks possible. But the verdict isn't
sealed, and we can afford to wait a bit to see what the next few days tell
us.
Fiber Nacho Dump- Support levels and downside targets.
Fiber Nacho Reflux- Resistance levels and upside targets Nasdaq Cycle Conditions as of 9/11/02
PTT
- Periods Till Turn AM Edition Features (Previous) These features are in morning edition, published around 9 AM ET US, or the Saturday Weak End Edition, published, uh, let's see, Saturday! Golden Stool A 13 day cycle
low is due. The downside cmap has risen to 128. might not get there. The
10-13 week cycle cmap is now 154. The 10-13 week cycle ozzie is in the
topping area, while the 10-12 month cycle oscillator looks like it may be
bottoming. A pullback or consolidation is due. That should be the
precursor to the next leg up. Uncle Buck's Illness
Uncle's 6 Month Cycle recovery is approaching a peak. So is his short
cycle uptick For most, conflicting cycles. If short cycle up phases fail early the picture will resolve to the downside, and the declining 10-13 week cycle will govern. Biodrech Bonkers Consumer Druggies Retail Illness Sickness and
Disease Housing Bubble Energy Tyrannies Small Craps- This could get
ugly. The techies have a similar setup, with rising short cycle indicators while 10-13 week cycle turns down. SOX Soft Where Nutworkers Internuts Telecommies Stoolwethers Citicorpse- Short cycle
topping will lead to bottom dropping. JPM- 10-13 week and short
cycle topping will also lead to bottom dropping. Fannie-10-13 week topping
will lead to Fannie dropping. The Other General- Another
finance company. Same comments. General Custer- 6 Month and
10-13 week cycles have peaked. Slowmo bumpy decline under way. Wally gave the Finger
yesterday. Is it "the" top? PiG- Lipstick ready to wear
off. Market Maker Manipulations-
Looks like another lower high AhOL- Second high failing
at top of channel is classic short signal. AMZN- 10-13 and short cycle
ozzies in top zone with price at top of channel. Time to go down. CSCO- Short cycle topping
follows 10-13 week cycle high. Will head lower. DELL- Farmer hanging in. Tell- Short cycle topping
leads to bottom dropping. Mr. Bill- Rare Double
Whopsaw signals major top. BM- Yes it is. See you in Intraday Stool. Dr. Stepan N. Stool Share your thoughts on the Stool Pigeons Wire.
Renewals Welcome, and thank you for subscribing to the Anals of Stock Proctology. Your trial subscription will run for 90 days. At the end of that period your subscription will renew automatically, unless you cancel. If you wish to cancel your subscription use the button below. If you want to renew your subscription do nothing. Your subscription will renew and your credit card or Paypal bank account will be charged. If you want to renew, be sure your credit card information in your Paypal account is current. Paypal will not renew your subscription if the card has expired! Again, thanks for subscribing!
Explanation of Intraday Commentary-Build charts at http://www.livecharts.com. For custom time bars insert a comma after symbol and number of minutes, e.g. compx,90. This will give you a bar chart of the Nas with 90 minutes per bar. The one day cycle is usually most clear with 8 minute bars and 26/18 stochastics. It varies from day to day. Sometimes 6 minutes works best. Experiment to find the best fit for your trading style, and the market's dominant frequency at the time. The goal here is primarily to monitor the condition of the 8 and 13 day cycles. I typically use 90 minute bars with 26/18 stochastics for the 13 day cycle proxy on the indices during regular trading hours. Other cycles use 26/18 stochastics with the following: 8 days- 60 minute bars On the 24 hour futures charts, use a time per bar approximately 3 to 4 times the above number of minutes, to represent the cycles listed above. ABBREVIATIONS: cma: centered moving average
|
|||||||||||||||||||||||||||||||||||||||||||||||||||||||||||||||||||||||||||||||||||||||||||||||||||||||||||||||||||||

![[Most Recent HUI from www.kitco.com]](http://www.weblinks247.com/indexes/idx24_hui_en_2.gif)
![[Most Recent XAU from www.kitco.com]](http://www.weblinks247.com/indexes/idx24_sp500_en_2.gif)
![[Most Recent Quotes from www.kitco.com]](http://kitconet.com/charts/metals/gold/t24_au_en_usoz_2.gif)