|
Archives 12/30/01, 1/1/02, 1/2/02, 1/3/02, 1/4/02, 1/7/02, 1/8/02, 1/09/02, 1/10/02, 1/11/02, 1/14/02, 1/15/02, 1/16/02, 1/17/02, 1/18/02, 1/22/02, 1/23/02, 1/24/02, 1/25/02, 1/28/02, 1/29/02, 1/30/02, 1/31/02, 2/1/02, 2/4/02, 2/5/02, 2/06/02, 2/7/02, 2/9/02, 2/11/02, 2/12/02, 2/13/02, 2/14/02, 2/16/02, 2/19/02, 2/20/02, 2/21/02, 2/23/02, 2/25/02, 2/26/02, 2/27/02, 2/28/02, 3/1/02, 3/04/02, 3/05/02, 3/06/02, 3/7/02, 3/10/02,3/11/02, 3/12/02, 3/13/02, 3/14/02, 3/15/02, 3/18/02, 3/19/02, 3/20/02, 3/21/02, 3/22/02, 3/25/02, 3/26/02, 3/28/02, 3/30/02 4/1/02, 4/2/02, 4/3/02, 4/4/02, 4/6/02, 4/8/02, 4/9/02, 4/10/02, 4/11/02, 4/13/02, 4/15/02, 4/16/02, 4/17/02, 4/18/02, 4/20/02, 4/22/02, 4/23/02,4/24/02,4/25/02, 4/26/02, 4/27/02, 4/29/02, 4/30/02 5/01/02, 5/2/02, 5/4/02, 5/6/02, 5/07/02, 5/8/02, 5/09/02, 5/10/02, 5/13/02, 5/14/02, 5/15/02, 5/16/02, 5/17/02, 5/20/02, 5/21/02, 5/22/02, 5/23/02, 5/24/02, 5/28/02, 5/29/02, 5/30/02 6/01/02, 6/3/02, 6/4/02, 6/5/02, 6/6/02, 6/7/02, 6/10/02, 6/11/02, 6/12/02, 6/13/02, 6/14/02, 6/17/02, 6/18/02, 6/19/02, 6/20/02, 6/22/02, 6/24/02, 6/25/02, 6/26/02, 6/27/02, 6/30/02 7/1/02, 7/4/02, 7/5/02, 7/11/02, 7/14/02, 7/15/02, 7/16/02, 7/17/02, 7/18/02, 7/19/02, 7/22/02, 7/23/02, 7/24/02, 7/25/02, 7/27/02, 7/29/02, 7/30/02 8/1/02, 8/3/02, 8/5/02, 8/6/02, 8/7/02, 8/8/02, 8/10/02, 8/12/02
|
The Anals of Stock ProctologyPublished weeknights by
8:30PM Happy Acres, Florida Time The American Academy of Stock Proctology and Is your subscription up for renewal? If you want to renew, do nothing, unless your credit card has expired. Please be sure your credit card info is current. If your credit card has expired, you must enter the new expiration date in your Paypal account in order for your subscription to be processed. If you subscribed via Paypal, your subscription will be renewed for one year on the 90 day anniversary of your sign-up and your credit card will be charged. If you want to cancel, use the button at the bottom of the page. This applies only if you subscribed through Paypal. Mailed-in subscriptions are for 1 year. If you subscribed by prior contribution, I will send you a notice before your subscription expires. If you have any questions, see the subscription page and FAQ's. If you can't find the answer, email me. Revised cmaps for 1 day cycle high (2:30) are 1290, SPX 892, NDX 935. If they keep going, the 8 day cycle has reversed to the upside. SO far no upturn in8 day ozzies, so the assumption is that this is a blowout that will fail. PM Update 8/14/02 1:00 PM Terms and methodology It's still a mish mash out there. Downside cmaps for the 8 day cycle have been hit for Nas and NDX, although the lows aren't due for a day or two. SPX 8 day cycle cmap is a bit lower. Upside cmaps for the 1 day cycle have been hit, with the peak apparently under way, and a retest due at 2:30. The lack of impetus in either direction, and the narrow range of cmaps, means the aimless meandering is likely to go continue. Yecch. Doc does not make trading recommendations. This update reports intraday time cycle estimates and centered moving average projections based on the Hurst cycle analysis method. Doc assumes no responsibility for the accuracy or inaccuracy of these estimates and projections. The market may or may not meet these projections. New stoolies should thoroughly familiarize themselves with the methodology before trading based on this method. There is no free lunch. Those who do not have the time or inclination to develop a trading strategy based on testing and research should not trade. Trade at your own risk.
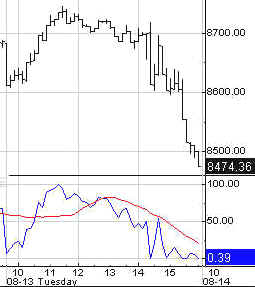
AM Update 8/14/02 9:20 AM Terms and methodology The jammed the fucutures this morning. Ho hum. It doesn't negate the downside cmaps due on the open. Should get a bounce or two, estimated to be just after the open. 1 day high looks to be due at 11 AM. The 8 day cycle is down, but at this point the cmaps point no lower than the lows due this morning. Doesn't yet look like a good place to be aggressively short.
Take That You Dork! (8/13/02) Shrub had an economic pow wow in Waco Texas, of all places. Perhaps the symbolism wasn't lost on Wall Street. The Feds came out of the OTHER meeting in the afternoon, made its announcement, and the market burned down. Doc thinks the market may have just signaled the election results, but beyond that he's hesitant. While very short term indicators turned down, and some long term indicators haven't confirmed last month's low, intermediate indicators are still rising. The very short term stuff is headed down for a couple of days, jams notwithstanding, and if that selloff is steep enough, then the intermediate indicators will start to flatten out and roll over. The way cycles are lining up, the market is set up for churning sideways with a minor downward tilt for a few weeks. The Big Giant Poop we all want to see is still out there, just over the next bounce. Be prepared for a wild ride first. The Feed took no action again today for the second day in a row. Inaction in this case is action, as it continues to signal that the Feed has stopped pumping. There are no expirations on Wednesday. The lack of action on the rate
front comes as no surprise. Al has stopped the growth of Feed holdings dead
in its tracks over the last two months. Doc continues to believe
that they are leaning against the blizzard of money coming in through GSE
intermediation, blasting M3 through the roof, and trickling down to
M1, which last week showed signs of breaking out of a 6 month flat trend.
The uptick in retail sales is also no surprise. With exploding virtually
free credit comes an uptick in activity and...ta da... inflation?
Let's keep an eye on the charts of gold and other asset plays. The Slow Feedometer
is in a death roll. There may be enough liquidity elsewhere in the system
to prevent an implosion for now, but the Feed is apparently putting the
Gang of 22 on a starvation diet. It's hard to imagine the stock market
taking off under the circumstances.
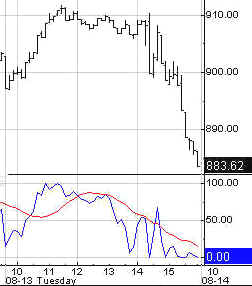
Portfolio Sphincters Index (SPX) and Sentiment
Looks like everything Doc read from yesterday's charts was WRONG! The SPX had a BIG pullback, but so far, the superimposed 6-7 and 10-13 week cycle oscillators have not confirmed. Another down day or two are needed. At the risk of getting it wrong again, the market does not look like it will simply turn on a dime and go straight down. The VIX fell to 39.80, in spite of the selloff. In retrospect, the late July spike looks like a good low for the 6 month cycle. The channel is still down, however, so the low is not confirmed. Note that whenever VIX has moved up to the inner stool band on the inverted scale chart, the market has subsequently sold off. Doc reminds you that sentiment is always relative to the trend and the market environment. What was extreme in the last cycle may not be today. 40 is no longer a buy signal, and 50 probably isn't either. The 17 and 29 day rate of
change indicators which represent the 6-7 and 10-13 week cycles are still
pointing up. But maybe, just maybe, time has run out. The chart below shows possible time pivots on which to base the 10-13 week cycle count. Prior to today, Doc had been counting from the second high on each wave. Then the obvious slapped him in the face. "Do a count from the first high, dummy!" The result is below. This epiphany may have come a day late and a dollar short. We'll see. You know from last night's and prior charts, that the 6 month cycle oscillator is starting to turn up. Doc ran the 10-12 month cycle oscillator tonight, and voila, it hasn't turned. On that basis, there's no confirmation of a big low. The trading stoolicator is strengthening, however, so a big downturn isn't in the cards yet. The short cycle oscillator
remains in a topping zone. As you know, in the
initial stage of the 6 month cycle up phase, it can stay high for days.
But if this is still the end stage of the down phase of the 6 month cycle,
a sell signal from here would be a play. And today we got one. Again,
however, the rising 10-13 week cycle oscillator says no big downturn yet.
It looks like the swup trading range is still in force, but with a couple
of down days into the low to mid 800's ahead. When the 10-13 week cycle
oscillators turn down, then the 750 level is in play for the 10-12 month
and 5-6 month cycle low within 2-3 weeks. The pullback should find
fiber nacho dump support at 860. Tuesday's close at 880 is also a multiple
fibo area. It could act as a magnet. The Cycle Conditions tables include cycle phase and a wild guess as to number of periods to the next turn, in days for the shortest cycles, weeks (W) or months (M) for the longer ones. This is a fluid exercise, in other words, the projections are likely to be wrong, but they force us to be vigilant for key turning points, and frequently work well enough to prevent costly misreadings. SPX Cycle Conditions as of 8/13/02
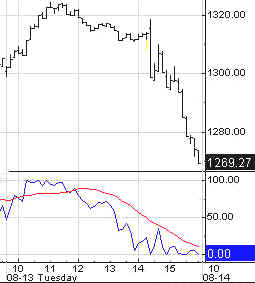
PTT - Periods Till Turn Nasgap Charts Bears got the fall away they needed to prevent an upside disaster. But are we out of the woods? Perhaps. The 10-13 week cycle ozzie actually bottomed in early July. That was the point of maximum downside mo, and the point at which the red channel, which approximates the 10-13 week cycle, touched the lower edged band of the blue channel, which approximates the 5-6 month cycle. If that was the low, this cycle is a lot older than it looks. We've also seen signs that the 10-13 and 6-7 week cycles are scrunching into an 8 week periodicity. Lo and behold, it's now 8 weeks since the last apparent peak of that cycle, in mid June. Prices bolted above the channel lines, Thursday through Monday, but fell back to the upper channel bands today. Another down day and we'll have a classic WHOPsaw, which is a breakout that sucks everybody in, then gets flushed. The 6 month cycle oscillator had turned up, but the slower 10-12 month cycle oscillator still hasn't. The low of that cycle may not be in. The upturns in shorter oscillators stalled. Note on the chart that they have yet to break the long term trend of declining momentum peaks. This is looking more like a classic sideways up phase, which when complete should lead to a dramatic plunge. Before that happens the Nas should churn sideways to lower for a few more weeks.
The 10-13 week cycle oscillator moved higher, but again, this is a
manifestation of the sideways up phase. Momentum indicators move higher as
prices simply move in a range from the lower to the upper edge of the
cycle channel. The 13 day and 4 week cycles are now headed down with cmaps
of 1240 and 1200 over the next week or two. The 6 month cycle downside cmap
slipped to 1140. That hasn't
been met, and it may not be, but with the selloff Tuesday, it's again a
reasonable possibility over the next 2-3 weeks.
The whole area between 1240 and 1265 is a busy, busy Fiber Nacho dump
area. Prices might vibrate in that zone for a few days. Below it is clear
sailing down to 1200. Nasdaq Cycle Conditions as of 8/13/02
PTT
- Periods Till Turn Golden Stool The 4 week cycle cmap on
HUI moved up to 130, with the cycle high due this week. The short cycle
oscillator is overbought, but 10-13 week cycle indicators are
strengthening. We want to see the 10-12 month cycle oscillator begin to flatten in the
area of the zero line then gradually turn up. If it does so above the zero line, gold stocks are in for an extended
and powerful advance. That turn needs to start soon, or the picture starts
to get a little cloudier. AM Edition Features (Previous) These features are in morning edition, published around 9 AM ET US, or the Saturday Weak End Edition, published, uh, let's see, Saturday! T-Bond Yields continue to
blast to new lows. The ultimate test has arrived. Yields are testing their
October 2001 low, and are at their lower long term channel projections.
The bottom is near. The 10-13 week cmap is 4.15. The 10-12 month cycle low
is due. There's a 5-6 month cycle cmap at 4.20, and a possible cmap of 4.0
on the 10-12 month cycle. So if we're not there, it's getting awfully
close. Take any sign of a turn seriously. And a downside breakout will
almost certainly turn into a whopsaw. Uncle Buck's Illness The WHOPsaw is a classic
sucker play. First there's an upside breakout of a classic reverse head
and shoulders bottom. Four days later, it fails, trapping all those who
bought Uncle Buck on the breakout. It's a great sign that the downtrend is
about to resume. Aerospace-
Taxiing for takeoff, can't reach air speed. Biodrech-
Reverse head and shoulders needs dandruff treatment. Bonkers-
Moment of truth has arrived. Reversal or bear market rally? Consumer
Suctor- Same question. Huge increase in wave amplitude (volatility) but is
it a reversal of major trend? Homebubblers-
Long live the bubble. It's dead. Retail-
Sideways up phase ending. Small crap-
Triangle breakdown ahead. Trannies-
Ain't gonna fly. SOX- Can
they fall through support? Soft
Where- Also resting on support. Will eventually break down. Nutworkers-
Support? What support? Trend may accelerate in weeks ahead. Telecom-
Another downleg coming. AMZN- Big
sale coming. CSCO- Up
phase ending. GM- Downhill
drive ahead. IBM- Classic
swup soon to end. INTC- Swup
near a top.
See you in Intraday Stool. Dr. Stepan N. Stool Share your thoughts on the Stool Pigeons Wire.
Renewals Welcome, and thank you for subscribing to the Anals of Stock Proctology. Your trial subscription will run for 90 days. At the end of that period your subscription will renew automatically, unless you cancel. If you wish to cancel your subscription use the button below. If you want to renew your subscription do nothing. Your subscription will renew and your credit card or Paypal bank account will be charged. If you want to renew, be sure your credit card information in your Paypal account is current. Paypal will not renew your subscription if the card has expired! Again, thanks for subscribing!
Explanation of Intraday Commentary-Build charts at http://www.livecharts.com. For custom time bars insert a comma after symbol and number of minutes, e.g. compx,90. This will give you a bar chart of the Nas with 90 minutes per bar. The one day cycle is usually most clear with 8 minute bars and 26/18 stochastics. It varies from day to day. Sometimes 6 minutes works best. Experiment to find the best fit for your trading style, and the market's dominant frequency at the time. The goal here is primarily to monitor the condition of the 8 and 13 day cycles. I typically use 90 minute bars with 26/18 stochastics for the 13 day cycle proxy on the indices during regular trading hours. Other cycles use 26/18 stochastics with the following: 8 days- 60 minute bars On the 24 hour futures charts, use a time per bar approximately 3 to 4 times the above number of minutes, to represent the cycles listed above. ABBREVIATIONS: cma: centered moving average |
||||||||||||||||||||||||||||||||||||||||||||||||||||||||||||||||||||||||||||||||||||||||||||||||||||||||||||||||||||||

![[Most Recent HUI from www.kitco.com]](http://www.weblinks247.com/indexes/idx24_hui_en_2.gif)
![[Most Recent XAU from www.kitco.com]](http://www.weblinks247.com/indexes/idx24_sp500_en_2.gif)
![[Most Recent Quotes from www.kitco.com]](http://kitconet.com/charts/metals/gold/t24_au_en_usoz_2.gif)