|
10 Minute Bar Charts 6/3/02 Dow Jokes Inflatables
Archives 12/30/01, 1/1/02, 1/2/02, 1/3/02, 1/4/02, 1/7/02, 1/8/02, 1/09/02, 1/10/02, 1/11/02, 1/14/02, 1/15/02, 1/16/02, 1/17/02, 1/18/02, 1/22/02, 1/23/02, 1/24/02, 1/25/02, 1/28/02, 1/29/02, 1/30/02, 1/31/02, 2/1/02, 2/4/02, 2/5/02, 2/06/02, 2/7/02, 2/9/02, 2/11/02, 2/12/02, 2/13/02, 2/14/02, 2/16/02, 2/19/02, 2/20/02, 2/21/02, 2/23/02, 2/25/02, 2/26/02, 2/27/02, 2/28/02, 3/1/02, 3/04/02, 3/05/02, 3/06/02, 3/7/02, 3/10/02,3/11/02, 3/12/02, 3/13/02, 3/14/02, 3/15/02, 3/18/02, 3/19/02, 3/20/02, 3/21/02, 3/22/02, 3/25/02, 3/26/02, 3/28/02, 3/30/02 4/1/02, 4/2/02, 4/3/02, 4/4/02, 4/6/02, 4/8/02, 4/9/02, 4/10/02, 4/11/02, 4/13/02, 4/15/02, 4/16/02, 4/17/02, 4/18/02, 4/20/02, 4/22/02, 4/23/02,4/24/02,4/25/02, 4/26/02, 4/27/02, 4/29/02, 4/30/02 5/01/02, 5/2/02, 5/4/02, 5/6/02, 5/07/02, 5/8/02, 5/09/02, 5/10/02, 5/13/02, 5/14/02, 5/15/02, 5/16/02, 5/17/02, 5/20/02, 5/21/02, 5/22/02, 5/23/02, 5/24/02, 5/28/02, 5/29/02, 5/30/02
|
The Anals of Stock ProctologyPublished 5 times
per week by the American Academy of Stock Proctology and PM Update 6/4/02- 2:40 PM - This short covering rally has turned the 5 day cycle up, and has started the turn in the 8 and 13 day cycles. Cmaps on the move are Nas 1590, SPX 1045, and NDX 1188, which is about where they are. It's still not clear whether the 5, 8 and 13 day cycles have bottomed, but indications are leaning that way. There's a good likelihood of a swup developing for a few days. See what kind of pullback develops off this move. PM Update- 6/4/02 12:50 PM Might not be a 3 hour wave after all. Looks like the 5 hour is still working. The market is ornery as ever, even when it's going in the expected direction. there's still very little selling. But the key thing is that there's even less buying. Let's face it, the sphincters are blocked. Big question is still whether the 8a and 13 will bottom and swup from here. Doesn't look like it, but it never does just before. So keep the evil eye out. Bigger cycles working together to the downside should be able to crush short duration up phases.
AM Update- 6/4/02 11:40 AM Updated Nas cmap on the current short cycle is 1525-30, NDX- 1130, SPX 1024. It's probably a 3 hour wave, with low due at 12:30.. AM Update- 6/4/02 9:10 AM Fucutures turned up just before 9 AM, as the BOJ was reportedly jamming the dollar. The 5 hour cycle low was due at the close yesterday. The 1 day cycle low is due at 11 AM. The 8 and 13 day cycle lows could be today, or the 5 day cycle could carry prices lower into Thursday, before a minor rally. The cmaps are derived from the indices as of yesterday's close.
For Wall Street, It's The Thought That Counts (6/3/02) This today from SeeBS.Markethype: "Wall Street tends to see the light switch as on or off. The reality is that we're dealing with a dimmer switch and the lights are slowly coming up," commented John Forelli, fund manager at Independence Investments. Lights out, John. This is typical Wall Street thinking, still the overwhelming consensus of the portfolio sphincter herd. Can there be any doubt that this bear market is in its early stages? Richard Bernstein, Mohel Lynch's (Oy do we got tips for you!) chief strat-ego-ist, has good days and bad days. Overall, he's been bearish on the market for a good long time. That's his Dr. Jekyll persona. Much of the time recently, however, since he got promoted from chief quant to chief strat-ego-ist, he's been touting the Mohel company line, i.e. handing out stock and sector tips. Probably has something to do with having to answer directly to the greasy head Mohel, David (Ted- the portfolio bomber) Komanski. But that's beside the point. Bernstein points out that the overall average portfolio weighting of the Street's borker strat-ego-ists is up to 69.1% from 69% last month. How insane is this? These are near record high levels. These demolition experts are going from ridiculously long, to insanely, ridiculously long. And long is wrong. Ladies and germs, the sheeple have lost complete faith in the market and its mental institutions, which is entirely sane. Yet they continue to entrust the management of their retirement money to these wild-eyed psychopath portfolio ax murderers, who are so delusional, they wouldn't recognize a stinking bear market if the bear sat on their face and passed gas. These people have never had an original critical thought in their entire lives, and still the public entrusts them with trillions of dollars of their retirement money. The problem is that we haven't even seen a swing toward sanity, let alone the insane levels of fear, and finally complete disinterest, that mark bear market lows. Doc happened to catch John Roque of Arnhold and S. Bleichroder on Crapvision Monday evening. Let that one roll off your tongue a few times. BleishhhhROder , YES of YES YES!!! Roque's been a big bear. He said that the market is about to get worse, an opinion which Doc, and I assume most of you stoolies, heartily share. He also pointed out the flaw in the thinking of the "slow bull" or "stealth bull" market people, like the aforementioned Mr. Forelli, and our good friend Big Dick Hooey, of Dry Fuss, or Joe "Big Mac"Alinden of Moogan Stoogely, and innumerable others of the Street's great thinkers. These guys have been hiding in the financials, and the consumer stocks, and the mid caps and small craps. The problem, as Roque pointed out, is that these groups really haven't done a freakin' thing for two years. Yeah, they're all up since last September, but they're still in a two or three year trading range, and worse yet, they're at the top of that range. It's called d-i-s-t-r-i-b-u-t-i-o-n. As all good market historians know, just as bull markets are rotational, so are bears. The pie gets smaller overall, while the sphincters all concentrate on hot groups and sectors, until eventually, the rate of pie shrinkage can no longer be overcome, and the bear eats the whole pie in one bite. That is the stage the market is now entering. There is nowhere left to hide. Which leads Doc to his final thought this evening. As Doc drives home each evening in his trusty '74 Dodge Dart, tooling down I-95 waving and smiling at all the other friendly motorists, he gathers his thoughts for the nightly commentary. He does so by listening to the James J. Cramer Real Money Radio Program. A fine fellow that James J. Cramer, giving freely of his time in this way to help individual investors deal with the ravages of Wall Street. Mr. Cramer's recent top stock picks have all been the product of deep original thinking, far from the Wall Street analysts he likes to criticize. His picks have been stocks like AhOL, General Electric Custer, and Tyco Toys. Hey, even the finest investment professionals are sometimes wrong. Who can blame Mr. Cramer, when he is so sincere about helping people, and his thought processes are so clear, original, and insightful? In recent weeks he's been recommending the stocks of companies whose products you can find in the supermarket. Again, truly original, anti-Wall Street thinking. But there's one thing Doc can't understand. Mr. Jimmy Jones, I mean, Mr. Cramer, closes his program each evening with the slogan, "Remember, there's always a bull market somewhere, and we're gonna find it for you." What Doc can't understand is why Mr. Cramer hasn't found the biggest bull market of all in the last year. Gold and gold stocks. Seems he missed that one. As a matter of fact he's saying that gold has been in a twenty year bear market. so he's staying away. Can you imagine that? Oh, well, it's the thought that counts.
The Feed did $4.25 billion in overnight
repos, rolling $3.5 billion in weekend repos issued Friday and adding a
net $750 million. This won't help the ailing stock market. It will take a
much bigger pump-up to jam the market, which isn't likely. Whenever the Fed overshoots, they take it
all back within a few weeks, with devastating impact on the markets. They
may not do that this time, what with the market struggling the way it is.
But even if the Feed attempts to stuff the market, the Gang of 22 may not
cooperate given the current atmosphere. They need to have a reasonable
expectation that the sphincters will take the handoff and run with it. If
the Gang thinks they don't have anyone to hand off to, they'll just quit
and take the ball home. Just like last summer, Doc thinks that the market
won't follow the Feed for awhile. When the Feed is smoothed to an
average over a few weeks, last week's pumping doesn't look quite as
formidable. You should look at a generally flat Feed as being less than a
maintenance diet. The market needs more than that to stay alive. The
corpses will just keep producing and and selling the product that gives
them the most cash for survival. Given insane valuations, that's their own
stock. There just isn't enough buying power to absorb the normal level of
selling and all the corpses selling their bloated disease ridden bodies
into the market. It's really quite ghoulish, you see.
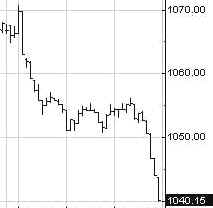
Portfolio Sphincters Index (SPX) and Sentiment The Sphincters Index had two mini-collapses during the day. The loss for the day was 26, breaking the key 1050 level formerly known as support, in this Prince of a bear market. The 17 day rate of change, which represents the 6-7 week cycle broke down decisively, confirming the early stages of a 6-7 week cycle downturn. The 6-7 week cycle oscillator superimposed on the chart below (red line with purple smoother) also confirmed Friday's "sell." The 10-13 week cycle oscillator (teal) is a little late in rolling over, as usual. The point is that this is only the beginning. The 29 day rate of change is in extremely precarious shape. One more down day will trigger a strong sell signal. Considering that the low is probably two months away, the losses are likely to be devastating. This is potentially the most bearish configuration since the bear market began, certainly at least as bad as the first quarter of 2001. The VIX exploded upward to end at 25.70. On the inverted scale chart, VIX has reached the level of the last short cycle low. Will the market rally again like it did in early May? Not this time. The stool band is beginning to turn down, and cyclicality is just starting to turn extremely bearish.. The VIX is nowhere near the level that would indicate an important rally. The blue channel lines are the extension of a linear
regression channel from the February and May 2001 highs. The 6 month cycle
oscillator is stalled in negative territory. The trading
stoolicator is starting to turn down. This will be a very late signal.
Because the cycles are skewed so heavily toward the downleg the oscillator
cannot respond in time for the turn. Doc is confident that this signal
will look very timely in retrospect. The short cycle oscillator was beginning to
bounce off the trampoline, but as Doc warned several times, the springs
looked bad, and sure enough they broke. The 10-13
week cycle oscillator is only starting to roll over to the downside. An
early downturn in the cycle, from low momentum levels is extremely bearish.
A bounce now would change nothing. Touchdown Bears! The next fiber nacho level is
the 61.8% retracement of the fourth quarter "bull" market, at
1034. How long do you think that will last? There are minor fibo support
levels as shown, before the retest of the September low. The Cycle Conditions tables include cycle phase and a wild guess as to number of periods to the next turn, in days for the shortest cycles, weeks (W) or months (M) for the longer ones. This is a fluid exercise, in other words, the projections are likely to be wrong, but they force us to be vigilant for key turning points, and frequently work well enough to prevent costly misreadings. SPX Cycle Conditions as of 6/3/02
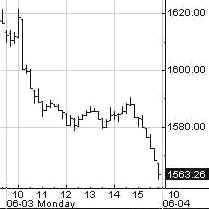
PTT - Periods Till Turn Nasgap Charts We saw a
Nasty 53 point meltdown. The old 6 month cycle oscillator
is breaking down, signaling very late, the beginning of the downtrend. (If that was the up phase,
what will the down look like?) The 6 month
time series spread stalled. Doc thinks that's a time lag anomaly from the
May rally. It won't be around long. The 10-13 week cycle
oscillator and the trading stoolicator are very close to sell signals. The short
cycle tried bouncing off the trampoline and the springs broke. The 8-13 day cycle
looked like it had bottomed last week, but the projections now indicate
the low will be anywhere from 1420 to 1520, any time over the next 2-6
days. The
Nasgap 100 has already broken the long term cycle channel (teal)
projection. A second likely channel is superimposed on the chart. This index is
in the middle of a breakdown which will take out the September low. The Bears are now
driving toward a score at 1561. Below is pretty clear sailing with minor
fibo support before a full retest of the September low. Nasdaq Cycle Conditions as of 6/3/02
PTT
- Periods Till Turn How many
moments of truth can you have from the Long Bong Hit. Here's another one.
Doc professes not to know how this will turn out. The time is right for
yields to start turning up, but will they? Yes turd
day, all of the suctor charts were sitting on the cusp. Doc opined that
they'd all break down together. It's happening. Here go the Bonkers. Wall
Street's been touting the bull market in financial stocks. Sorry fellas,
it was distribution. The trader's
stoolwether of suctors is the stinky SOX. We are just starting to see
intermediate sell signals. This trend should extend and accelerate to the
downside if those signals are correct. The Street
was also hiding in the small craps. Say goodbye. The uptrend is broken
after months of distribution. Microprice's
intermediate cycle indicators are beginning to break down. The September
low should be taken out shortly as the new six month cycle down leg
begins. Doc featured
GM a couple of weeks ago when the stoolicator first began to go negative.
The price action hasn't disappointed. The trend should last for months. Thanks to
the stoolie who requested HL a couple of days ago. (Doc lost the email
again.) Silver is even hotter than gold. There's probably resistance at 6.
No sign of a serious correction any time soon, but we should revisit
periodically. Uncle Buck's Illness This
morning, Buck has broken another level formerly known as support, trading
below 111. The interventions by the Bonk of Japan don't seem to be bonking
Uncle Buck for long. Golden Stool Is the
stoolicator signaling a pause? Too soon to tell, but probably not, based
on this morning's strength in gold. Don't bet against even more upside
acceleration. See you in Intraday Stool. Dr. Stepan N. Stool Let me know what you think on the Stool Pigeons Wire. Previous complete issue with all features Welcome To New Subscribers Welcome, and thank you for subscribing to the Anals of Stock Proctology. You may note some subtle differences in style now that this is no longer a free service. The perspective is still bearish, but it will have a more balanced approach than my message board ravings. You won't see me screaming "BUY" about anything except perhaps gold, but you will see stronger indications of areas and times when I think it might be a good idea to avoid being short. And I promise that I will lose my temper from time to time to keep you entertained! There's also a new feature, Doc's By Request Stock O' The Day. If you have a stock you're interested in, send an email to [email protected], naming the stock, and why you think Doc should look at it, in 25 words or less. 26 words, and you're disqualified! Those that look interesting, Doc will try to feature here within the next day or two. If you have suggestions about other features you'd like to see, send them along to [email protected]. Again, thanks for subscribing!
Explanation of Intraday Commentary-Build charts at http://www.livecharts.com. For custom time bars insert a comma after symbol and number of minutes, e.g. compx,90. This will give you a bar chart of the Nas with 90 minutes per bar. The one day cycle is usually most clear with 8 minute bars and 26/18 stochastics. It varies from day to day. Sometimes 6 minutes works best. Experiment to find the best fit for your trading style, and the market's dominant frequency at the time. The goal here is primarily to monitor the condition of the 8 and 13 day cycles. I typically use 90 minute bars with 26/18 stochastics for the 13 day cycle proxy on the indices during regular trading hours. Other cycles use 26/18 stochastics with the following: 8 days- 60 minute bars On the 24 hour futures charts, use a time per bar approximately 3 to 4 times the above number of minutes, to represent the cycles listed above. ABBREVIATIONS: cma: centered moving average |
|||||||||||||||||||||||||||||||||||||||||||||||||||||||||||||||||||||||||||||||||||||||||||||||||||||||||||||||
![[Most Recent XAU from www.kitco.com]](http://www.weblinks247.com/indexes/idx24_nasdaq_en_2.gif)
![[Most Recent XAU from www.kitco.com]](http://www.weblinks247.com/indexes/idx24_sp500_en_2.gif)
![[Most Recent Quotes from www.kitco.com]](http://kitconet.com/charts/metals/gold/t24_au_en_usoz_2.gif)
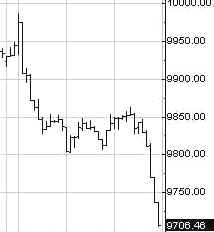
 The
stage managers panicked and forgot their lines today. The show was such a
stinker, the patrons couldn't get out of the theater fast enough. The Number is beginning to look
like a distant memory.
The
stage managers panicked and forgot their lines today. The show was such a
stinker, the patrons couldn't get out of the theater fast enough. The Number is beginning to look
like a distant memory.