|
Archives 12/30/01, 1/1/02, 1/2/02, 1/3/02, 1/4/02, 1/7/02, 1/8/02, 1/09/02, 1/10/02, 1/11/02, 1/14/02, 1/15/02, 1/16/02, 1/17/02, 1/18/02, 1/22/02, 1/23/02, 1/24/02, 1/25/02, 1/28/02, 1/29/02, 1/30/02, 1/31/02, 2/1/02, 2/4/02, 2/5/02, 2/06/02, 2/7/02, 2/9/02, 2/11/02, 2/12/02, 2/13/02, 2/14/02, 2/16/02, 2/19/02, 2/20/02, 2/21/02, 2/23/02, 2/25/02, 2/26/02, 2/27/02, 2/28/02, 3/1/02, 3/04/02, 3/05/02, 3/06/02, 3/7/02, 3/10/02,3/11/02, 3/12/02, 3/13/02, 3/14/02, 3/15/02, 3/18/02, 3/19/02, 3/20/02, 3/21/02, 3/22/02, 3/25/02, 3/26/02, 3/28/02, 3/30/02 4/1/02, 4/2/02, 4/3/02, 4/4/02, 4/6/02, 4/8/02, 4/9/02, 4/10/02, 4/11/02, 4/13/02, 4/15/02, 4/16/02, 4/17/02, 4/18/02, 4/20/02, 4/22/02, 4/23/02,4/24/02,4/25/02, 4/26/02, 4/27/02, 4/29/02, 4/30/02 5/01/02, 5/2/02, 5/4/02, 5/6/02, 5/07/02, 5/8/02, 5/09/02, 5/10/02, 5/13/02, 5/14/02, 5/15/02, 5/16/02, 5/17/02, 5/20/02, 5/21/02, 5/22/02, 5/23/02, 5/24/02, 5/28/02, 5/29/02, 5/30/02 6/01/02, 6/3/02, 6/4/02, 6/5/02, 6/6/02, 6/7/02, 6/10/02, 6/11/02, 6/12/02, 6/13/02, 6/14/02, 6/17/02, 6/18/02, 6/19/02, 6/20/02, 6/22/02, 6/24/02, 6/25/02, 6/26/02, 6/27/02, 6/30/02 7/1/02, 7/4/02, 7/5/02, 7/11/02, 7/14/02, 7/15/02, 7/16/02, 7/17/02, 7/18/02, 7/19/02, 7/22/02, 7/23/02, 7/24/02, 7/25/02, 7/27/02, 7/29/02, 7/30/02 8/1/02, 8/3/02, 8/5/02, 8/6/02, 8/7/02, 8/8/02, 8/10/02, 8/12/02, 8/13/02, 8/14/02, 8/15/02, 8/16/02, 8/19/02, 8/20/02, 8/21/02, 8/22/02
|
The Anals of Stock ProctologyPublished weeknights by
8:30PM Happy Acres, Florida Time The American Academy of Stock Proctology and Is your subscription up for renewal? If you want to renew, do nothing, unless your credit card has expired. Please be sure your credit card info is current. If your credit card has expired, you must enter the new expiration date in your Paypal account in order for your subscription to be processed. If you subscribed via Paypal, your subscription will be renewed for one year on the 90 day anniversary of your sign-up and your credit card will be charged. If you want to cancel, use the button at the bottom of the page. This applies only if you subscribed through Paypal. Mailed-in subscriptions are for 1 year. If you subscribed by prior contribution, I will send you a notice before your subscription expires. If you have any questions, see the subscription page and FAQ's. If you can't find the answer, email me. Update 8/26/02 2 PM I guess we need to face the likelihood that the 8 day cycle low may be in, as much as I was hoping it would stretch out until Wednesday. Revised 1 day cycle cmaps are Nas 1386, SPX 941 and NDX 1017. This could be it, although it's a little early yet. Update 8/26/02 1 PM Terms and methodology Every once in awhile the market plays out the cycle script nearly perfectly. It's the exception, not the rule. The lows appear to have been put in around the expected times from this morning's update although somewhat lower than the projections. The 1day cycle up phase appears to be getting started. The high of the 5 hour cycle may be around 1 PM, but the 1 day cycle should hold on until 2:30. Doc isn't real confident about these upside cmaps, and wouldn't be surprised if the market went 5 points or so higher on this move. We'll see. The 5 and 8 day cmaps have adjusted down. These look a little more solid. The low looks like it could be any time between now and Wednesday. Doc does not make trading recommendations. This update reports intraday time cycle estimates and centered moving average projections based on the Hurst cycle analysis method. Doc assumes no responsibility for the accuracy or inaccuracy of these estimates and projections. The market may or may not meet these projections. New stoolies should thoroughly familiarize themselves with the methodology before trading based on this method. There is no free lunch. Those who do not have the time or inclination to develop a trading strategy based on testing and research should not trade. Trade at your own risk.
Update 8/26/02 9 AM Terms and methodology After moving higher through the night and morning ,the fucutures gave a sell signal on the 1 day cycle. The market should open higher and head down soon thereafter. 5 hour and 1 day cycle lows are due at 11AM and 12:30PM. However it doesn't look like anything dramatic, in either direction. The projected cycle lows were already hit Friday. Whether they get down there again, or not, either way we need to be on guard for the 5 day and 8 day cycle lows which are due. The 8 day cycle low is due today. The 5 day cycle is juxtaposed. Its low is due Wednesday. We'll have to let the market tell us which is governing. At this point the configuration of the cycle indicators suggest the down phase will play out for at least another day, with a good chance of hitting the 5 day cycle cmaps shown below. Doc does not make trading recommendations. This update reports intraday time cycle estimates and centered moving average projections based on the Hurst cycle analysis method. Doc assumes no responsibility for the accuracy or inaccuracy of these estimates and projections. The market may or may not meet these projections. New stoolies should thoroughly familiarize themselves with the methodology before trading based on this method. There is no free lunch. Those who do not have the time or inclination to develop a trading strategy based on testing and research should not trade. Trade at your own risk.
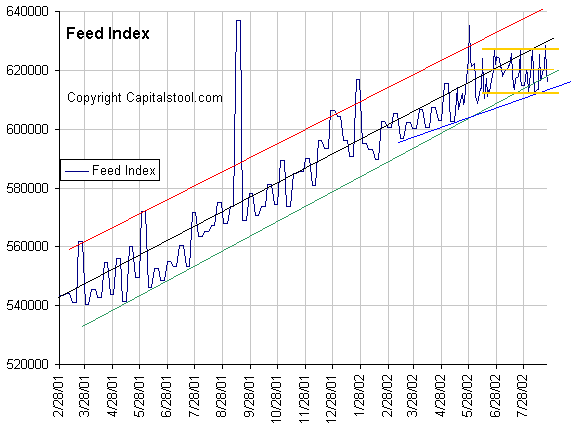
Weak End Anals (8/23/02) This is an abbreviated version of your Weak End Anals. Doc is attending seminars all day Saturday and Sunday, and will be a guest on Marketviews.TV with Ike Iossif on Saturday evening. Your Anals will return with the full load of stuff Monday evening. Until then! The Feed did an $847 million coupon pass Friday. $4 billion in overnight repos expired for a net drain of $3.15 billion. Including Thursday's draining operations, the two day drain was $12.4 billion. Under the circumstances it's no surprise the market came undone Friday. Al took away the Gang of 22's allowance for the week. There are no expirations Monday. Greenspewman has pushed the The Feed Index
back below the green line delineating 10% annual growth, and into the
lower half of his go no-go box. For
the last two months he has not grown the Feed at all. This is certainly a deliberate slowing.
But we don't know if it's temporary, or the beginning of a major policy
shift. Too early to know for sure. It's probably a case of, "nothing
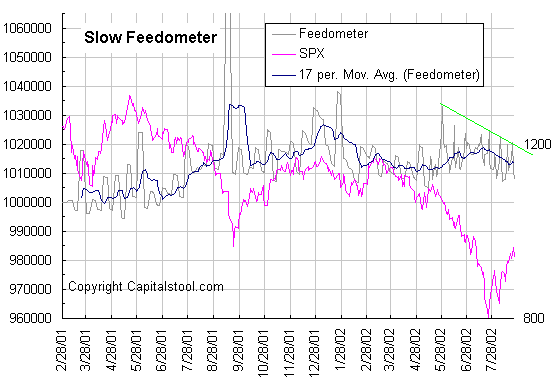
else has worked, so let's try this for awhile." The Feedometer,
which theoretically measures excess Feed available for jamming the
market, fell again. When Al is feeding the Gang of 22 heavily, either
stocks, or bonds, or both, will usually go up in price as the Gang puts
the money to work. At the moment, the Feedometer is nearing the low end of
its year long range. The rally was driven by liquidity from other sources.
Paradoxically, the draining trend over the last few weeks has run counter
to the market. It finally took a toll today, and the market should come
under additional pressure early Monday. How Al reacts may give us a signal
as to whether he is trying to cool the excessive
growth in the broad money supply. As long as they continue to suppress
the growth of Feed, this market isn't going to get too far on the
upside.
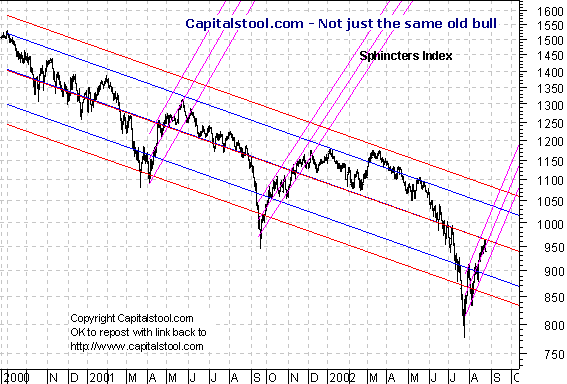
Portfolio Sphincters Index (SPX) and Sentiment
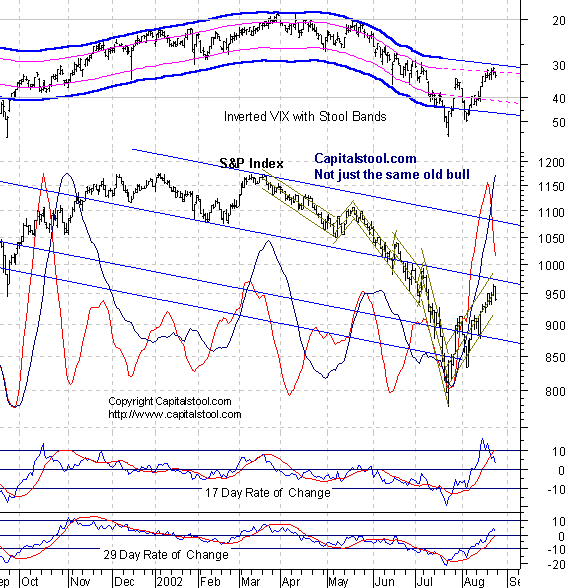
The VIX rose to 32.81. On the inverted scale chart it dropped below the top zone of the Stool Band. The final peak in this rally will probably not occur until the VIX and the upper blue band touch. (Close doesn't count). There are times we only know that in retrospect because the bands are always gradually shifting their direction. The problem with any sentiment or overbought-oversold indicator is that what appears to be extreme based on the past may no longer be, as the market gets deeper into a long term trend. Sentiment indicators also move in trends and cycles. For example, 20on the VIX has been generally recognized as a reading indicating a top. This market could easily top out at a much higher number. At this point, it's possible that a reading of 30, or slightly less may be concurrent with a top. Using the Stool Bands helps us to make the necessary adjustment. The
superimposed 6-7 week cycle (red line) oscillator fell yet again. It
certainly gave timely warning that this cycle had had it a couple of days
ago. Doc didn't think it was significant because of the sharply rising
10-13 week cycle oscillator (dark blue). Under the circumstances, usually the down phase of the shorter
wave shows up as merely a slowing in
the uptrend until the 10-13 week oscillator also
turns down. The 17 day rate
of change, which is a proxy for the 6-7 week cycle, is on a sell signal, but the 29 day rate of change
(10-13 week cycle) is still rising and has crossed into positive
territory. Until that indicator and the 10-13 week cycle oscillator
falter, it's safest to assume the up phase is still in force. The best
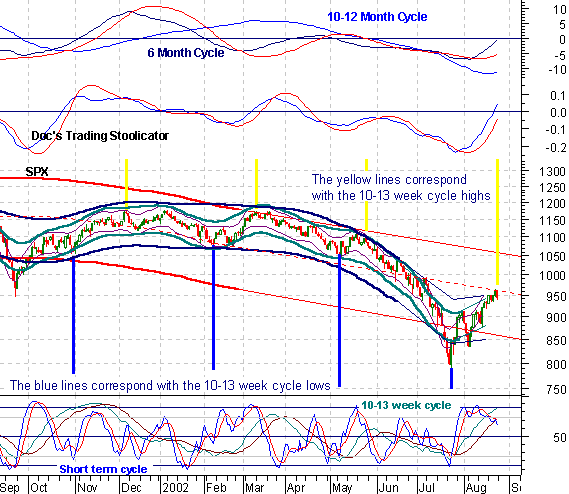
time to be short is when these indicators are in gear to the downside. The 6 month cycle is in an up
phase. All key indicators are still rising. The stoolicator indicates a
strong uptrend that is at least several days, if not more, away from a
peak. The short cycle oscillator is meandering in positive territory,
indicative of trending. By one
count, the 10-13 week cycle high could be imminent, with a
cmap of 970. An alternative projection puts it 4 weeks out, at 1000. The 10-12 month cycle oscillator has upticked.
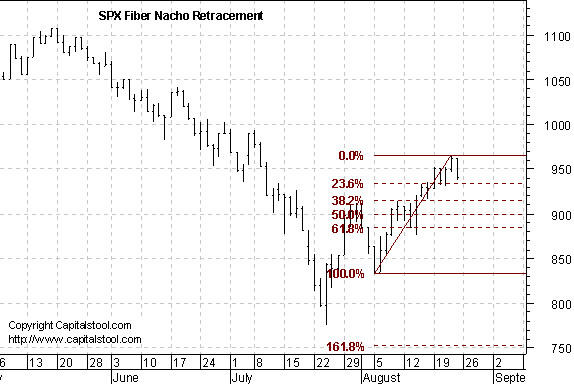
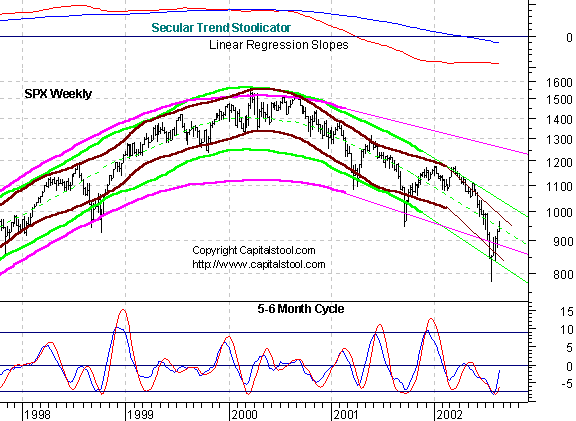
The longer cycle configurations are similar to last October. Fiber Nacho Dump- How far our
little rally might pull back. Doc is running an encore on
this little beauty. The SPX rallied right up to the long term central
regression line, and got whacked. Looks like April 2001. In the last two
cycles, prices first pulled back at the regression line, then punched
through in a four week rally to the highs. Yes Virginia, there are bear
market rallies. They come around like clockwork. Why, when you look at the
long term chart, their behavior seems downright, well..., predictable. The
secular trend channel (pink) bent but didn't break on the downside. The 4
year cycle (green) still shows no sign of a bottom, based on the long term
linear regression slope indications. This current intermediate up phase
may not be over. But by the same token, neither is this bear market. The Cycle Conditions tables include cycle phase and a wild guess as to number of periods to the next turn, in days for the shortest cycles, weeks (W) or months (M) for the longer ones. This is a fluid exercise, in other words, the projections are likely to be wrong, but they force us to be vigilant for key turning points, and frequently work well enough to prevent costly misreadings. SPX Cycle Conditions as of 8/22/02
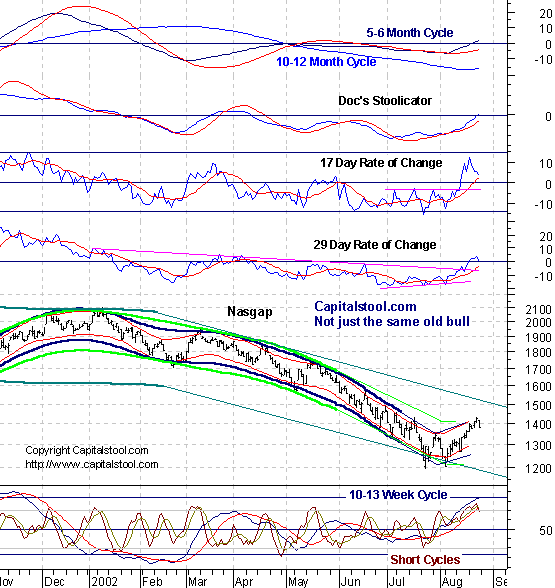
PTT - Periods Till Turn Nasgap Charts Rate of change indicators for the 6-7 and 10-13 week cycles dropped, but their trend is still up. The 6 month cycle oscillator rose again and is in positive territory. The preliminary upside cmap for the 6 month cycle high dropped back to 1445, and we almost saw that on Thursday. This will continue to change as the cycle begins to mature. Overall, it's premature to say that this up phase is over. This was just the first shot across the bow from the bear side. There will be more. But the one thing you must never forget- Bulls are stoolpid, and they ain't playing with their own money. Okay so that's two. The 29 day rate of change is
at the level where the March rally peaked. If it stops here, that means
that momentum has not improved at all longer term. Short cycle
cmaps are pointing to a top around 1445. If that number drops another 20
points, it would confirm that the top is forming. On the other hand, the
13 week cycle oscillator usually peaks several weeks before the
final price high. It's not likely that this rally will turn around on a
dime. Look for one or more probes to the upside yet.
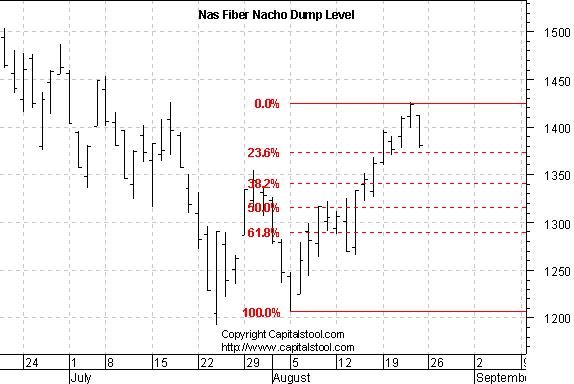
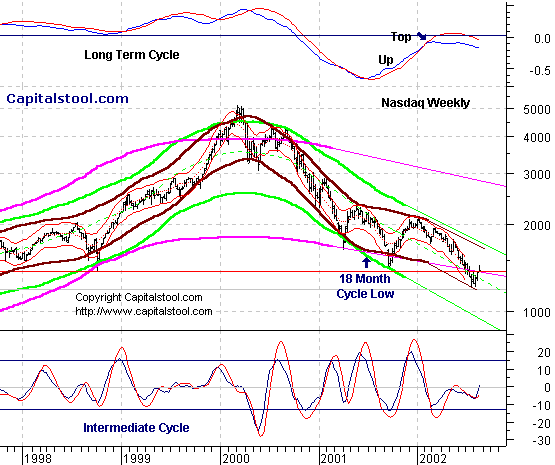
Fiber Nacho Dump Levels- Where the pullback may go.
The Nasty finally generated a rally off the support of the lower line of
the secular trend channel. There's no sign of anything significant
happening on a long term basis. Nasdaq Cycle Conditions as of 8/23/02
PTT
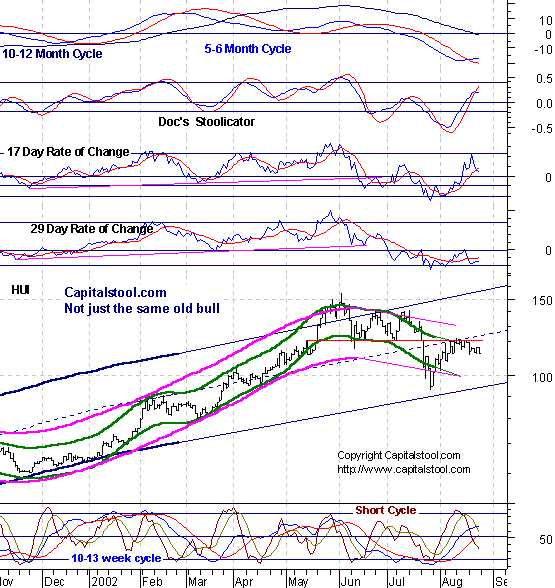
- Periods Till Turn All your favorites will be back Monday, with a limited update on Sunday evening, if time permits. AM Edition Features (Previous) These features are in morning edition, published around 9 AM ET US, or the Saturday Weak End Edition, published, uh, let's see, Saturday! Golden Stool Cousin HUI and
the Golden Stool are being buffeted by mixed cyclicality. The 13 day cycle
downside cmap is 113 but if the index dips below that, the 4 week cycle
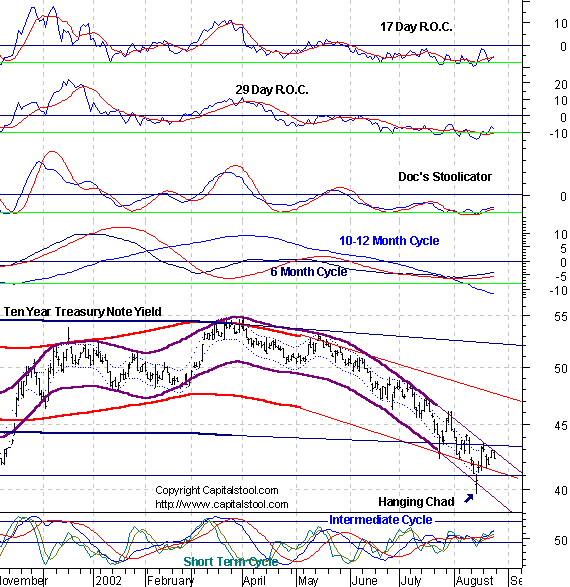
cmap would be 103. The 10 Year T Bond yield couldn't
quite break through the top of the intermediate cycle channel. It will,
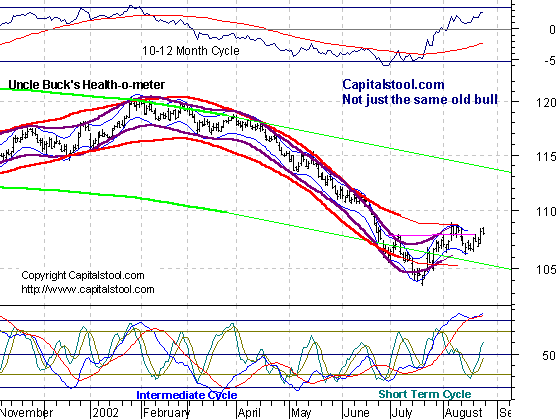
within a week or two, but it should pull back first. Uncle Buck's Illness Uncle Buck came up for air
but went under again, forming a potential double top. But it's an up phase
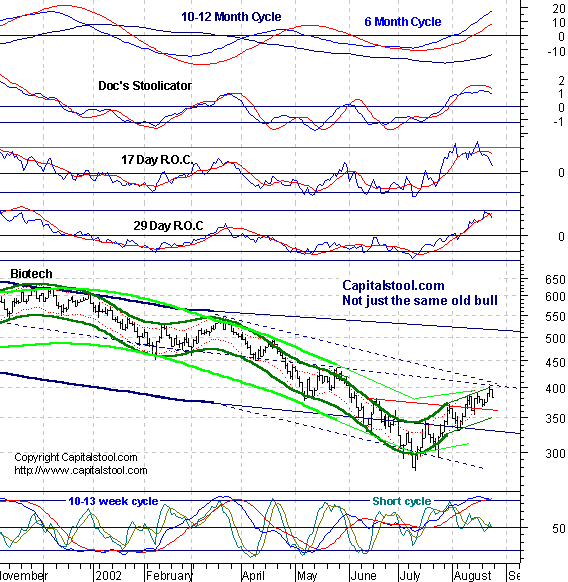
until those indicators turn down. Watch that intermediate cycle ozzie. Biodrech- Early warning
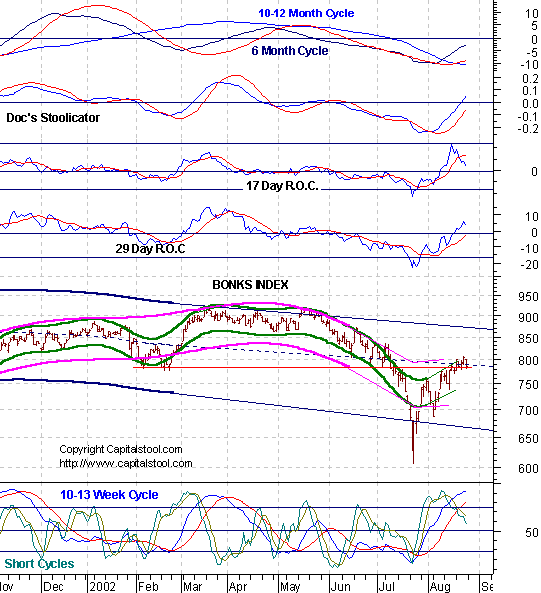
signs of a 10-13 week cycle top. Bonkers- Financial suctor's
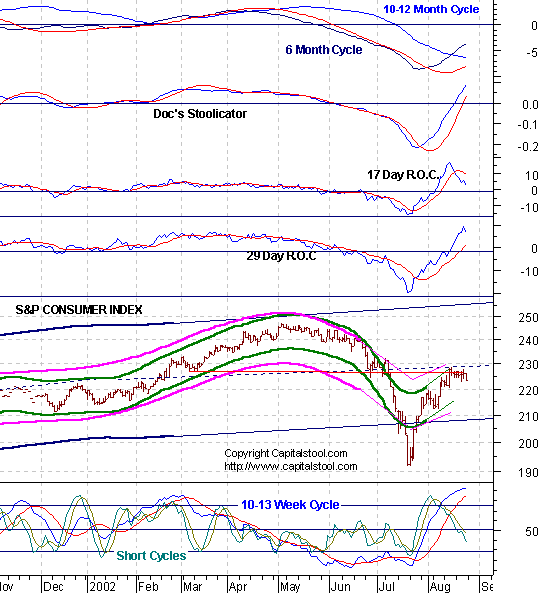
10-13 week cycle up phase just about over, but no signal yet. Con-sumer- The all
important consumer is faltering. The 10-13 week cycle is near a peak. Like
the bonks, no signal, and the shape of the down phase is a question
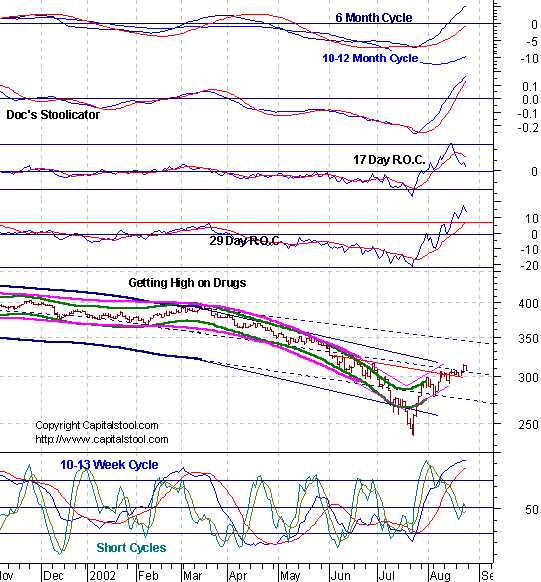
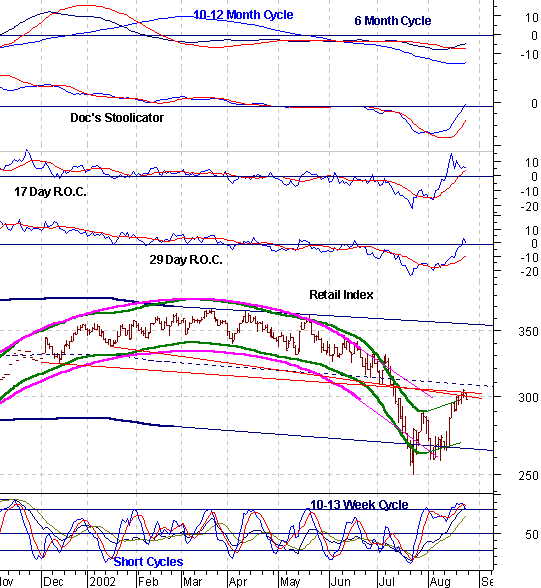
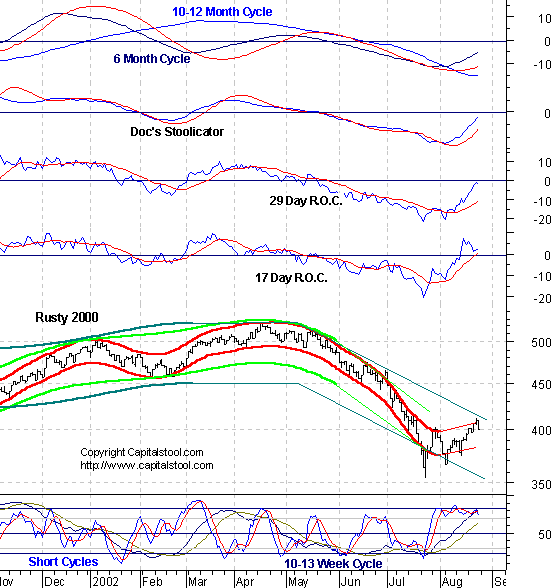
mark. Druggies- same comments. Retail- Ditto. Small crap- No signal yet
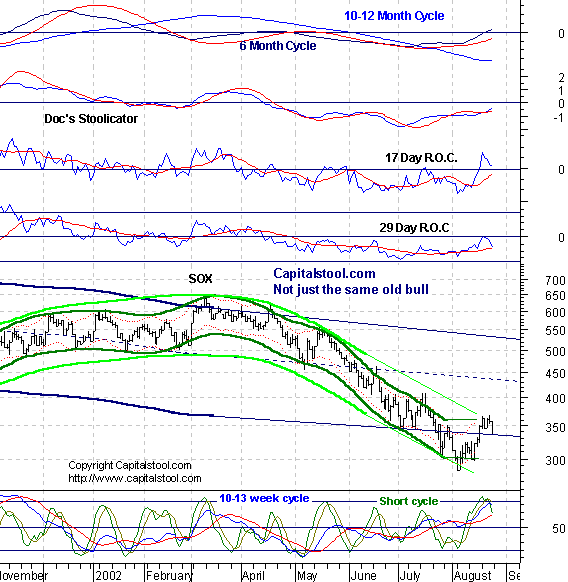
but approaching top of major channel. Dirty SOX- Base building,
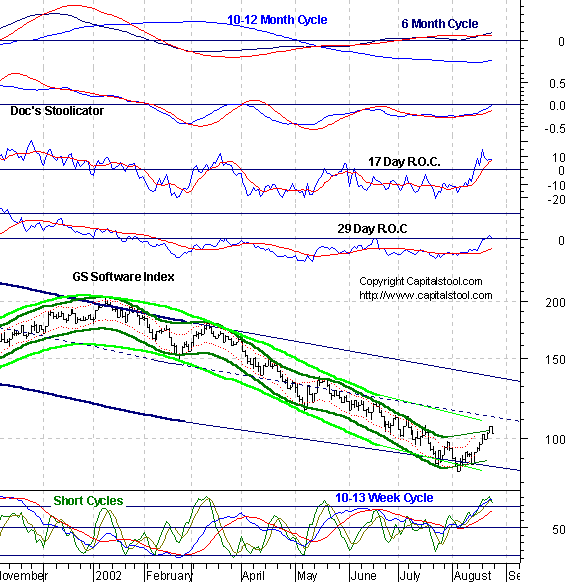
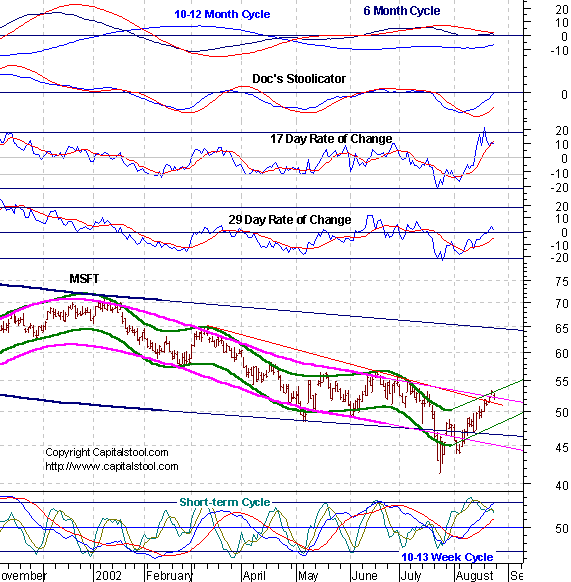
or sloppy top. As always Doc votes for Number 2. Soft Where- Same question,
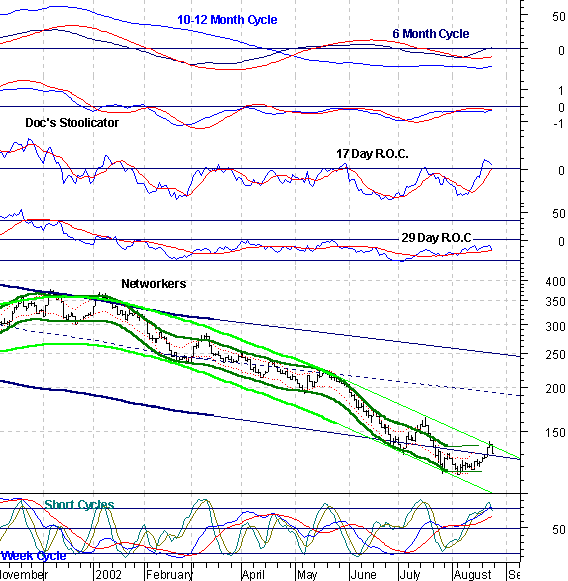
same answer. Nutworkers- Preparing to
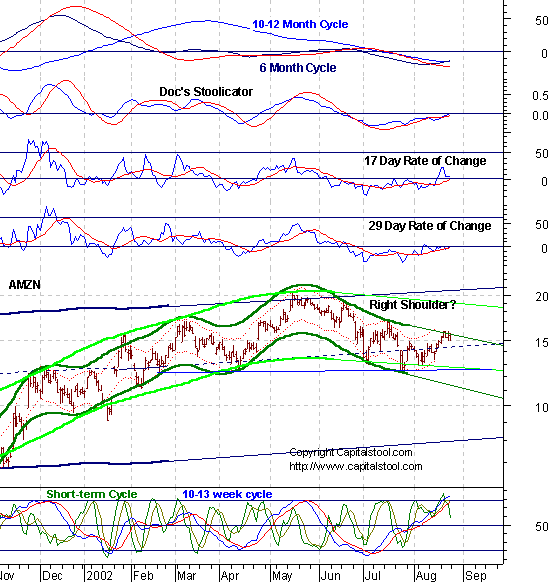
plumb the depths. AMZN- Is the
hunchback ready to lose its balance? Trouble in
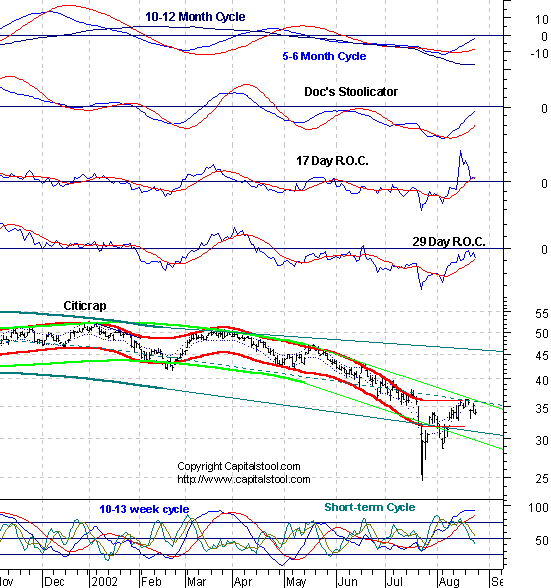
the Citi. Crisco-
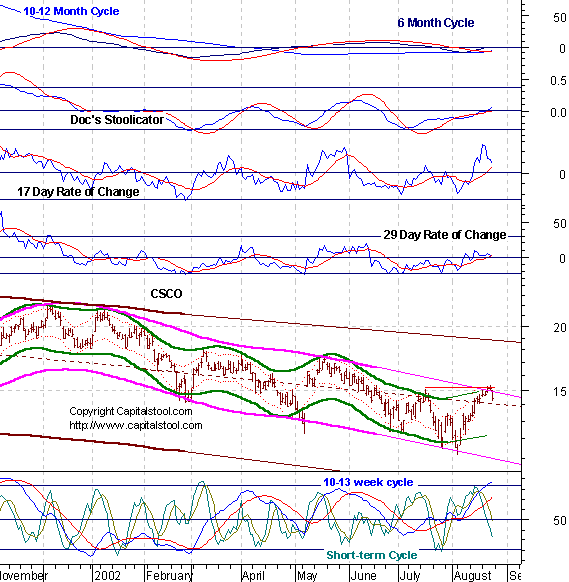
Getting ready to skid? General
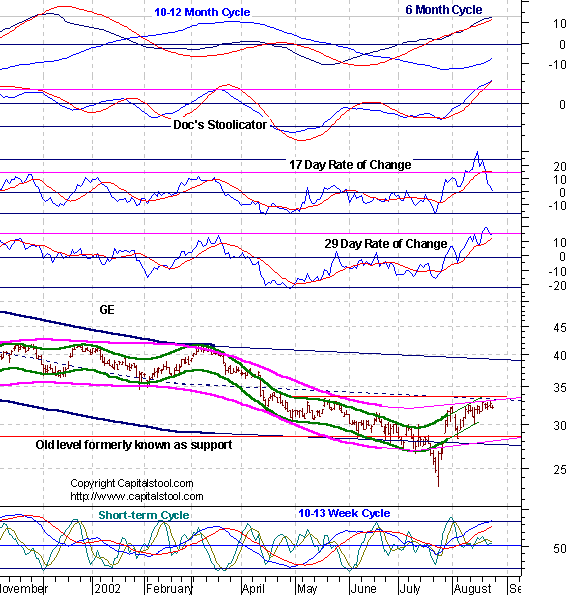
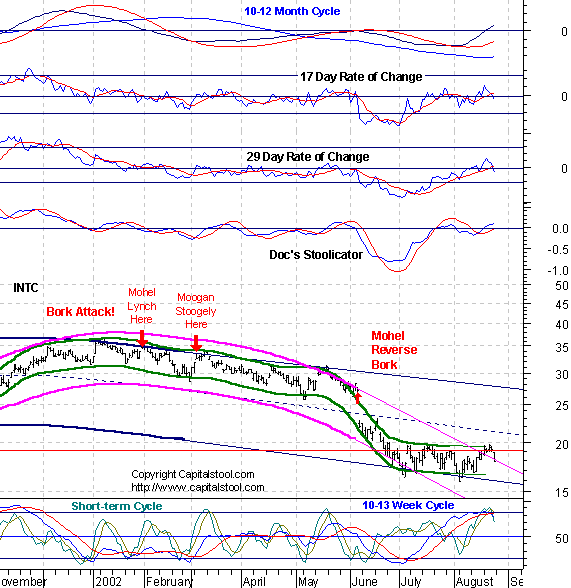
Custer- The Indians are just over the hill. INTC- As
Intel goes, the market will follow. 10-13 week cycle up phase is topping. Mr. Bill-
Too early to bet against this wise guy.
See you in Intraday Stool. Dr. Stepan N. Stool Share your thoughts on the Stool Pigeons Wire.
Renewals Welcome, and thank you for subscribing to the Anals of Stock Proctology. Your trial subscription will run for 90 days. At the end of that period your subscription will renew automatically, unless you cancel. If you wish to cancel your subscription use the button below. If you want to renew your subscription do nothing. Your subscription will renew and your credit card or Paypal bank account will be charged. If you want to renew, be sure your credit card information in your Paypal account is current. Paypal will not renew your subscription if the card has expired! Again, thanks for subscribing!
Explanation of Intraday Commentary-Build charts at http://www.livecharts.com. For custom time bars insert a comma after symbol and number of minutes, e.g. compx,90. This will give you a bar chart of the Nas with 90 minutes per bar. The one day cycle is usually most clear with 8 minute bars and 26/18 stochastics. It varies from day to day. Sometimes 6 minutes works best. Experiment to find the best fit for your trading style, and the market's dominant frequency at the time. The goal here is primarily to monitor the condition of the 8 and 13 day cycles. I typically use 90 minute bars with 26/18 stochastics for the 13 day cycle proxy on the indices during regular trading hours. Other cycles use 26/18 stochastics with the following: 8 days- 60 minute bars On the 24 hour futures charts, use a time per bar approximately 3 to 4 times the above number of minutes, to represent the cycles listed above. ABBREVIATIONS: cma: centered moving average
|
||||||||||||||||||||||||||||||||||||||||||||||||||||||||||||||||||||||||||||||||||||||||||||||||||||||||||||||||||||||


![[Most Recent HUI from www.kitco.com]](http://www.weblinks247.com/indexes/idx24_hui_en_2.gif)
![[Most Recent XAU from www.kitco.com]](http://www.weblinks247.com/indexes/idx24_sp500_en_2.gif)
![[Most Recent Quotes from www.kitco.com]](http://kitconet.com/charts/metals/gold/t24_au_en_usoz_2.gif)