|
Archives 12/30/01, 1/1/02, 1/2/02, 1/3/02, 1/4/02, 1/7/02, 1/8/02, 1/09/02, 1/10/02, 1/11/02, 1/14/02, 1/15/02, 1/16/02, 1/17/02, 1/18/02, 1/22/02, 1/23/02, 1/24/02, 1/25/02, 1/28/02, 1/29/02, 1/30/02, 1/31/02, 2/1/02, 2/4/02, 2/5/02, 2/06/02, 2/7/02, 2/9/02, 2/11/02, 2/12/02, 2/13/02, 2/14/02, 2/16/02, 2/19/02, 2/20/02, 2/21/02, 2/23/02, 2/25/02, 2/26/02, 2/27/02, 2/28/02, 3/1/02, 3/04/02, 3/05/02, 3/06/02, 3/7/02, 3/10/02,3/11/02, 3/12/02, 3/13/02, 3/14/02, 3/15/02, 3/18/02, 3/19/02, 3/20/02, 3/21/02, 3/22/02, 3/25/02, 3/26/02, 3/28/02, 3/30/02 4/1/02, 4/2/02, 4/3/02, 4/4/02, 4/6/02, 4/8/02, 4/9/02, 4/10/02, 4/11/02, 4/13/02, 4/15/02, 4/16/02, 4/17/02, 4/18/02, 4/20/02, 4/22/02, 4/23/02,4/24/02,4/25/02, 4/26/02, 4/27/02, 4/29/02, 4/30/02 5/01/02, 5/2/02, 5/4/02, 5/6/02, 5/07/02, 5/8/02, 5/09/02, 5/10/02, 5/13/02, 5/14/02, 5/15/02, 5/16/02, 5/17/02, 5/20/02, 5/21/02, 5/22/02, 5/23/02, 5/24/02, 5/28/02, 5/29/02, 5/30/02 6/01/02, 6/3/02, 6/4/02, 6/5/02, 6/6/02, 6/7/02, 6/10/02, 6/11/02, 6/12/02, 6/13/02, 6/14/02, 6/17/02, 6/18/02, 6/19/02, 6/20/02, 6/22/02, 6/24/02, 6/25/02, 6/26/02, 6/27/02, 6/30/02 7/1/02, 7/4/02, 7/5/02, 7/11/02, 7/14/02, 7/15/02, 7/16/02, 7/17/02, 7/18/02, 7/19/02, 7/22/02, 7/23/02, 7/24/02, 7/25/02, 7/27/02, 7/29/02, 7/30/02 8/1/02, 8/3/02, 8/5/02, 8/6/02, 8/7/02, 8/8/02, 8/10/02, 8/12/02, 8/13/02, 8/14/02, 8/15/02, 8/16/02, 8/19/02, 8/20/02, 8/21/02, 8/22/02, 8/23/02, 8/26/02, 8/27/02, 8/28/02, 8/29/02, 8/30/02 9/3/02, 9/4/02, 9/5/02. 9/6/02, 9/9/02, 9/10/02, 9/11/02, 9/12/02, 9/13/02, 9/16/02, 9/17/02, 9/18/02, 9/19/02, 9/20/02, 9/23/02, 9/24/02, 9/25/02, 9/26/02, 9/27/02, 9/30/02 10/1/02, 10/2/02, 10/3/02, 10/4/02, 10/7/02, 10/8/02, 10/9/02, 10/10/02, 10/11/02, 10/14/02, 10/15/02, 10/16/02, 10/17/02, 10/18/02, 10/21/02, 10/22/02, 10/23/02, 10/24/02, 10/25/02, 10/28/02, 10/29/02, 10/30/02, 10/31/02 11/1/02, 11/4/02, 11/5/02, 11/6/02, 11/7/02, 11/8/02, 11/11/02, 11/12/02, 11/13/02, 11/14/02, 11/15/02, 11/18/02, 11/19/02, 11/20/02, 11/21/02, 11/22/02, 11/25/02, 11/26/02, 11/27/02, 11/29/02 12/2/02,
12/3/02, 12/4/02,
12/5/02 1/1/03, 1/2/03, 1/03/03, 1/6/03, 1/7/03, 1/8/03, 1/9/03, 1/10/03, 1/13/03, 1/14/03, 1/15/03, 1/16/03, 1/17/03, 1/21/03, 1/22/03, 1/23/03, 1/24/03
 Doc's view of the Street. |
The Anals of Stock ProctologyPublished weeknights by
8:30PM Happy Acres, Florida Time The American
Academy of Stock Proctology and Is your subscription up for renewal? If you want to renew, do nothing, unless your credit card has expired. Please be sure your credit card info is current. If your credit card has expired, you must enter the new expiration date in your Paypal account in order for your subscription to be processed. If you subscribed via Paypal, your subscription will be renewed for one year on the 90 day anniversary of your sign-up and your credit card will be charged. If you want to cancel, use the button at the bottom of the page. This applies only if you subscribed through Paypal. Mailed-in subscriptions are for 1 year. If you subscribed by prior contribution, I will send you a notice before your subscription expires. If you have any questions, see the subscription page and FAQ's. If you can't find the answer, email me. Doc does not make trading recommendations. This update reports time cycle estimates and centered moving average projections based on the Hurst cycle analysis method. This publication is for entertainment and educational purposes only. Doc assumes no responsibility for the accuracy or inaccuracy of the estimates and projections presented. The market may or may not meet the projections. Stoolies should thoroughly familiarize themselves with the methodology before trading based on this method. Those who do not have the time or inclination to develop a trading strategy based on testing and research should not trade. Trade at your own risk. Yadda yadda. How's your motha? Intraday Updates 1/28/03 12:30 PM The market appears to be cycling on a 3 hour basis. The times and cmaps posted are based on that, but it can change at any time. If the 3 hour wave sticks, look for a low around 2 PM. They should drift higher for about an hour then soften going into the close, but overall are likely to remain in a narrow range. Follow Doc's intraday commentary and cycle charts on the hour and half hour during the trading day at the Stooltrading Beta Test. 9:15 AM Up down up, on the fucutures overnight. They are headed up into the open. Stocks should gap higher. The upside cmaps are 855 on the SPX and 24.85 on the QQQ. This should be a 1 day cycle high. Look for a pullback into a 5 hour low at 10:30-11:00, then possibly a lower 1 day cycle low around 12:00 +/-. Intraday Monday - A drop on the open lead to a jerk buying spree for a few minutes. That dies out near 10 AM setting a double top on the 1 day cycle high established late Friday. They ground them down until 11:30, establishing a 1 day cycle low there. Next came a weak rally until 1 PM, setting a second 1 day cycle high, at that point. They drifted down into a test of the earlier low, making a double bottom around 3:10, at which time the dip jerks came in again, not coincidentally while Secretary Colon Poowell was speaking. The dippers expected Poowell to wave a magic wand and restart the bull market. But is was not to be, and the market sold off into the bell. The waffling in the afternoon made it difficult to see what was going on cyclically, but in retrospect it was clearly a swup, in not only the 1 day wave, but probably the 3 day cycle was well. That implies more downside dead ahead, although it is hard to tell whether it will be tomorrow, or after a few more days of swupping. Based on hitting the late PM cmaps, the high near 3:45 was probably it for the 1 day cycle, although a retest on the opening is a good possibility. Then look for a 1 day cycle low around 12:00. Assuming this is part of a 3-8 day cycle swup, the down phase shouldn't be dramatic and the day as a whole will be on of sloppy waffles. Pre Market Update at 9:15 AM NY time. Follow Doc's intraday commentary and cycle charts on the hour and half hour during the trading day at the Stooltrading Beta Test. Get StoolieSignal Special offer here only! The cycle map below is en estimate of how the market might behave over the next few hours. Should the pattern be broken, the map should be redrawn to fit the actual. Cmaps and times shown are guidelines only. Cycles vary in wavelength and amplitude. Directional changes within an hour of the expected turn and a few points of the cmap should be respected. The indicators rule. Times and prices are the projected cycle highs and lows with cmaps. 5-8 Day Cycle______ 2-3 Day Cycle_______ 5 Hr-1 Day Cycle
Monday's
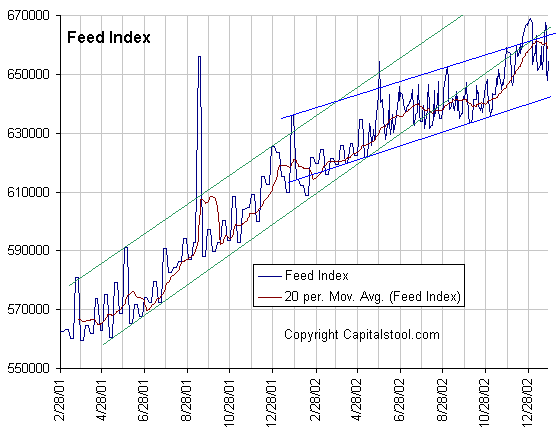
Markets Stock Proctologist Sees it Coming Down 1/27/03 Tonight you have the good fortune of getting the complete stock proctoscopic view in one shot, including a posting of all the daily action in Uncle Buck and the Golden Stool, normally in the AM edition. It's oogly, unless of course, you are holding the Golden Stool. Overall, it's about what we all expected to start this week. Stocks are due for the slightest of respites as a 13 day cycle low will perhaps be hit on Tuesday. Doc doesn't expect the up phase, if it materializes, to amount to a hill of beans. At best the market will bounce a little and go sideways for a few days. Meanwhile, Uncle Buck stopped his daily droppings for a day. That won't last long. Looks like he's headed for the mid 90's. The decline in the dollar is clear evidence of the repatriation problem that is tying Al's hands with the Feed. He has a Catch 22. No matter what he does, there can only be one outcome. The markets will go down. Doc thinks Al will continue to moderate the Feed in hopes of staunching the hemorrhaging of capital out of US paper assets. In other words, goodbye reflation. The question is whether not Feeding will cause the stock market to crash. There is certainly a good chance that it will. If you are worried about the double top in HUI, that's probably a good sign. Doc thinks that it's too early to expect a major down move, and that there's still more upside in the weeks ahead. As always, the charts need to be watched daily. In this kind of bull trend the last thing you want to do is jump off too early. But you also want to be alert to signs of real trouble. Now the dirty details. Doc's Pooper Scooper. Be a Johnny Applestool! Help spread the Stool! Feel free to repost snippets from the Anals on message boards around the web. Just give a link back! Many tanks - Doc The Feed added $2.25 billion net, with the addition of $6.75 billion in overnight repos against the expiration of $4.5 billion. The overnight repos are the only expiration scheduled for Tuesday. The small addition doesn't change much. Total Feed remains near the center of the 8% growth channel. Two things to keep an eye on are the bond market and Uncle Buck. Capital flight will begin to force yields higher and Buck lower. Since the entire economy and financial structure depends on the mortgage bubble not collapsing, Al simply cannot afford to allow bond yields to rise too much. On the other hand, the only way to slow the flow of capital out of US markets is to either allow bond yields to rise enough to become attractive again, or to raise short term rates for the same purpose. They can't achieve either of those things by Feeding excessively. More Feeding will simply drive down Uncle Buck more, and in the process send bond yields higher. That means they'll have to slow the growth of Feed. Oops, they can't do that either as tightening would wipe out spread trade profits and cause the implosion of the super leveraged credit bubble leveraged. That leaves, "close your eyes and pray." Two
trends are evident on the Feed Index, which is the total Fed holdings of
loans and securities. One is the 10% growth trend beginning in May of
2001. The blue channel going back to last December suggests an 8% growth rate. Look at the 4 week moving
average (brown line) and compare it with the slope of the tow larger
channels for an indication for whether the slope of short term growth is
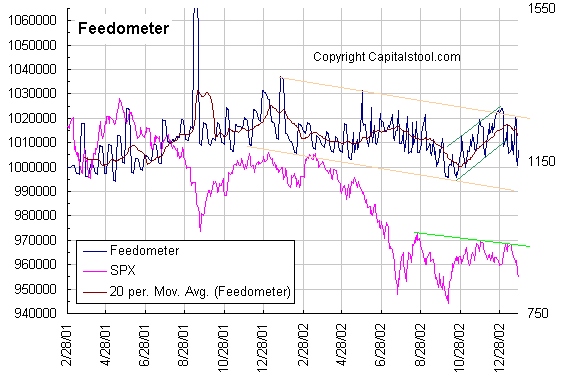
slower or faster than the 2 longer term trends. In spite of Monday's uptick, the Feedometer is still in a short term downtrend. Since it appears that Al can no longer Feed aggressively without exacerbating the collapse of Uncle Buck, and taking a big hit on the Long Bong, he'll probably just try and tread water. The stock market will drown. The
Feedometer theoretically measures excess Feed available for bond or stock
market jamming. Al selects a trend level he feels is needed to reflatulate
the economy. The Feedometer measures the difference between the apparent
trend target, and actual day to day Feeding (Fastow Feedometer), as well
as a four week moving average (Slowmo Feedometer). A break above the
orange trendline might indicate a more aggressive jamming policy.
Bond yields rose. The Gang of 22 started shorting heavily again.
One day of that does not make a reversal, but a couple days does, so let's
watch that. The short cycle oscillator has reached a bottom zone and short
cycle cmaps of 3.85 were nearly hit last week. Indications remain mixed
with intermediate indicators near neutral, and there's no sign yet of a
breakout from the trading range. However, both the 17 and 29 day ROC's are
on the cusp of upturns. If they do turn from these levels it would signal
a major upturn in bond yields caused by massive capital flight out of US financial
assets. This bears close watching on a day to day basis. Dow Inflatables- With
tonight's issue, Doc is taking his first shot at a 10-13 week cycle cmap for the
Dow. It looks like 7435. The ETA is some time in March. That will change in the days ahead, but at least we now
have an initial target. Both the 4 and 6-7 week cmaps are pointing at 7750.
The 13 day cmap appears to be pointing at 7950, which was almost hit Monday.
Looks like time for a swup. All of Doc's daily cycle charts
are powered by METASTOCK Portfolio Sphincters Index (SPX) and Sentiment Cycle Chart Short Term Cycles The short cycle oscillator dropped further into the bottom zone. Normally the first trip into that area results in a one or two day bounce, then the market heads lower again while the indicator diverges, leading to a bigger rally on the second upturn. However, in a one in a million crash scenario, the indicator will break the trampoline and just stay down. The 13 day cycle low still isn't in. The new cmap is now 832. It will either have a mild bounce or a swup soon, then down again. The 6-7 week cycle oscillator (chart below), dropped sharply. The 17 day rate of change is completing a top and starting to break down. The downside cmap on the 4-7 week cycles is 820-830. That could still drop in the days ahead. 10-13 Week Cycle The 10-13 week cycle oscillators is heading down. The 29 day rate of change is slowly turning lower but isn't in panic mode. The market could trend like this for weeks. The down phase may last 6 to 9 weeks. The preliminary cmap is 820, but expect that to go lower. Sentiment VIX zoomed upward (Down on the inverted scale chart). Normally we'd look for a bounce if it goes to 40 or above. It's there. This will be an interim low because over the next few weeks the channels will turn lower. There is no way to know what level will be reached at the final low of this cycle. IT should be at least 50-60, and possibly much higher in a worst case scenario. We use this as a confirming indicator only, and will rely as always on price as the final arbiter.
The 15 day rate of change is a proxy for the
4-7 week cycle. The 29 day rate of change is a proxy for the 10-13 week
cycle. The dark blue overlaid line is the 10-13 week cycle
oscillator, while the red line is the 6-7 week cycle oscillator. The VIX
is a measure of implied options volatility reflecting relative fear or
complacency. It is plotted below on an inverse scale to better show the
relationship to the price chart. The "Stool Bands" may reflect
either 6 month or 10-12 month cycles. The Cycle Conditions tables include cycle phase and a wild guess as to number of periods to the next turn, in days for the shortest cycles, weeks (W) or months (M) for the longer ones. This is a fluid exercise, in other words, the projections are likely to be wrong, but they force us to be vigilant for key turning points, and frequently work well enough to prevent costly misreadings. SPX Cycle Conditions as of 1/27/03
PTT - Periods Till Turn Nasgap Charts The Nas is expected to behave more like the SPX with the continued de-weighting of tech. In the interest of publishing the Anals earlier in the evening Doc is presenting the charts and data without commentary, as it is largely redundant relative to the SPX commentary above. Cycle Chart Nasdaq Cycle Conditions as of 1/24/03
PTT
- Periods Till Turn Suctor Watch and Stoolwethers- Now posted on separate page. Updated each morning between 8 AM and 9:00 AM NY time. Long Bong Hit - See top of page. Golden Stool Comments 1/27/03 PM Gold forged
ahead Monday, while Cousin HUI took a breather after making a double
top. While gold has gone parabolic, HUI remains in a 10-13 week
cycle sideways down phase which should end within a few days. Gold is
closing in on an upside 10-13 week cmap of 376. HUI has a way to go before
reaching a 6 moth cycle cmap of 175. HUI has also fallen a little short
of a 13 day cycle cmap of 155. Gold's 13 day cmap is 379. Although both
are subject to short violent pullbacks in their ongoing uptrends, Doc does
not yet see the signs that this double top in the HUI will mark an
important top.
Uncle Buck's Illness Comments1/27/03 PM Uncle Buck
stabilized a bit after his weeks long swoon. But it may not be voer yet.
The 13 day cycle cmap dropped to 98.25.and the 10-13 week cycle cmap
dropped to 96.50.A 6 month cycle
sideways up phase is due but the cmap has dropped to 94.50 on that cycle
and a 1 year cycle low isn't due until mid year. Ugly. As goes Uncle Buck,
so go the US financial markets which are dependant on foreign investment
to maintain their equilibrium. Chart as of 1/27/03 close Get StoolieSignal Special offer here only! Suctor Watch and Stoolwethers- Now posted on separate page. Updated each morning between 8 AM and 9:00 AM NY time. See you in Intraday Stool. Dr. Stepan N. Stool Share your thoughts on the Stool Pigeons Wire.
Renewals Thank you for subscribing to the Anals of Stock Proctology. Your trial subscription will run for 90 days. At the end of that period your subscription will renew automatically, unless you cancel. If you wish to cancel your subscription use the button below. If you want to renew your subscription do nothing. Your subscription will renew and your credit card or Paypal bank account will be charged. If you want to renew, be sure your credit card information in your Paypal account is current. Paypal will not renew your subscription if the card has expired!
Explanation of Intraday Commentary-Build charts at http://www.livecharts.com. For custom time bars insert a comma after symbol and number of minutes, e.g. compx,90. This will give you a bar chart of the Nas with 90 minutes per bar. The one day cycle is usually most clear with 8 minute bars and 26/18 stochastics. It varies from day to day. Sometimes 6 minutes works best. Experiment to find the best fit for your trading style, and the market's dominant frequency at the time. The goal here is primarily to monitor the condition of the 8 and 13 day cycles. I typically use 90 minute bars with 26/18 stochastics for the 13 day cycle proxy on the indices during regular trading hours. Other cycles use 26/18 stochastics with the following: 8 days- 60 minute bars On the 24 hour futures charts, use a time per bar approximately 3 to 4 times the above number of minutes, to represent the cycles listed above. About centered moving average projections. ABBREVIATIONS: cma: centered moving average |


![[Most Recent HUI from www.kitco.com]](http://www.weblinks247.com/indexes/idx24_hui_en_2.gif)
![[Most Recent XAU from www.kitco.com]](http://www.weblinks247.com/indexes/idx24_sp500_en_2.gif)
![[Most Recent Quotes from www.kitco.com]](http://kitconet.com/charts/metals/gold/t24_au_en_usoz_2.gif)