|
]
Archives 12/30/01, 1/1/02, 1/2/02, 1/3/02, 1/4/02, 1/7/02, 1/8/02, 1/09/02, 1/10/02, 1/11/02, 1/14/02, 1/15/02, 1/16/02, 1/17/02, 1/18/02, 1/22/02, 1/23/02, 1/24/02, 1/25/02, 1/28/02, 1/29/02, 1/30/02, 1/31/02, 2/1/02, 2/4/02, 2/5/02, 2/06/02, 2/7/02, 2/9/02, 2/11/02, 2/12/02, 2/13/02, 2/14/02, 2/16/02, 2/19/02, 2/20/02, 2/21/02, 2/23/02, 2/25/02, 2/26/02, 2/27/02, 2/28/02, 3/1/02, 3/04/02, 3/05/02, 3/06/02, 3/7/02, 3/10/02,3/11/02, 3/12/02, 3/13/02, 3/14/02, 3/15/02, 3/18/02, 3/19/02, 3/20/02, 3/21/02, 3/22/02, 3/25/02, 3/26/02, 3/28/02, 3/30/02 4/1/02, 4/2/02, 4/3/02, 4/4/02, 4/6/02, 4/8/02, 4/9/02, 4/10/02, 4/11/02, 4/13/02, 4/15/02, 4/16/02, 4/17/02, 4/18/02, 4/20/02, 4/22/02, 4/23/02,4/24/02,4/25/02, 4/26/02, 4/27/02, 4/29/02, 4/30/02 5/01/02, 5/2/02, 5/4/02, 5/6/02, 5/07/02, 5/8/02, 5/09/02, 5/10/02, 5/13/02, 5/14/02, 5/15/02, 5/16/02, 5/17/02, 5/20/02, 5/21/02, 5/22/02, 5/23/02, 5/24/02, 5/28/02, 5/29/02, 5/30/02 6/01/02, 6/3/02, 6/4/02, 6/5/02, 6/6/02, 6/7/02, 6/10/02, 6/11/02, 6/12/02, 6/13/02, 6/14/02, 6/17/02, 6/18/02, 6/19/02, 6/20/02, 6/22/02, 6/24/02, 6/25/02, 6/26/02, 6/27/02, 6/30/02 7/1/02, 7/4/02, 7/5/02, 7/11/02, 7/14/02, 7/15/02, 7/16/02, 7/17/02, 7/18/02, 7/19/02, 7/22/02, 7/23/02, 7/24/02, 7/25/02, 7/27/02, 7/29/02, 7/30/02 8/1/02, 8/3/02, 8/5/02, 8/6/02, 8/7/02, 8/8/02, 8/10/02, 8/12/02, 8/13/02, 8/14/02, 8/15/02, 8/16/02, 8/19/02, 8/20/02, 8/21/02, 8/22/02, 8/23/02, 8/26/02, 8/27/02, 8/28/02, 8/29/02, 8/30/02 9/3/02, 9/4/02, 9/5/02. 9/6/02, 9/9/02, 9/10/02, 9/11/02, 9/12/02, 9/13/02, 9/16/02, 9/17/02, 9/18/02, 9/19/02, 9/20/02, 9/23/02, 9/24/02, 9/25/02, 9/26/02, 9/27/02, 9/30/02 10/1/02, 10/2/02, 10/3/02, 10/4/02, 10/7/02, 10/8/02, 10/9/02, 10/10/02, 10/11/02, 10/14/02, 10/15/02, 10/16/02, 10/17/02, 10/18/02, 10/21/02, 10/22/02, 10/23/02, 10/24/02, 10/25/02, 10/28/02, 10/29/02, 10/30/02, 10/31/02 11/1/02, 11/4/02, 11/5/02, 11/6/02, 11/7/02, 11/8/02, 11/11/02, 11/12/02, 11/13/02, 11/14/02, 11/15/02, 11/18/02, 11/19/02, 11/20/02, 11/21/02, 11/22/02, 11/25/02, 11/26/02, 11/27/02, 11/29/02 12/2/02,
12/3/02, 12/4/02,
12/5/02 1/1/03, 1/2/03, 1/03/03, 1/6/03, 1/7/03, 1/8/03, 1/9/03, 1/10/03, 1/13/03, 1/14/03, 1/15/03
 Doc's view of the Street. |
The Anals of Stock ProctologyPublished weeknights by
8:30PM Happy Acres, Florida Time The American
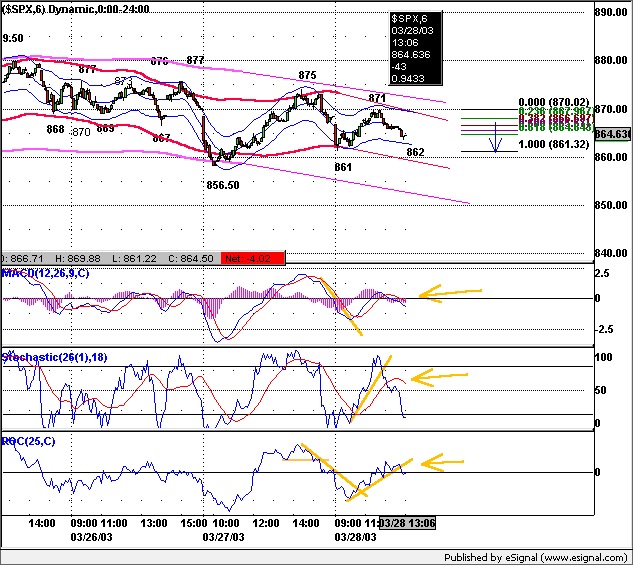
Academy of Stock Proctology and Is your subscription up for renewal? If you want to renew, do nothing, unless your credit card has expired. Please be sure your credit card info is current. If your credit card has expired, you must enter the new expiration date in your Paypal account in order for your subscription to be processed. If you subscribed via Paypal, your subscription will be renewed for one year on the 90 day anniversary of your sign-up and your credit card will be charged. If you want to cancel, use the button at the bottom of the page. This applies only if you subscribed through Paypal. Mailed-in subscriptions are for 1 year. If you subscribed by prior contribution, I will send you a notice before your subscription expires. If you have any questions, see the subscription page and FAQ's. If you can't find the answer, email me. Doc does not make trading recommendations. This update reports time cycle estimates and centered moving average projections based on the Hurst cycle analysis method. This publication is for entertainment and educational purposes only. Doc assumes no responsibility for the accuracy or inaccuracy of the estimates and projections presented. The market may or may not meet the projections. Stoolies should thoroughly familiarize themselves with the methodology before trading based on this method. Those who do not have the time or inclination to develop a trading strategy based on testing and research should not trade. Trade at your own risk. Yadda yadda. How's your motha? Intraday Updates Chart Below 2:30 PM 1 day cycle high is due at the close. Will we get at least a little bounce in the last hour is the question. 8 day cycle cmaps have adjusted down a bit, but a good sized bounce in last hour could mean the low of that cycle is in. Flat or continued drift means a probable lower 8 day cycle low than today. 9:15 AM Wow! Is this a beautiful thing or what? Pretty clear that bad news is no longer good, and good news isn't any good either. This is a sea change in psychology, confirming that the 10-13 week cycle has peaked, and peaked very early. The pre market action in the QQQ and Spoos is reflected in the charts above. Doc is now looking at a probable 5 hour cycle low around 11:30, and 1 day low between 12:30 and 1 PM. Based on the fucutures the SPX 8 day cycle low projects to around 895 due today or Monday. If I had been short scalping the Q's I might cover this morning around 25.80, and look to get back in after a reaction later today or Monday. Doc's Pooper Scooper. Intraday Turdsday - The ponies got a strong start out of the gate and ran hard in the first furlong. The trigger was an idiotic reaction to the CPI and unemployment claims, all of which is phony, meaningless data. The rally fizzled at 10 AM, putting in the 1 day cycle high. A 5 hour-1 day cycle low was due between 12:00 and 1:30. They barely paused there, and continued to drift lower in spite of what should have been a 1 day cycle up phase in the PM. The low finally came around 3:30. The up phase was cut short by the Mr. Bill spinning circus in the after hours. After initial weakness, look for a recovery attempt as the 1 day cycle high completes around 10 AM, then softens again through mid-day. Pre Market Update at 9:15 AM. Follow Doc's intraday commentary and cycle charts on the hour and half hour during the trading day at the Stooltrading Beta Test. Get StoolieSignal Special offer here only! The cycle map below is en estimate of how the market might behave over the next few hours. Should the pattern be broken, the map should be redrawn to fit the actual. Cmaps and times shown are guidelines only. Cycles vary in wavelength and amplitude. Directional changes within an hour of the expected turn and a few points of the cmap should be respected. The indicators rule. Times and prices are the projected cycle highs and lows with cmaps. 5-8 Day Cycle______ 2-3 Day Cycle_______ 5 Hr-1 Day Cycle
Turdsday's
Markets Fed Releases Turdsday - 1/16/03 Here's what the longest running tout rag, the Whack Street Journal, had to say about Turdsday's miserable market. "In a surprise that could lift stocks on Friday, Microsoft announced after the close that it would start paying an annual dividend of 16 cents a share and declared a stock split." Then they quoted a small time market strat-ego-ist:
The article then went on to crow about IBM indicating that stability in information technology spending is a good sign, about IBM's pile of cash, and the possibility they would increase their dividend. It talked also about the good news on inflation and unemployment claims. This isn't reporting. It's industry spin. Plain and simple. Thank God for the internet and independent websites like this one, where it's possible to get to the truth. Meanwhile Mr. Bill upset the apple cart a little later in the evening. So we'll see what Mistress Market has to say about all this good news Turdsday, now won't we? Fed Turdsday Monetary Review Let's start with the fountainhead from which flows
all credit bubble economic activity, the MoGauge, from
yesterday's Anals. The current chart shows that
after a huge boom through the
summer the mortgage bubble started to deflate. Al then cut one, and has kept the
bubble on life support with constant bursts of money gas since then. The bond market is the wild card.
Those guys are watching all the money creation with a wary eye toward
inflation. Without the cooperation of Bill Gross and company as well as
foreign holders of Treasuries, the bubble is dead. With the MoGauge beginning to
falter in October, broader money measures began to shrink in December.
That shrinkage began to accelerate in the latest reporting week, ended
January 6. This, in spite of panicked, maniacal pumping by the Feed during
November and December. Once the mortgage engine downshifts, Al and the
boys are powerless to do anything about it. The Feed has shriveled so much
in relation to the size of credit bubble driven M2, M3 and MZM, that
Al just can't get it up any more. You are witnessing the opening of a real
life financial disaster movie. Even in the tiny corner of the
money supply where the Feed should have the greatest influence, Al's
impotence is obvious. M1, which has been nearly flat for more than a year,
also fell. Growth in checking accounts has been zero during the
greatest sustained debasement of currency the US has ever seen. These data
cannot be separated from the fact that the stock market can't get off its
ass and is about to get much worse. They are simply two sides of the same
coin, reflections of a system that is destroying money almost as fast is it
is created. The system has a leak in the basement of the 700 story
derivatives tower, and it is about to become a deluge as the credit sewage
treatment plant spews untreated sewage into the system. Look at the size of the drop in
the value of bank loans and leases. The tidal wave of bankruptcies is
beginning to take its toll. They can't keep hiding these festering
off balance sheet boils indefinitely. Sooner or later, the boils erupt.
When the boils pop, the banking system squeezes some more. The
next step is a credit crunch.
That's all the good Fed Turdsday news for this week, stoolies. Drop yourself in, next week, when once again, your stock proctologist reveals the stinking truth on the Fed's releases Turdsday. Be a Johnny Applestool! Help spread the Stool! Feel free to repost snippets from the Anals on message boards around the web. Just give a link back! Many tanks - Doc The Feed added $4 Billion in 28 day repos and $6 billion in overnight repos to refund $5.75 billion in overnight repos and $9 billion in 28 day repos, resulting in a net drain of $4.75 billion. The last couple rounds of 28 day repo refunding have been $3-5 billion. They stayed in that range today, but let $5 billion of the $9 billion of the expiring 28 day repos go away. They must be warily watching the dollar and the bond market. Al knows damn well, the more he debases the currency, the worse the dollar will perform, as foreign capital flees. The next step is financial collapse as a depreciating dollar and capital flight become a vicious cycle. The 4 week moving average of total Feed is flat and the Feed Index is below that line. Al's between a rock and a hard place and may have to tighten slightly to try and slow the movement of capital out of US markets. This is the Grand Catch 22, because without massive Feeding, the stock market will collapse. With it, the dollar and the bonds collapse. Two
trends are evident on the Feed Index, which is the total Fed holdings of
loans and securities. One is the 10% growth trend beginning in May of
2001. The blue channel going back to last December suggests an 8% growth rate. Look at the 4 week moving
average (brown line) and compare it with the slope of the tow larger
channels for an indication for whether the slope of short term growth is
slower or faster than the 2 longer term trends. The Feedometer fell below the short term uptrend channel, and the Slowmo Feedo is downticking. If they don't get the Feedometer up, stocks will go limp. The
Feedometer theoretically measures excess Feed available for bond or stock
market jamming. Al selects a trend level he feels is needed to reflatulate
the economy. The Feedometer measures the difference between the apparent
trend target, and actual day to day Feeding (Fastow Feedometer), as well
as a four week moving average (Slowmo Feedometer). A break above the
orange trendline might indicate a more aggressive jamming policy.
Bond yields were down slightly. Cycle juxtaposition is likely to
keep yields locked in a range of 4.0 to 4.30 for the foreseeable future.
The current short cycle down phase has a cmap of 4.0. If that 6 month
cycle begins to turn up, disaster time is here. Dow Inflatables- Two to go in the 13 day cycle down phase and the cmap is
now 8550. The
upside cmaps for the 4-7 week cycles dropped to 8850. Done. The 4-7 week cycle oscillator
has turned down, signaling a down phase in that cycle, and the end of the
bear market rally. The down phase in this cycle should last two to three weeks.
The big but is the 10-13 week cycle. It's beginning a top phase. It could be
short or it could last up to 6 weeks, with a series of short
sharp declines and rallies. Follow the indicators! All of Doc's daily cycle charts
are powered by METASTOCK Portfolio Sphincters Index (SPX) and Sentiment Cycle Chart Short Term Cycles Short cycle oscillators broke sharply. The 6-7 week cycle oscillator is also turning. (chart below) The 8-13 day cycle down phase has perhaps 2 days to go with the cmap now dropping to around 900. That could still change. Stay focused on the shorter term signals. Look to the 17 day rate of change for confirmation. 10-13 Week Cycle 10-13 week cycle signals will be late if the down phase starts early. That's why we want to key on shorter term indicators now. The 10-13 week cycle oscillators continue to move weakly higher and they will do so well beyond the price high. A breakdown in the 29 day rate of change from a flat in the neutral zone would signal a severe decline. The initial upside cmap for this cycle has been met at 935. If the market stays flat or weak for the next few days as Doc expects, the up phase is over in terms of price, although perhaps not in time. A choppy trading range with a downward bias may continue for 4-6 weeks. Sentiment VIX was down slightly. Complacency rules. (All you need do is read the financial rags to know that.) The indicator remains at the top of a 6 month channel that has marked previous intermediate highs and lows. Normally after 3 days of extension, the market begins to roll over. It did. A move to 30 or more will confirm the reversal.
The 15 day rate of change is a proxy for the
4-7 week cycle. The 29 day rate of change is a proxy for the 10-13 week
cycle. The dark blue overlaid line is the 10-13 week cycle
oscillator, while the red line is the 6-7 week cycle oscillator. The VIX
is a measure of implied options volatility reflecting relative fear or
complacency. It is plotted below on an inverse scale to better show the
relationship to the price chart. The "Stool Bands" may reflect
either 6 month or 10-12 month cycles. The Cycle Conditions tables include cycle phase and a wild guess as to number of periods to the next turn, in days for the shortest cycles, weeks (W) or months (M) for the longer ones. This is a fluid exercise, in other words, the projections are likely to be wrong, but they force us to be vigilant for key turning points, and frequently work well enough to prevent costly misreadings. SPX Cycle Conditions as of 1/16/03
PTT - Periods Till Turn Nasgap Charts The Nas is expected to behave more like the SPX with the continued de-weighting of tech. In the interest of publishing the Anals earlier in the evening Doc is presenting the charts and data without commentary, as it is largely redundant relative to the SPX commentary above. Cycle Chart Nasdaq Cycle Conditions as of 1/15/03
PTT
- Periods Till Turn Long Bong Hit - See top of page. Golden Stool Comments 1/16/03 The sideways down phase in the 6-7 week cycle may have ended. HUI's downside cmap of 139 was hit, and short cycle oscillators are beginning to reverse. The 13 day cycle initial upside cmap is 151 on HUI and 365 on gold. The 6 month cycle cmap will rise to 187 on HUI if it can get through 155, which Doc thinks is likely. The 6 month cycle target on gold is 375-385, and 405 on the 1 year cycle. The 13 week cycle remains in a down phase, the low of which is due within a week or two. After some backing and filling through the end of the month, an extended move up should ensue.
Charts as of 1/16/03 Close
Uncle Buck's Illness Comments1/17/03 6:30 AM. Updated in AM edition Uncle Buck
tanked again last night, hitting a low of $100.40 before trading up to
100.56 at 6:30 AM NY time. The 10-13 week cycle cmap is now 98-100 but the
6 month cycle cmap has dropped to 93.50. Short cycle lows are due within
days at a cmap of 99.50. Although a 6 month cycle
sideways up phase is due, the 1 year cycle is heading lower. Chart as of
1/16/03 The 1 year
cycle cmap is 94.50 due late in the second or early in the third
quarter. Get StoolieSignal Special offer here only! Suctor Watch and Stoolwethers- Now posted on separate page. Updated each morning between 8 AM and 9:00 AM NY time. See you in Intraday Stool. Dr. Stepan N. Stool Share your thoughts on the Stool Pigeons Wire.
Renewals Thank you for subscribing to the Anals of Stock Proctology. Your trial subscription will run for 90 days. At the end of that period your subscription will renew automatically, unless you cancel. If you wish to cancel your subscription use the button below. If you want to renew your subscription do nothing. Your subscription will renew and your credit card or Paypal bank account will be charged. If you want to renew, be sure your credit card information in your Paypal account is current. Paypal will not renew your subscription if the card has expired!
Explanation of Intraday Commentary-Build charts at http://www.livecharts.com. For custom time bars insert a comma after symbol and number of minutes, e.g. compx,90. This will give you a bar chart of the Nas with 90 minutes per bar. The one day cycle is usually most clear with 8 minute bars and 26/18 stochastics. It varies from day to day. Sometimes 6 minutes works best. Experiment to find the best fit for your trading style, and the market's dominant frequency at the time. The goal here is primarily to monitor the condition of the 8 and 13 day cycles. I typically use 90 minute bars with 26/18 stochastics for the 13 day cycle proxy on the indices during regular trading hours. Other cycles use 26/18 stochastics with the following: 8 days- 60 minute bars On the 24 hour futures charts, use a time per bar approximately 3 to 4 times the above number of minutes, to represent the cycles listed above. About centered moving average projections. ABBREVIATIONS: cma: centered moving average |


![[Most Recent HUI from www.kitco.com]](http://www.weblinks247.com/indexes/idx24_hui_en_2.gif)
![[Most Recent XAU from www.kitco.com]](http://www.weblinks247.com/indexes/idx24_sp500_en_2.gif)
![[Most Recent Quotes from www.kitco.com]](http://kitconet.com/charts/metals/gold/t24_au_en_usoz_2.gif)