|
Archives 12/30/01, 1/1/02, 1/2/02, 1/3/02, 1/4/02, 1/7/02, 1/8/02, 1/09/02, 1/10/02, 1/11/02, 1/14/02, 1/15/02, 1/16/02, 1/17/02, 1/18/02, 1/22/02, 1/23/02, 1/24/02, 1/25/02, 1/28/02, 1/29/02, 1/30/02, 1/31/02, 2/1/02, 2/4/02, 2/5/02, 2/06/02, 2/7/02, 2/9/02, 2/11/02, 2/12/02, 2/13/02, 2/14/02, 2/16/02, 2/19/02, 2/20/02, 2/21/02, 2/23/02, 2/25/02, 2/26/02, 2/27/02, 2/28/02, 3/1/02, 3/4/02, 3/5/02, 3/6/02, 3/7/02, 3/10/02, 3/11/02, 3/12/02, 3/13/02, 3/14/02, 3/15/02, 3/18/02, 3/19/02, 3/20/02, 3/21/02, 3/22/02, 3/25/02, 3/26/02, 3/28/02, 3/30/02 4/1/02, 4/2/02, 4/3/02, 4/4/02, 4/6/02, 4/8/02, 4/9/02, 4/10/02, 4/11/02, 4/13/02, 4/15/02, 4/16/02, 4/17/02, 4/18/02, 4/20/02, 4/22/02, 4/23/02,4/24/02,4/25/02, 4/26/02, 4/27/02, 4/29/02, 4/30/02 5/01/02, 5/2/02, 5/4/02, 5/6/02, 5/07/02, 5/8/02, 5/09/02, 5/10/02, 5/13/02, 5/14/02, 5/15/02, 5/16/02, 5/17/02, 5/20/02, 5/21/02, 5/22/02, 5/23/02, 5/24/02, 5/28/02, 5/29/02, 5/30/02 6/01/02, 6/3/02, 6/4/02, 6/5/02, 6/6/02, 6/7/02, 6/10/02, 6/11/02, 6/12/02, 6/13/02, 6/14/02, 6/17/02, 6/18/02, 6/19/02, 6/20/02, 6/22/02, 6/24/02, 6/25/02, 6/26/02, 6/27/02, 6/30/02 7/1/02, 7/4/02, 7/5/02, 7/11/02, 7/14/02, 7/15/02, 7/16/02, 7/17/02, 7/18/02, 7/19/02, 7/22/02, 7/23/02, 7/24/02, 7/25/02, 7/27/02, 7/29/02, 7/30/02 8/1/02, 8/3/02, 8/5/02, 8/6/02, 8/7/02, 8/8/02, 8/10/02, 8/12/02, 8/13/02, 8/14/02, 8/15/02, 8/16/02, 8/19/02, 8/20/02, 8/21/02, 8/22/02, 8/23/02, 8/26/02, 8/27/02, 8/28/02, 8/29/02, 8/30/02 9/3/02, 9/4/02, 9/5/02. 9/6/02, 9/9/02, 9/10/02, 9/11/02, 9/12/02, 9/13/02, 9/16/02
|
The Anals of Stock ProctologyPublished weeknights by
8:30PM Happy Acres, Florida Time The American Academy of Stock Proctology and Is your subscription up for renewal? If you want to renew, do nothing, unless your credit card has expired. Please be sure your credit card info is current. If your credit card has expired, you must enter the new expiration date in your Paypal account in order for your subscription to be processed. If you subscribed via Paypal, your subscription will be renewed for one year on the 90 day anniversary of your sign-up and your credit card will be charged. If you want to cancel, use the button at the bottom of the page. This applies only if you subscribed through Paypal. Mailed-in subscriptions are for 1 year. If you subscribed by prior contribution, I will send you a notice before your subscription expires. If you have any questions, see the subscription page and FAQ's. If you can't find the answer, email me. Bulls Get Saddamized (9/17/02) ©TGakaTheBigHurt After seeing the overnight fucutures party on Sodamn's gambit, the bottom pickers gave it 2 minutes, then went pffft. Doc had expected half a day, or a day and a half, but did not think it would result in a substantial rally, as some had feared. It was, however, even weaker than he expected. The Feed drained big time in the morning, exacerbating matters, and the news was remorselessly bad, culminating in JPM's warning after the bell. Like... we're surprised, right? True, news doesn't matter, except when it does. In this case it does because the 10-13 week cycle is down, and the 6 month cycle up phase is kaput, fini, over! The fact that bad news is having an impact is proof of that. If the market had held up in the face of the drumbeat of bad news, then we would have known the 6 month cycle was still green. But it didn't, and it's snot. Liquidity is drying up for stocks, and momentum relative to the long term trend is the worst it has ever been in this bear market. The market is headed for a very big down. Oh, sure, the stage managers will manipulate something off the July low, probably slightly above it because of pre-emptive short covering from our side, then another rally from below the lows after they clean out all the stop orders. After that it's over. And it's not going to end in October, no way. October's little fake rallies will only be the beginning of the winter of Wall Street's discontent. The bulls will definitely get it in the end. The Feed drained $6.5 billion by allowing that amount in overnight repos to expire without refunding any of it. After adding $6.5 billion yesterday, they took it back this morning as the futures were exploding to the upside on Sodamn's Gambit. The aggressive draining, helped along by bad news, knocked the pins out from under the market in the PM. Another downtick here would probably confirm that The Feed is no longer targeting the 10% growth trend. The big question would then be, what happens at the lower limit of the 8% growth channel. Anything less than a major Feed at that point would be a big shock, one the market could not survive. Three trends are evident on
the Feed Index. One is the 10% growth trend beginning in May of 2001. Feed
growth has recently been at or below the lower boundary of that trend. The
blue channel going back to last December suggests that Al may now be
targeting an 8% growth rate. Then there's the golden box which says he's stopped growing Feed altogether over the last three months. The
Feedometer theoretically
measures excess Feed available for bond or stock market jamming. Industrial metals prices, which
are tied to manufacturing activity, aren't participating in the inflation
party. There are signs that they may start to, soon.
All of Doc's
cycle charts
are powered by METASTOCK Portfolio Sphincters Index (SPX) and Sentiment The VIX rose to 41.96. It is still in neutral territory in terms of the 6 month cycle Stool band. A reading near 60, and possibly a good deal higher, is likely before the next 10-13 week cycle low. The 17 day rate of change, a proxy for the 6-7 week cycle, is still downtrending, while the 29 day rate of change indicator for the 10-13 week cycle is building a top. (Somebody please tell him he's late.) These indicators look like they are ready to get in gear for a sustained move down. The superimposed 6-7 week cycle oscillator (red line) dropped below the level of the September low. Doc misled you when he said the indicator cannot go lower. This indicator is NOT constrained, and it can go significantly lower. It just hasn't at any time in this bear market. The fact that it has now, is a sign that momentum is getting worse over time. The failure of last week's little upturn could signal a period of extreme weakness. The 10-13 week cycle oscillator (dark blue)
is unambiguous. It should be 3 to 6 weeks before a 10-13 week low.
Any bounces would be within the context of this cycle's down
phase. Yesterday it was unclear, but today it's not. This cycle is headed
for a break down, sooner, rather than later. The short cycle oscillator
is finally topping out, again a little late, which is a sign of a weak
longer term trend. The downturn is consistent with the 4 week cycle.
The 10-13 week cycle oscillator is still in a top. This gives the market a
lot of room to drop from here. The slope of the 6 and 10-12 month cycles (dark blue
channel) is slightly down. This is during an up phase! Once the downturn
comes prices could drop at an accelerated rate over 3 to 4 months. First
we'll get a good sized bounce off the level of the July low, at
which time the bottom will be proclaimed again. Not! Ridin' the Rails- Doc loves this chart. He drew a series of linear regression channels connecting various highs and lows, then extrapolated the regression lines forward to the present and future. The actual regressions begin and end at the verticals of the same color. The lines are extrapolated beyond the right vertical. As you can see, price has continually regressed to the trend projection first established between March 2000 and April 2001 (red). Except this time, instead of breaking through the mean to head for the top of the channels, the rally failed at the mean regression projection. Each rally phase is of the bear is shown in the magenta regression channels. The channels are established by including the data from the first six weeks after each low, then projecting forward. In spite of massive volatility, the recent rally had the weakest slope and failed at the lowest level relative to the long term trend. Something bad this way
comes.
Fiber Nacho Dump- Support levels and downside targets.
Fiber Nacho Reflux- Resistance levels and upside targets The Cycle Conditions tables include cycle phase and a wild guess as to number of periods to the next turn, in days for the shortest cycles, weeks (W) or months (M) for the longer ones. This is a fluid exercise, in other words, the projections are likely to be wrong, but they force us to be vigilant for key turning points, and frequently work well enough to prevent costly misreadings. SPX Cycle Conditions as of 9/16/02
PTT - Periods Till Turn Nasgap Charts The Nas ground down again. Sodamn's rally lasted two minutes. The 29 day rate of change looks like it's getting ready to get in gear with the 17 day rate of change. Look for a move to 1200 post haste. The 10-13 week cycle is in a down phase that should last 3-6 weeks. As Doc said yesterday " If the crowd can't get it up for Sodamn, this thing is going down." Enough said. The 6 month
cycle indicator looks like it's topping out. Very late, but consider that
it was late at the top of the cycle in the summer, and the Nas dropped 500
points from the point of the signal. This is a similar situation, with the
slope of the "up" phase having only been flat just like last
May. The 4 week cycle has turned down. The 6-7 week cycle looks to be
within 4 days of a low, but could drop like a stone during that time. The short cycle ozzie
sell signal was indeed a good one. The Nas will probably bounce off 1200.
If it floats up, flush!
Fiber Nacho Dump- Support levels and downside targets.
Fiber Nacho Reflux- Resistance levels and upside targets Nasdaq Cycle Conditions as of 9/17/02
PTT
- Periods Till Turn AM Edition Features (Previous) These features are in morning edition, published around 9 AM ET US, or the Saturday Weak End Edition, published, uh, let's see, Saturday! Golden Stool HUI had a good
cleanout yesterday. The downside 13 day and 4 week cycle cmap is 128. The
top phase of the 10-13 week cycle is under way. There's still an upside
unmet cmap on that cycle of 144, but it's a tossup whether that will be
made on this move.
How loooow, can you go. The indicators all point lower. Long term cmaps
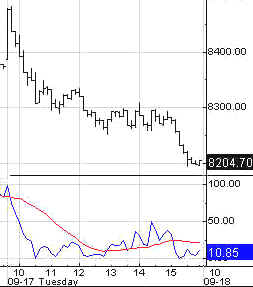
say 3.70 will be it. That's just 16 bp's away. Any day now. Uncle Buck's Illness Buck was
chasing a nurse around his room again on Tuesday, but in the end he
collapsed in exhaustion. Watch out for a fainting spell. He tried again
overnight, but got slapped right back down, trading this morning near
108.20. The verdict came in yesterday. Pretty much across the board we saw evidence that the upper channel lines of the 10-13 and 6 month cycles held and prices turned lower. That suggests a downward direction in the 10-13 week cycle down phase. In some cases (tech), the lower long term trend channels are being broken, signaling acceleration of the long term downtrend.. Aerospace- Mid-air stall.
Headed for 190. Bonkers- First test 700. Consumer - Back in channel. Retail- Multiple Whopsaws.
Double top holds. Drugs- Completes Big Giant
Whopsaw today?. Biodrech - Triangle set to
break down. Sickness Sucks- Nice short
setup. Bubble- All this good news.
Stocks dead in water. Energy - Headed for retest. Trannies - Headed for
bottom dropping. Small Craps - No longer
will float. Dirty SOX - SOX drawer
falling off track. Soft Where - Soft
everywhere. New downleg starting. Nutworkers - Dropping nuts. Internuts - Soggy nuts
still stuck to roof. Will fall when dry. Telecommies - Telecommunism
is dead. Stoolwethers - The same picture shows up in individual issues. Citicorpse JPM General Custer General McClellan FatAss Wally Market Maker Management PiG AhOL AMZN Farmer In or Out? Mr. Bill Tell Crisco BM- See you in Intraday Stool. Dr. Stepan N. Stool Share your thoughts on the Stool Pigeons Wire.
Renewals Welcome, and thank you for subscribing to the Anals of Stock Proctology. Your trial subscription will run for 90 days. At the end of that period your subscription will renew automatically, unless you cancel. If you wish to cancel your subscription use the button below. If you want to renew your subscription do nothing. Your subscription will renew and your credit card or Paypal bank account will be charged. If you want to renew, be sure your credit card information in your Paypal account is current. Paypal will not renew your subscription if the card has expired! Again, thanks for subscribing!
Explanation of Intraday Commentary-Build charts at http://www.livecharts.com. For custom time bars insert a comma after symbol and number of minutes, e.g. compx,90. This will give you a bar chart of the Nas with 90 minutes per bar. The one day cycle is usually most clear with 8 minute bars and 26/18 stochastics. It varies from day to day. Sometimes 6 minutes works best. Experiment to find the best fit for your trading style, and the market's dominant frequency at the time. The goal here is primarily to monitor the condition of the 8 and 13 day cycles. I typically use 90 minute bars with 26/18 stochastics for the 13 day cycle proxy on the indices during regular trading hours. Other cycles use 26/18 stochastics with the following: 8 days- 60 minute bars On the 24 hour futures charts, use a time per bar approximately 3 to 4 times the above number of minutes, to represent the cycles listed above. ABBREVIATIONS: cma: centered moving average
|

![[Most Recent HUI from www.kitco.com]](http://www.weblinks247.com/indexes/idx24_hui_en_2.gif)
![[Most Recent XAU from www.kitco.com]](http://www.weblinks247.com/indexes/idx24_sp500_en_2.gif)
![[Most Recent Quotes from www.kitco.com]](http://kitconet.com/charts/metals/gold/t24_au_en_usoz_2.gif)