|
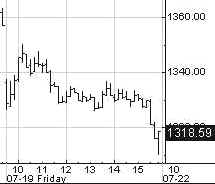
10 Minute Bar Charts 7/19/02 Dow Jokes Inflatables
Archives 12/30/01, 1/1/02, 1/2/02, 1/3/02, 1/4/02, 1/7/02, 1/8/02, 1/09/02, 1/10/02, 1/11/02, 1/14/02, 1/15/02, 1/16/02, 1/17/02, 1/18/02, 1/22/02, 1/23/02, 1/24/02, 1/25/02, 1/28/02, 1/29/02, 1/30/02, 1/31/02, 2/1/02, 2/4/02, 2/5/02, 2/06/02, 2/7/02, 2/9/02, 2/11/02, 2/12/02, 2/13/02, 2/14/02, 2/16/02, 2/19/02, 2/20/02, 2/21/02, 2/23/02, 2/25/02, 2/26/02, 2/27/02, 2/28/02, 3/1/02, 3/04/02, 3/05/02, 3/06/02, 3/7/02, 3/10/02,3/11/02, 3/12/02, 3/13/02, 3/14/02, 3/15/02, 3/18/02, 3/19/02, 3/20/02, 3/21/02, 3/22/02, 3/25/02, 3/26/02, 3/28/02, 3/30/02 4/1/02, 4/2/02, 4/3/02, 4/4/02, 4/6/02, 4/8/02, 4/9/02, 4/10/02, 4/11/02, 4/13/02, 4/15/02, 4/16/02, 4/17/02, 4/18/02, 4/20/02, 4/22/02, 4/23/02,4/24/02,4/25/02, 4/26/02, 4/27/02, 4/29/02, 4/30/02 5/01/02, 5/2/02, 5/4/02, 5/6/02, 5/07/02, 5/8/02, 5/09/02, 5/10/02, 5/13/02, 5/14/02, 5/15/02, 5/16/02, 5/17/02, 5/20/02, 5/21/02, 5/22/02, 5/23/02, 5/24/02, 5/28/02, 5/29/02, 5/30/02 6/01/02, 6/3/02, 6/4/02, 6/5/02, 6/6/02, 6/7/02, 6/10/02, 6/11/02, 6/12/02, 6/13/02, 6/14/02, 6/17/02, 6/18/02, 6/19/02, 6/20/02, 6/22/02, 6/24/02, 6/25/02, 6/26/02, 6/27/02, 6/30/02 7/1/02, 7/4/02, 7/5/02, 7/11/02, 7/14/02, 7/15/02, 7/16/02, 7/17/02, 7/18/02
|
The Anals of Stock ProctologyPublished weeknights by
8:30PM Happy Acres, Florida Time The American Academy of Stock Proctology and Is your subscription up for renewal? If you want to renew, do nothing. If you subscribed via Paypal, your subscription will be renewed for one year on the 90 day anniversary of your sign-up and your credit card will be charged. If you want to cancel, use the button at the bottom of the page. This applies only if you subscribed through Paypal. Mailed-in subscriptions are for 1 year. If you subscribed by prior contribution, I will send you a notice before your subscription expires. If you have any questions, see the subscription page and FAQ's. If you can't find the answer, email me. PM Update 7/22/02 2:20 PM Terms and methodology So much for weak sideways up phase. The cmaps on this move are 1315 on the Nas, 842 on the SPX mand 964 in the NDX. As soon as they were hit the market immediately reversed. The 5 day cycle ozzies have turned up, but we need to see the pullback before we can tell whether that's for real, or whether it's more than just a swup. PM Update 7/22/02 1:10 PM Terms and methodology Just before 1 PM buyers appeared and put in a 1 day cycle low on the revised targeted time. However, these are not exactly well charted waters. I do not expect anything more than a weak sideways up phase at this point. The downtrend deserves respect. On the other hand, the time window is open for both the 5 and 8 day cycle lows, and the same goes for the all important 10-13 week cycle. You must be alert, and as always, use protection. The 1 day cycle high looks like it should be around 1 to 1:45 PM. No upside cmaps. If any index makes new intraday high, the 5 day cycle low is probably in. Higher low would confirm. Cmaps for 5 day cycle low due today have been adjusted down again. Intraday higher high, higher low sequence would probably abort that projection. 5 day cycle cmap on Dow is 7600. Doc does not make trading recommendations. This update reports intraday time cycle estimates and centered moving average projections based on the Hurst cycle analysis method. Doc assumes no responsibility for the accuracy or inaccuracy of these estimates and projections. The market may or may not meet these projections. New stoolies should thoroughly familiarize themselves with the methodology before trading based on this method. There is no free lunch. Those who do not have the time or inclination to develop a trading strategy based on testing and research should not trade. Trade at your own risk. On the other hand, if you made any extra this week on account of The Stool, send it in!
AM Update 7/22/02 11:50 AM Terms and methodology Market going into crash mode has broken all 1 day cycle cmaps and now at 5 day cmaps posted below. Once this runs it's course, I will post updated cmaps for the 5 day cycle. AM Update 7/22/02 11:30 AM Terms and methodology Just changed the cmap for this move to 828 on the SPX. AM Update 7/22/02 11:10 AM Terms and methodology The 1 day cycle cmaps and timings performed nicely. The averages hit them almost to the "T", although the Dow got a lot more support and did not come close to its projected 1 day cycle low. Now looks like those two blips up were the cycle highs. In view of that the lows would appear to be between now and 1:30, almost the opposite of what it looked like it would be before the open. Just goes to show that it's never a good idea to look around the corner. Better to wait and let the market tip its hand.
AM Update 7/22/02 8 AM Terms and methodology No crash this morning. But no knee jerk rally either. I continue to expect that put writers getting tons of stock stuffed down their throats today will be sellers, and that the market will melt down later. But it may not begin until after lunch, as it appears that support operations are underway. Those operations include jawboning by all the usual suspects over the weekend. It appears to have worked for now. The operative word is appears. The PPT and others went into full fledged jam mode at 7 AM. The 1 day and 5 hour cycle lows are due in the first hour. The next 5 hour high is due at 12:30 with a 1 day cycle high due at 1:30. The 5 day cycle low is due today. The cmaps below are based on Friday's market action. Fucutures action this morning is not considered. The projection for the Dow is 7700, a 300 point loss from Friday. Disregarding the fucutures because of the suspected manipulation, the 1 day cycle lows are projected as shown in the chart. The projection for the Dow is 7875. At this point (7:45 AM NY time), there's no sign of anything dramatic. Just more of the same of what we've been seeing in recent weeks. I'm adding an extra update today. The next update will be at 11 AM or earlier if required. I'll post a notice on Intraday Stool.
The End of Innovation 7/20/02 Today in the Anals Weak End Edition, Doc focuses on a theme being suggested by the behavior of the long term charts covering scientific and technological pursuits. The question is whether we have reached the end of the line for innovation. History tells that scientific and technological development comes in spurts lasting a few hundred years. Society then fails to advance for a thousand years. Have we reached the point where innovation is only increasingly at the margin, and either increasingly less useful, or beyond our ability or need to use it? These are questions to ponder as we consider the evidence that this secular bear market will certainly last for at least a generation. Does it go beyond even that? Have we reached the end of history as one academic postulated some years back. Is this the Grand Supercycle Top? I'd like to hear your views. The Feed fed Friday, adding $2.75 billion in weekend repos, and $2.9 billion in a bill pass for a net addition of $3.9 billion. $1.75 billion in overnight repos expired. Only Friday's $2.75 billion in weekend repos will be expiring on Monday. The new money comes as no surprise, with the total Feed at the bottom of the Feed's 10% growth channel. Look for a really huge Feed on Monday, in the wake of the market meltdown. If history is any guide that will turn the market around 2:30. Based on this weeks market action, it's safe to conclude that there are growing dislocations in the banking system, and Al is certain to step up, not as the stockholder of last resort, but in the Fed's rightful role of lender of last resort. Doc looks forward to this weekend's edition of Doug Noland's Credit Bubble Bulletin, which is required reading for stoolies. The Feed has room to jam, and the
excuse to do it. Even if the Feed jams, will it
matter? It didn't last summer, and it hasn't mattered this summer either.
As always, stay focused on the stock market indicators for the first line
on the market's future behavior.
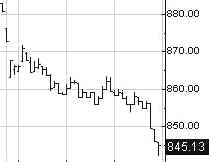
Portfolio Sphincters Index (SPX) and Sentiment The Sphincters Index dumped almost 34, to 845. The drop sent the cmaps slightly lower again, this time to 810-830. The 17 day rate of change, which represents the 6-7 week cycle, fell out of bed as the market accelerated down. It is nearing the level reached at the September low. The superimposed 6-7 week cycle oscillator (red) continued to head down. The 29 day rate of change also dove. This indicator should stabilize and turn up ahead of price when the 10-13 week cycle turns. The 10-13 week cycle oscillator (navy) broke to a new low for this move. All momentum based indicators are therefore again in gear to the downside. The VIX rose to 43.45, still within the Stool Band projection channel on the inverted scale chart. At a major low, extreme fear readings normally persist for several days. A buy signal is generated when the index drops below the blue band and then reverses. At this point that will be a reading of more than 50. Again, we won't know where the extreme is until after the index finally turns. The chart should be read just as you would a stock price chart. The blue channel lines are the extension of a linear
regression channel from the September 2000 and March 2002 highs. The 6 month cycle oscillator is still moving gradually lower. The trading stoolicator turned down a little more. The short cycle oscillator dropped sharply after a whipsaw week. The 10-13 week cycle oscillator also began to fall more aggressively after meandering for a couple of weeks. The indicators are all in gear to the downside. Until they turn, the trend is down.
Here are today's fiber nacho
dump levels. Surprise, surprise, they stopped at a fibo level
Friday. Nothing but air between here and a really big one - 800. The Cycle Conditions tables include cycle phase and a wild guess as to number of periods to the next turn, in days for the shortest cycles, weeks (W) or months (M) for the longer ones. This is a fluid exercise, in other words, the projections are likely to be wrong, but they force us to be vigilant for key turning points, and frequently work well enough to prevent costly misreadings. SPX Cycle Conditions as of 7/19/02
PTT - Periods Till Turn If the SPX gets to or breaks 800 in the short
run, based on the weekly chart, that would look like a great time to cover
shorts. Given the position of the intermediate cycle oscillator, the
low should form within the next two weeks. Looking at a very long term perspective, the
centered moving average projection for the four year cycle is 600 on a
linear basis, and 750 on a percentage basis. Alternatively, measuring from
the head of the hunchback to the neckline, the difference is 550 points.
The neckline is around 970. Subtracting 550 leaves, uh, ... ok, 420. We'll
leave that for the next cycle. Nasgap Charts In spite of losing 38 points Friday, the Nas hasn't quite dropped out of the bottom of its sideways up phase. The 10-13 week cycle oscillator is just beginning to roll over again, and has room to drop again. We could see an air pocket Monday. Cmaps now point to the low 1200 range, with the possibility of a second low a couple weeks out which breaks 1100.
The Nasty
decline stopped at a neat fiber nacho barf level of 161.8% of the prior 2
day rally. Breaking 1300 is probably a fait accompli. Below that is air,
until 1235-45. Nasdaq Cycle Conditions as of 7/18/02
PTT
- Periods Till Turn The
projection of the secular channel (pink) on the weekly chart is just a
guess. I suspect the Nas will reach the lower long term cycle band. (light
green) There
are many ways to project a price target. On a super long term view the 4
year cycle centered moving average projection is zero on a linear basis,
but only 1100 on a percentage basis. Doc drew it conservatively. It should
still shift lower. Using 2 year cycle cmaps, we're looking at 800 (not
shown), which is about where the long term uptrend line intersects with
the line connecting recent lows. If you use conventional measuring
techniques, measuring from the head of the hunchback down to the neckline
you get zero on a linear basis. On a percentage basis the loss from the
head to the neckline is about 2/3. Measuring from the neckline break down
by 2/3 gets us to 500 or 600. That should happen within the next six to
nine months. It will probably take a few more years to get to zero. AM Edition Features (Previous) These features are in morning edition, published around 9 AM ET US, or the Saturday Weak End Edition.. If bond yields
don't turn up now, the question that comes to mind -- are we looking at a
Japan-like situation where yields go to zero? Seems counter-intuitive, but
it's a thought. Let's take a long term view of some key suctors. First, the
banks. I zoomed out on this one to give you the big picture. The secular
trend has reversed. But they still haven't broken down from the top.
Secular support is at 600-650. The Con-sumer
stocks are an example of another secular reversal, this time by means of a
crash. Downside is probably only 5-10% more on this wave. Retail is a
copy of the consumer index with more volatility. The behavior
of the drug stocks along with the collapse in tech, makes Doc wonder if we
have reached the end of the line in terms of technological and scientific
innovation. History shows that civilization goes through a couple of
centuries of rapid technological change then stagnates for maybe a
thousand years. Is civilization entering one of those periods of
stagnation? Just a thought. Anyway, in the short run, the drugs have
stretched the bungee beyond the limit. If one was thinking of playing a
bungee rebound (scary thought) this should be a place to look. Or maybe
the cord just broke. The midcaps
were where the Street said the "stealth bull market" was.
Actually, it wa just the final blowoff. But alas, an intermediate low is
near. Same
comments apply to small craps. A wildly cyclical, illiquid suctor, in a
secular top. There never was a bull market here, although Wall Street
wanted you to think there was. The mental institutions knew they had
gotten themselves into a bind by loading up on the small stocks, and they
were trying to distribute them to you. The SOX
appear headed for 300 where they should bounce. Energy has
always been cyclical, but this has the earmarks of a massive secular
top. The software
index chart again raises the question, has technological innovation
reached its limit. The chart is clearly breaking down the secular trend,
perhaps at an accelerating rate. The telecoms
index is headed for 250, down another 40% from current levels. Mafiasoft
has been in a sideways up phase for a year and a half. It's coming to an
end. The stock is headed for 28. But it will take a long time to get
there. Look at that classic triangle breakdown and return to the scene of
the crime. That's probably the mid point of the downtrend. A lot of bears
have been asking for a good kick in the Fannie. Well here it comes. My goodness
Wally broke down suddenly. If there's no liquidity in the most widely held
stock in America, what does that say. The picture is again one of an enormous
secular top. This chart
says IBM is in a sideways up phase for the past few weeks. After that it's
going to 50. GM is headed
for 36-38 in the near future. Last but not
least, Crapvision's parent company is headed for a rendezvous with 24. Henceforth and forevermore, if you would like to request a "stock o'der", please post your request in Dear Dr. Stool. If you have not already registered for the message board, please do so. The only required info is user name and password which you choose yourself, and your email address, which you can keep private by selecting the keep private option. Doc looks forward to featuring your ideas. We've had some good ones! Uncle Buck's Dolor
No longer Uncle Buck's Illness, now Uncle Buck's Dolor, (thanks to stoolie
Jeff456), Greenie said in Congressional testiclemoney last week that the
Feed has spent inordinate amounts of resources trying to come up with a
model that will predict the behavior of the dolor. Doc doesn't understand
why they just didn't pick up the phone and call. We haven't had any
problem with that at all. And the poodits keep coming on Crapvision saying
something about an orderly decline, What the HELL are they talking about?
This is a collapse. And the damn thing is accelerating. Uncle Buck is
headed for the 1998 lows, lickety split. Golden Stool On the weekly
chart, the price of gold (POG) looks like it is ready to blow the roof
off. Doc has been anticipating this. Now we'll see. On the weekly
chart of the gold stocks, the sideways up phase isn't quite over. But the daily
chart says it's damn close. See you in Intraday Stool. Dr. Stepan N. Stool Let me know what you think on the Stool Pigeons Wire. Renewals Welcome, and thank you for subscribing to the Anals of Stock Proctology. Your trial subscription will run for 90 days. At the end of that period your subscription will renew automatically, unless you cancel. If you wish to cancel your subscription use the button below. If you want to renew your subscription do nothing. Your subscription will renew and your credit card or Paypal bank account will be charged. Again, thanks for subscribing!
Explanation of Intraday Commentary-Build charts at http://www.livecharts.com. For custom time bars insert a comma after symbol and number of minutes, e.g. compx,90. This will give you a bar chart of the Nas with 90 minutes per bar. The one day cycle is usually most clear with 8 minute bars and 26/18 stochastics. It varies from day to day. Sometimes 6 minutes works best. Experiment to find the best fit for your trading style, and the market's dominant frequency at the time. The goal here is primarily to monitor the condition of the 8 and 13 day cycles. I typically use 90 minute bars with 26/18 stochastics for the 13 day cycle proxy on the indices during regular trading hours. Other cycles use 26/18 stochastics with the following: 8 days- 60 minute bars On the 24 hour futures charts, use a time per bar approximately 3 to 4 times the above number of minutes, to represent the cycles listed above. ABBREVIATIONS: cma: centered moving average |
|||||||||||||||||||||||||||||||||||||||||||||||||||||||||||||||||||||||||||||||||||||||||||||||||||||||||||||||||||||||||||||||||||||||||||||||||||

![[Most Recent XAU from www.kitco.com]](http://www.weblinks247.com/indexes/idx24_nasdaq_en_2.gif)
![[Most Recent XAU from www.kitco.com]](http://www.weblinks247.com/indexes/idx24_sp500_en_2.gif)
![[Most Recent Quotes from www.kitco.com]](http://kitconet.com/charts/metals/gold/t24_au_en_usoz_2.gif)
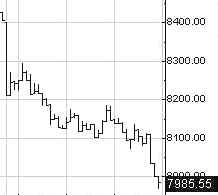
 When
the market goes vertical, both the risks and rewards for bears increase.
Friday's near 400 point decline (stage managed to close above 8,000 after
the bell.) caused the centered moving average projections to move down to
7350-7950, a much larger than normal range. This happens as the cycle
nears its end and goes vertical. The problem is that vertical declines
beget "V" shaped bottoms, requiring short side traders to be
vigilant and alert to the possibility of a sold out market turning
violently. With the key 10-13 week trading cycle entering its 13th week,
that day could come at any time this week. The cycle could also extend
beyond the normal 13 weeks. What makes it especially difficult is that we
don't want to leave anything on the table. At this stage the market could
move 1500 points in 3 days.
When
the market goes vertical, both the risks and rewards for bears increase.
Friday's near 400 point decline (stage managed to close above 8,000 after
the bell.) caused the centered moving average projections to move down to
7350-7950, a much larger than normal range. This happens as the cycle
nears its end and goes vertical. The problem is that vertical declines
beget "V" shaped bottoms, requiring short side traders to be
vigilant and alert to the possibility of a sold out market turning
violently. With the key 10-13 week trading cycle entering its 13th week,
that day could come at any time this week. The cycle could also extend
beyond the normal 13 weeks. What makes it especially difficult is that we
don't want to leave anything on the table. At this stage the market could
move 1500 points in 3 days.