|
Archives 12/30/01, 1/1/02, 1/2/02, 1/3/02, 1/4/02, 1/7/02, 1/8/02, 1/09/02, 1/10/02, 1/11/02, 1/14/02, 1/15/02, 1/16/02, 1/17/02, 1/18/02, 1/22/02, 1/23/02, 1/24/02, 1/25/02, 1/28/02, 1/29/02, 1/30/02, 1/31/02, 2/1/02, 2/4/02, 2/5/02, 2/06/02, 2/7/02, 2/9/02, 2/11/02, 2/12/02, 2/13/02, 2/14/02, 2/16/02, 2/19/02, 2/20/02, 2/21/02, 2/23/02, 2/25/02, 2/26/02, 2/27/02, 2/28/02, 3/1/02, 3/04/02, 3/05/02, 3/06/02, 3/7/02, 3/10/02,3/11/02, 3/12/02, 3/13/02, 3/14/02, 3/15/02, 3/18/02, 3/19/02, 3/20/02, 3/21/02, 3/22/02, 3/25/02, 3/26/02, 3/28/02, 3/30/02 4/1/02, 4/2/02, 4/3/02, 4/4/02, 4/6/02, 4/8/02, 4/9/02, 4/10/02, 4/11/02, 4/13/02, 4/15/02, 4/16/02, 4/17/02, 4/18/02, 4/20/02, 4/22/02, 4/23/02,4/24/02,4/25/02, 4/26/02, 4/27/02, 4/29/02, 4/30/02 5/01/02, 5/2/02, 5/4/02, 5/6/02, 5/07/02, 5/8/02, 5/09/02, 5/10/02, 5/13/02, 5/14/02, 5/15/02, 5/16/02, 5/17/02, 5/20/02, 5/21/02, 5/22/02, 5/23/02, 5/24/02, 5/28/02, 5/29/02, 5/30/02 6/01/02, 6/3/02, 6/4/02, 6/5/02, 6/6/02, 6/7/02, 6/10/02, 6/11/02, 6/12/02, 6/13/02, 6/14/02, 6/17/02, 6/18/02, 6/19/02, 6/20/02, 6/22/02, 6/24/02, 6/25/02, 6/26/02, 6/27/02, 6/30/02 7/1/02, 7/4/02, 7/5/02, 7/11/02, 7/14/02, 7/15/02, 7/16/02, 7/17/02, 7/18/02, 7/19/02, 7/22/02, 7/23/02, 7/24/02, 7/25/02, 7/27/02, 7/29/02, 7/30/02 8/1/02, 8/3/02, 8/5/02, 8/6/02, 8/7/02, 8/8/02, 8/10/02, 8/12/02, 8/13/02, 8/14/02, 8/15/02, 8/16/02, 8/19/02, 8/20/02, 8/21/02, 8/22/02, 8/23/02, 8/26/02, 8/27/02, 8/28/02, 8/29/02, 8/30/02 9/3/02, 9/4/02, 9/5/02. 9/6/02, 9/9/02, 9/10/02, 9/11/02, 9/12/02, 9/13/02, 9/16/02, 9/17/02, 9/18/02, 9/19/02, 9/20/02, 9/23/02, 9/24/02, 9/25/02, 9/26/02, 9/27/02, 9/30/02 10/1/02, 10/2/02, 10/3/02, 10/4/02, 10/7/02, 10/8/02, 10/9/02, 10/10/02, 10/11/02, 10/14/02, 10/15/02, 10/16/02, 10/17/02, 10/18/02, 10/21/02, 10/22/02, 10/23/02, 10/24/02, 10/25/02, 10/28/02, 10/29/02, 10/30/02, 10/31/02 11/1/02, 11/4/02, 11/5/02, 11/6/02, 11/7/02, 11/8/02, 11/11/02, 11/12/02, 11/13/02, 11/14/02, 11/15/02, 11/18/02, 11/19/02, 11/20/02, 11/21/02, 11/22/02, 11/25/02, 11/26/02, 11/27/02, 11/29/02 12/2/02,
12/3/02, 12/4/02,
12/5/02 1/1/03, 1/2/03, 1/03/03, 1/6/03, 1/7/03, 1/8/03, 1/9/03, 1/10/03, 1/13/03, 1/14/03, 1/15/03, 1/16/03, 1/17/03, 1/21/03, 1/22/03, 1/23/03, 1/24/03, 1/27/03, 1/28/03, 1/29/03, 1/30/03, 1/31/03 2/3/03, 2/4/03, 2/5/03, 2/6/03, 2/7/03, 2/10/03, 2/11/03, 2/12/03, 2/13/03
 Doc's view of the Street. |
The Anals of Stock ProctologyPublished weeknights by
8:30PM Happy Acres, Florida Time The American
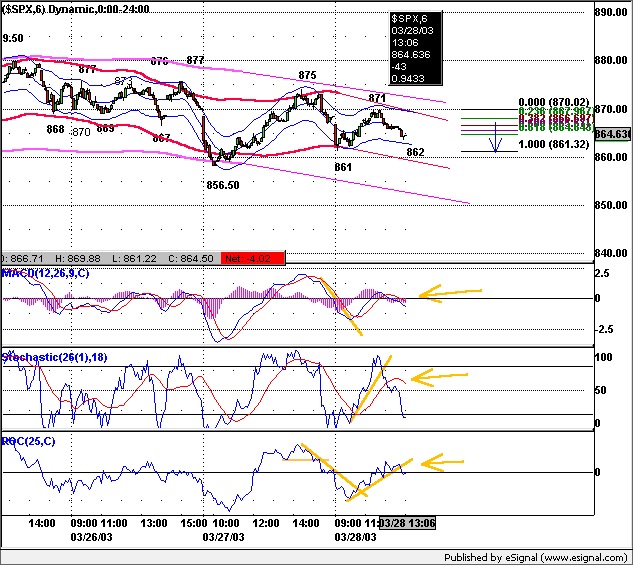
Academy of Stock Proctology and Is your subscription up for renewal? If you want to renew, do nothing, unless your credit card has expired. Please be sure your credit card info is current. If your credit card has expired, you must enter the new expiration date in your Paypal account in order for your subscription to be processed. If you subscribed via Paypal, your subscription will be renewed for one year on the 90 day anniversary of your sign-up and your credit card will be charged. If you want to cancel, use the button at the bottom of the page. This applies only if you subscribed through Paypal. Mailed-in subscriptions are for 1 year. If you subscribed by prior contribution, I will send you a notice before your subscription expires. If you have any questions, see the subscription page and FAQ's. If you can't find the answer, email me. Big Fine Print Doc does not make trading recommendations. This update reports time cycle estimates and centered moving average projections based on the Hurst cycle analysis method, and other techniques. This publication is for entertainment and educational purposes only. Doc assumes no responsibility for the accuracy or inaccuracy of the estimates and projections presented. The market may or may not meet the projections. Stoolies should thoroughly familiarize themselves with the methodology before trading based on this method. Those who do not have the time or inclination to develop a trading strategy based on testing and research should not trade. Trade at your own risk. Yadda yadda. How's your motha? More disclaimers at the bottom of the page. Intraday Updates 2/19/03 1:00 PM As so often happens during scam week, intraday cycle timing is impossible. Doc is concentrating on the cmaps and sees no sign of breakout from the narrow trading range. The 3 day cycle has topped out and 8 day cycles are in the process of topping. Down phase should be shallow in the up phase of 6-7 week cycle until it stops, rolls and drops. Chart below. Get regular updates throughout the day in Stooltrading. 9:15 AM Fucutures made an overnight cycle low around 4 AM NY time, rallied until 8:30then sold off a bit. The narrow range suggests the market will trade around 848-850 this morning. NO change in timing expectations posted last night. Intraday Tuesday - An illiquid market exploded upward from the get go setting a 5 hour cycle high around 10:30 and a 1 day cycle high around 1 PM. They drifted lower for the rest of the afternoon, forming a 1 day cycle low at 3:45. The shorts then panicked into the close. That should be another 5 hour cycle high. A 1 day cycle high is due around 11 AM. At this point it does not look like it will be as high as the close. Depends if they can get some of those market makers back to their trading screens tomorrow. Pre Market Update at 9:15 AM NY time. Get StoolieSignal Special offer here only! The cycle map below is en estimate of how the market might behave over the next few hours. Should the pattern be broken, the map should be redrawn to fit the actual. Cmaps and times shown are guidelines only. Cycles vary in wavelength and amplitude. Directional changes within an hour of the expected turn and a few points of the cmap should be respected. The indicators rule. Times and prices are the projected cycle highs and lows with cmaps. 5-8 Day Cycle______ 2-3 Day Cycle_______ 5 Hr-1 Day Cycle
Monday's
Markets 2/18/03 Snowzilla Stomps The Bears The stock market looks scary to bears, but so far this a typical 6-7 week cycle up phase in a 10-13 week cycle downtrend. It should end tomorrow. If it extends beyond that, then it's another story. If the market seems like it doesn't make sense, consider the long term view posted over the weekend. The market remains in a 10-12 month and 18 month cycle top. In the short run, it's painful. But it can carry to 870 and it would be nothing more than a return to the scene of the crime, i.e. a rally back the break down from the top pattern. All part of the process of the Street accomplishing its primary function, distribution of stock to the public. The
green arrows point to 6-7 week cycle up phases which occurred in the
middle of bigger cycle downtrends. Doc's Pooper Scooper. Be a Johnny Applestool! Help spread the Stool! Feel free to repost snippets from the Anals on message boards around the web. Just give a link back! Many tanks - Doc The Feed added $15 Billion in overnight repos for a net addition of $13 billion. $2 billion in 4 day repos expired. The $15 billion expires Wednesday. Then Turdsday, $9.5 billion in 7 and 8 day repos will expire, along with the usual 28 day repos in the amount of $4 billion. Doc believes that the enormous Feed was related to the weather in the Northeast, and in New York in particular. Bank transaction clearing operations were effected and market making activities were severely curtailed as well. If indeed, this was the reason the move should be unwound over the next couple of days. Two
trends are evident on the Feed Index, which is the total Fed holdings of
loans and securities. One is the 10% growth trend beginning in May of
2001. The blue channel going back to last December suggests a 5% growth rate. Look at the 4 week moving
average (brown line) and compare it with the slope of the two larger
channels for an indication for whether the slope of short term growth is
slower or faster than the 2 longer term trends. A number of stoolies are convinced there was something diabolical about this Feed. Doc doesn't think so, but we'll know in a day or two if this spike isn't reversed. The
Feedometer theoretically measures excess Feed available for bond or stock
market jamming. Al selects a trend level he feels is needed to reflatulate
the economy. The Feedometer measures the difference between the apparent
trend target, and actual day to day Feeding (Fastow Feedometer), as well
as a four week moving average (Slowmo Feedometer). A break above the
orange trendline might indicate a more aggressive jamming policy. If they break the Feed out above the gold channel and the market moves with it, Doc may have to rethink some things. Several historic bubbles (well, let's make that all the bubbles he can think of in the last hundred years) have a history of massive rallies 30-35 months after the market top. The Dow peaked in August 1929, bottomed 35 months later in July 1932, and doubled over the next two months. The Nukieu went on a 12 month long, 40% tear, beginning 31 months after topping out in December 1989. It first based for 7 months. The rally actually began in the 39th month after the high. Gold rose 60% in 6 months, 31 months after topping out in 1989. The October low in the Nas was 31 months after the March 2000 high. We are now in the 37th month.
10 Year Bond yields rose early
but fell back late to close down slightly. The daily chart illustrates the multiple cycle juxtaposition that is
keeping yields in a narrow range. There's no sign yet of an end to that and no
sign of a breakout either way. Dow Inflatables- The
downside cmap on the 10-13 week cycle has risen to 7550. Another day
like Tuesday, and we may not see that level. The 6-7 week
cycle up phase can last for another 5-10 days. The upside cmap on the 13
day cycle is 8090, but if the market doesn't reverse tomorrow, that too
will go higher. Resistance is at 8150. All of Doc's daily cycle charts
are powered by METASTOCK Portfolio Sphincters Index (SPX) and Sentiment Cycle Chart Short Term Cycles The short cycle oscillator rose again and is entering the top zone, aka overbought. The 6-7 week cycle is in an up phase, with 5-10 days to go. Look for some wild swings in the next week or two. If the SPX can go through several rows of brick in the 850-860 area, the bear army will be routed and will be in full retreat. Do thinks they will hold that line. The 6-7 week cycle oscillator on the chart below is rising sharply. It's going to take more than a day of distribution to reverse the momentum. Doc believes that the sequence of this indicator turning down, followed by a higher low, will mark a more important cycle low, probably no sooner than mid-March. The 17 day rate of change (chart below) is moving up, but normally, a 10-13 week cycle bottom is preceded by a positive divergence. That's another reason Doc expects another decline. The current configuration does not support a big rally. 10-13 Week Cycle Roughly 4 to 7 weeks should remain in the 10-13 week cycle down phase. The cycle oscillators upticked but there's still not enough there to signal a cycle upturn. If tomorrow is very strong, then a six month cycle low is indicated, and it will take weeks of churning, with one or more higher highs, before another down leg. Doc doesn't like to deal in "what ifs", but the oscillator configurations are so close, that he'd be remiss at this point if he didn't mention this possibility. All indicators for this cycle would need to turn to signal a substantial rally. Follow the indicators if it happens. The preliminary cmap for this cycle has risen to 810, a level we hit last Turdsday. It would be very unusual to get a big rally without going back for a retest first. Sentiment VIX fell sharply. (up on the inverted scale chart). In the context of the current cycle, the reading is neutral. The next significant intermediate cycle low should reach at least 50-60. A reading in the low 30's would be a renewal of the sell signal.
The 17 day rate of change is a proxy for the
6-7 week cycle. The 29 day rate of change is a proxy for the 10-13 week
cycle. The dark blue overlaid line is the 10-13 week cycle
oscillator, while the red line is the 6-7 week cycle oscillator. The VIX
is a measure of implied options volatility reflecting relative fear or
complacency. It is plotted below on an inverse scale to better show the
relationship to the price chart. The "Stool Bands" may reflect
either 6 month or 10-12 month cycles. The Cycle Conditions tables include cycle phase and a wild guess as to number of periods to the next turn, in days for the shortest cycles, weeks (W) or months (M) for the longer ones. This is a fluid exercise, in other words, the projections are likely to be wrong, but they force us to be vigilant for key turning points, and frequently work well enough to prevent costly misreadings. SPX Cycle Conditions as of 2/18/03
PTT - Periods Till Turn Suctor Watch and Stoolwethers- Updated each morning between 8 AM and 9:00 AM NY time. Nasgap Charts The Nas is expected to behave more like the SPX with the continued de-weighting of tech. In the interest of publishing the Anals earlier in the evening Doc is presenting the charts and data without commentary, as it is largely redundant relative to the SPX commentary above. Cycle Chart Nasdaq Cycle Conditions as of 2/18/03
PTT
- Periods Till Turn Suctor Watch and Stoolwethers- Updated each morning between 8 AM and 9:00 AM NY time. Long Bong Hit - See top of page. Golden Stool 2/18/03 PM Gold got whacked
again as the chain reaction fallout from last week's surprise increase in margin requirements slowly winds down.
Short cycle cmaps dipped to 340-345 on a closing basis. Long term upside cmaps have come down, now at only
375 - 385.
The 9 month cycle oscillator looks like a top. Short cycle lows are due
this week. Doc is expecting a pretty good snapback, but it will
probably be part of a new long term trading range of 345-385 that could
last a year or more.
HUI Dumpty had another slight fall but he's closing in on a low and will live to fight again. Holders of the stocks do not have the margin issues of the fucutures players. The 4 month (or 13 week, take your pick) cycle has been in a sideways down phase for 6 weeks. The bottom is due any day now, as are short cycle lows. Cmaps are 125-133. The 10-12 month cycle oscillator is still rising but a top is due and upside cmaps have dropped to levels already hit. This also suggests months of consolidation ahead in the 125 to 150 range. HUI Cycle Conditions as of 2/18/03
Uncle Buck's Illness A resurgent Uncle Buck rose again as his 13 week cycle swup continued. Short cycle upside cmaps rose to 101. This also looks like it may be a six month cycle low but Doc isn't sure about that. For now, I've drawn the chart that way. Buck may stabilize in a range of 99 to 101.50 for several months, but longer term cmaps are as low as 88-90 looking toward 2004. Chart as of 2/18/03 close Uncle B and SPX (gray line on chart)
usually move together because Uncle Buck's index measures the flow of
capital into and out of US paper assets. The relative magnitude of the
moves varies and wide divergences are followed by convergence.
Central banks intervening to buy dollars are not
going to help stock prices, and cannot drive sustainable advances in the
dollar.
Get StoolieSignal Special offer here only! Suctor Watch and Stoolwethers- Now posted on separate page. Updated each morning between 8 AM and 9:00 AM NY time. See you in Intraday Stool. Dr. Stepan N. Stool Share your thoughts on the Stool Pigeons Wire.
Renewals Thank you for subscribing to the Anals of Stock Proctology. Your trial subscription will run for 90 days. At the end of that period your subscription will renew automatically, unless you cancel. If you wish to cancel your subscription use the button below. If you want to renew your subscription do nothing. Your subscription will renew and your credit card or Paypal bank account will be charged. If you want to renew, be sure your credit card information in your Paypal account is current. Paypal will not renew your subscription if the card has expired!
Explanation of Intraday Commentary-Build charts at http://www.livecharts.com. For custom time bars insert a comma after symbol and number of minutes, e.g. compx,90. This will give you a bar chart of the Nas with 90 minutes per bar. The one day cycle is usually most clear with 8 minute bars and 26/18 stochastics. It varies from day to day. Sometimes 6 minutes works best. Experiment to find the best fit for your trading style, and the market's dominant frequency at the time. The goal here is primarily to monitor the condition of the 8 and 13 day cycles. I typically use 90 minute bars with 26/18 stochastics for the 13 day cycle proxy on the indices during regular trading hours. Other cycles use 26/18 stochastics with the following: 8 days- 60 minute bars On the 24 hour futures charts, use a time per bar approximately 3 to 4 times the above number of minutes, to represent the cycles listed above. About centered moving average projections. ABBREVIATIONS: cma: centered moving average |


![[Most Recent HUI from www.kitco.com]](http://www.weblinks247.com/indexes/idx24_hui_en_2.gif)
![[Most Recent XAU from www.kitco.com]](http://www.weblinks247.com/indexes/idx24_sp500_en_2.gif)
![[Most Recent Quotes from www.kitco.com]](http://kitconet.com/charts/metals/gold/t24_au_en_usoz_2.gif)