|
10 Minute Bar Charts 6/12/02 Dow Jokes Inflatables
Archives 12/30/01, 1/1/02, 1/2/02, 1/3/02, 1/4/02, 1/7/02, 1/8/02, 1/09/02, 1/10/02, 1/11/02, 1/14/02, 1/15/02, 1/16/02, 1/17/02, 1/18/02, 1/22/02, 1/23/02, 1/24/02, 1/25/02, 1/28/02, 1/29/02, 1/30/02, 1/31/02, 2/1/02, 2/4/02, 2/5/02, 2/06/02, 2/7/02, 2/9/02, 2/11/02, 2/12/02, 2/13/02, 2/14/02, 2/16/02, 2/19/02, 2/20/02, 2/21/02, 2/23/02, 2/25/02, 2/26/02, 2/27/02, 2/28/02, 3/1/02, 3/04/02, 3/05/02, 3/06/02, 3/7/02, 3/10/02,3/11/02, 3/12/02, 3/13/02, 3/14/02, 3/15/02, 3/18/02, 3/19/02, 3/20/02, 3/21/02, 3/22/02, 3/25/02, 3/26/02, 3/28/02, 3/30/02 4/1/02, 4/2/02, 4/3/02, 4/4/02, 4/6/02, 4/8/02, 4/9/02, 4/10/02, 4/11/02, 4/13/02, 4/15/02, 4/16/02, 4/17/02, 4/18/02, 4/20/02, 4/22/02, 4/23/02,4/24/02,4/25/02, 4/26/02, 4/27/02, 4/29/02, 4/30/02 5/01/02, 5/2/02, 5/4/02, 5/6/02, 5/07/02, 5/8/02, 5/09/02, 5/10/02, 5/13/02, 5/14/02, 5/15/02, 5/16/02, 5/17/02, 5/20/02, 5/21/02, 5/22/02, 5/23/02, 5/24/02, 5/28/02, 5/29/02, 5/30/02 6/01/02, 6/3/02, 6/4/02, 6/5/02, 6/6/02, 6/7/02, 6/10/02, 6/11/02
|
The Anals of Stock ProctologyPublished 5 times
per week by the American Academy of Stock Proctology and PM Update 6/13/02 12:15 PM Terms and methodology The market is cycling every 3 hours or so. A top is due now around current levels or slightly higher. A 3 day cycle high is also due today at slightly higher levels. The 5 and 8 day cycles appear to be in sideways up phases with 2-3 days until the highs.
AM Update 6/13/02 10 AM Livecharts was down this morning. Sorry for the delay. The 1 day cycle is down. Look for the lows at 10:30 and noon. The 3 day cycle is topping out. It's not clear whether the 5 day cycle turned up yesterday. Looks like not. The low was due today. However, yesterday's lows appear to have met or nearly met the 5 day cycle cmaps. A lot depends on how soft the next two hours are.
The Invisible Hand (6/12/02) Doc worried yesterday that "at some point in this collapse we are going to see a truly
gargantuan Feed. No sooner said than
done. Al gifted the Gang with an enormous $9 billion in overnight repos,
and another $2.5 billion in a bill pass - permanent money. $11.5 billion
with nothing to roll over is extreme, a sure sign of mild hysteria at the
Fed, triggered by the Nads 100 breaking the September low. So, as it
turned out, yesterday's worries were with good reason. Having gotten the
Total Feed (the Fed's open market account holdings of loans and
securities) down to the low band of the 10% annual growth range they've maintained
for over a year, they had room to move, and move they did! How many times have we seen this? The market starts to fall apart going through a major support level, and suddenly Al hands The Gang of 22 (primary dealers) oodles and oodles of money. This is the Greenspan put in action. When the market is in dire danger of collapse, Al springs to the rescue. Thinking back over past such instances in the last year, the pattern is clear. A big repo and bill or coupon pass in the morning, the market's decline is arrested around mid day, it begins to rally strongly after 3 o'clock, and gaps open the next morning. The Gang uses the money to stop the hemorrhaging and turn the market. They buy a few key issues (Try MSFT and MMM for starters), a little squeeze here, a little goose there, here a goose, there a squeeze, everywhere a goose-squeeze, and pretty soon, the shorts react. Because, as we all know, (all together class) shorts are their own worst enema. If the market runs true to form, Thursday we'll see a gap up open, and guess who'll be selling to meet all the short covering and bottom picking. (Thou shalt not pick thy bottom in the company of portfolio sphincters.) If you guessed the stock trading departments of the Gang of 22, you guessed right. Just to remind you, the Gang of 22 also happen to include the very same specialist firms who "maintain an orderly market" at the NYSE, and who make all the markets in the Nads 100 and every other Nasgap stock. Doc has been noting lately that steady increases in Feed such as we saw last summer, did nothing to change the market's trend. But whenever there was a massive one or two day Feed, within hours a concerted and successful effort to run the shorts, followed. Given that this action coincides with a 4 week cycle low, the effort is likely to be successful yet again. The ironic part is that the it doesn't seem to register with the idiots that every time they do this they exhaust potential demand, and once the short covering orgy is finished, the market plotzes. The Fast Feedometer, which is a
day-to-day measure of excess Feed, the amount above and beyond the
Fed's apparent trend growth target, is now in vertical ascent. Unlike the
event of two weeks ago, which was solely for the purpose of greasing up
the market so that it could accommodate that great big huge Treasury
auction, this inflatulation appears to have no other objective than to jam
the market. History says it will be good for a 30 to 50 point move in the
SPX. The Slow Feedometer is trending
up. This money will only end up being flushed down the market toilet.
There's not enough here to provide longer term support, what with the credit
bubble's other insatiable needs. The thing to do is watch how Uncle Buck
and the Long Bong react to Al's printing presses running overtime
again. The other, perhaps more important part of the credit bubble liquidity game is the mortgage market, since it's new mortgage creation that keeps M3 and MZM rolling merrily along. As always on Wednesday, the Mortgage Bonkers issued their weekly release. This is a nice leading indicator because it takes from 4 to 8 weeks to fund these things, giving us advance warning if there will be any significant changes in the amount of money and credit sloshing around a few weeks down the road..
Once again, in spite of super low
mortgage rates, the market is not responding. The credit creation
necessary to keep the bubble economy from imploding is stagnating. The all important refi index is
dead in the water. The refi bulge was the critical cog in
the stock market rally in the fourth quarter, as well as the economic
non-recovery. The economy, of course, is irrelevant. The markets care only
about one thing, liquidity. When there's lots of it around, stocks go up,
and when there isn't enough, stocks go down. In this era, all the Fed's
horses and all the GSE's men, aren't enough to put this Humpty Dumpty
market together again. Still, in the short run, the downside projection for the 4 week cycle has been met and the time was right for that cycle to bottom. With the infinitely wise and kindly hand of the Feed guiding the markets, and shorts panicking and puking all over themselves to get out of the way, the market will initially move higher, then churn around for a few days, before the downtrend reasserts itself.
Portfolio Sphincters Index (SPX) and Sentiment The Sphincters Index rose 6.66. How apropos, the "invisible hand" of the devil at work. The 17 day rate of change, which represents the 6-7 week cycle, and the 6-7 week oscillator superimposed on the price chart, stayed negative. The 10-13 week cycle oscillator (navy) dropped. This is a lagging, confirming indicator, but it's early in the down phase. If the cycle runs its full term, which is at least another 6 weeks, the losses are going to be mind bending. The centered moving average projections are only pointing to the 985 area. If that's right, the cycles will end early. We need to be vigilant for any signs of change in the momentum of this cycle. The 29 day rate of change is still flat in a negative pattern indicating trending. This will probably go on until there's acceleration and a selling crescendo. The VIX fell to 27.01. On the inverted scale chart, VIX is tracking along the inner Stool Band. This is consistent with a possible 4 week cycle low. The market is gradually moving from mild concern to deep concern, in its ultimate journey to fear, and finally, outright panic. But it will not be a straight line. There will be countertrend reactions along the way, and this should be one of those times. The big low probably won't be until the VIX is well above 35, breaking the lower Stool Band in its final panic stage. The blue channel lines are the extension of a linear
regression channel from the February and May 2001 highs. The 6 month cycle
oscillator is inching lower. The trading
stoolicator is early in its down cycle. The short cycle oscillator is
inching higher. This is consistent with an upturn in the 4 week cycle. The 10-13
week cycle oscillator is heading down. If the 4 week cycle up phase
lasts long enough, the chances increase that the September lows will hold as
the 10-13 week cycle and other major intermediate cycles bottom in late
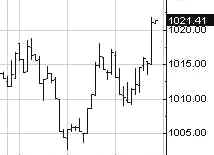
summer. A short up phase now means the lows are likely to be broken. The SPX dropped back to the 161.8%
fibo retracement level on the downswing. Assuming that was a short cycle
low, the first upward retracement level is 1027, then 1042. The Cycle Conditions tables include cycle phase and a wild guess as to number of periods to the next turn, in days for the shortest cycles, weeks (W) or months (M) for the longer ones. This is a fluid exercise, in other words, the projections are likely to be wrong, but they force us to be vigilant for key turning points, and frequently work well enough to prevent costly misreadings. SPX Cycle Conditions as of 6/12/02
PTT - Periods Till Turn Nasgap Charts The Nasty gained 22, a 45 point comeback from the low. The 6 month cycle time series spread downticked. Flat below zero is negative, representing a trending market. Today, it got a bit more negative, in spite of the rally. The 10-13 week cycle oscillator and the trading stoolicator continued on their downward path. The short
cycle oscillator resumed it's up move, consistent with a 4 week cycle up
phase getting started. With the larger trend as weak as it is, the up
phase will either be short and sharp, or will meander sideways for a few
days. The
Nascrap 100 broke the September low on the open. Within minutes the Feed
announced a $9 billion dollar repo. But of course it was a coincidence,
just like the other 14 times we've seen this in the last year and a
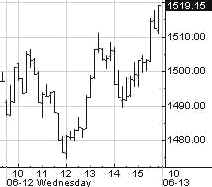
half. The first
fib retracement level is at 1545. If the usual behavior of panicked shorts
is any guide, the Nas will get there on the open. Nasdaq Cycle Conditions as of 6/12/02
PTT
- Periods Till Turn These features are in the AM Edition. (Previous) The 10 year yield is headed
for 4.75-80. Stock prices have been moving in lockstep with declining
yields. The SOX are
at the lower cycle band projection. That should act as temporary support.
A move below 410 would signal downward acceleration of the cycle channel. The software
stocks tested the September low, but this is a top in a sideways 10-13
week cycle up phase. The Street's
Group du Jour of late has been the Hmo's. By definition, given Wall
Street's universal love for the group, a top most be in progress. The bonks
are flopping at trend support. Everything points down except the 4 week
cycle. Look for a brief swup, then a breakdown. The key jam
stocks yestiddy were MMM, PG, WMT, and MSFT. Here's Wally. He's 5 weeks
into a 10-13 week cycle sideways up phase. Should roll over in the next couple
of weeks and head for new lows in July. Same story
in Mafiasoft. It's in the final stages of a 10-13 week cycle up phase. The
mm's are doing the best to shake out the public shorts. Look for a blowoff
reversal day. Here's a
follow up for Dr. Bull (His name speaks for itself.) ARDI is
consolidating, but for what? Not decided yet. If the stock can get above
7.50 with the ozzies turning up, it'll go to 9. If it breaks below 6.50
with the ozzies moving down, it'll go to 5. There, that was easy. Like
Chinese menu. Doc is a
little worried about the gold stocks. The portents are negative in the
short run. If NEM breaks 28, it'll go to 25-26. Should be a buy there. Henceforth and forevermore, if you would like to request a "stocko", please post your request in Dear Dr. Stool. If you have not already registered for the message board, please do so. The only required info is user name and password which you choose yourself, and your email address, which you can keep private by selecting the keep private option. Doc looks forward to featuring your ideas. We've had some good ones! Uncle Buck's Illness
Buck's team of foreign specialists have kept him alive in Room 111. But
their time is running out. This is a sideways up phase. Golden Stool Cousin Hui's
short cycle ozzie is oversold, but everything else points down. Looks like
a couple more weeks of pain for goldbugs. RAID! See you in Intraday Stool. Dr. Stepan N. Stool Let me know what you think on the Stool Pigeons Wire. Previous complete issue with all features Welcome To New Subscribers Welcome, and thank you for subscribing to the Anals of Stock Proctology. You may note some subtle differences in style now that this is no longer a free service. The perspective is still bearish, but it will have a more balanced approach than my message board ravings. You won't see me screaming "BUY" about anything except perhaps gold, but you will see stronger indications of areas and times when I think it might be a good idea to avoid being short. And I promise that I will lose my temper from time to time to keep you entertained! There's also a new feature, Doc's By Request Stock O' The Day. If you have a stock you're interested in, send an email to [email protected], naming the stock, and why you think Doc should look at it, in 25 words or less. 26 words, and you're disqualified! Those that look interesting, Doc will try to feature here within the next day or two. If you have suggestions about other features you'd like to see, send them along to [email protected]. Again, thanks for subscribing!
Explanation of Intraday Commentary-Build charts at http://www.livecharts.com. For custom time bars insert a comma after symbol and number of minutes, e.g. compx,90. This will give you a bar chart of the Nas with 90 minutes per bar. The one day cycle is usually most clear with 8 minute bars and 26/18 stochastics. It varies from day to day. Sometimes 6 minutes works best. Experiment to find the best fit for your trading style, and the market's dominant frequency at the time. The goal here is primarily to monitor the condition of the 8 and 13 day cycles. I typically use 90 minute bars with 26/18 stochastics for the 13 day cycle proxy on the indices during regular trading hours. Other cycles use 26/18 stochastics with the following: 8 days- 60 minute bars On the 24 hour futures charts, use a time per bar approximately 3 to 4 times the above number of minutes, to represent the cycles listed above. ABBREVIATIONS: cma: centered moving average |
|||||||||||||||||||||||||||||||||||||||||||||||||||||||||||||||||||||||||||||||||||||||||||||||||||||||||||||||
![[Most Recent XAU from www.kitco.com]](http://www.weblinks247.com/indexes/idx24_nasdaq_en_2.gif)
![[Most Recent XAU from www.kitco.com]](http://www.weblinks247.com/indexes/idx24_sp500_en_2.gif)
![[Most Recent Quotes from www.kitco.com]](http://kitconet.com/charts/metals/gold/t24_au_en_usoz_2.gif)
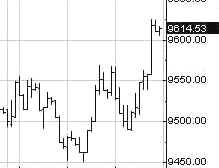
 The
Dow Jokes stage managers (the three NYSE Specialist firms who control the
Dow) spent the morning buying unwanted tickets from the patrons, with a
little help from the Feed money. Then they went into their act, and when
the people outside the theater decided they wanted back in, what did the
stage managers do? Why they raised the ticket prices, of course. The Dow
gained a neat 100, which was 164 points off the AM lows.
The
Dow Jokes stage managers (the three NYSE Specialist firms who control the
Dow) spent the morning buying unwanted tickets from the patrons, with a
little help from the Feed money. Then they went into their act, and when
the people outside the theater decided they wanted back in, what did the
stage managers do? Why they raised the ticket prices, of course. The Dow
gained a neat 100, which was 164 points off the AM lows.