|
Archives 12/30/01, 1/1/02, 1/2/02, 1/3/02, 1/4/02, 1/7/02, 1/8/02, 1/09/02, 1/10/02, 1/11/02, 1/14/02, 1/15/02, 1/16/02, 1/17/02, 1/18/02, 1/22/02, 1/23/02, 1/24/02, 1/25/02, 1/28/02, 1/29/02, 1/30/02, 1/31/02, 2/1/02, 2/4/02, 2/5/02, 2/06/02, 2/7/02, 2/9/02, 2/11/02, 2/12/02, 2/13/02, 2/14/02, 2/16/02, 2/19/02, 2/20/02, 2/21/02, 2/23/02, 2/25/02, 2/26/02, 2/27/02, 2/28/02, 3/1/02, 3/04/02, 3/05/02, 3/06/02, 3/7/02, 3/10/02,3/11/02, 3/12/02, 3/13/02, 3/14/02, 3/15/02, 3/18/02, 3/19/02, 3/20/02, 3/21/02, 3/22/02, 3/25/02, 3/26/02, 3/28/02, 3/30/02 4/1/02, 4/2/02, 4/3/02, 4/4/02, 4/6/02, 4/8/02, 4/9/02, 4/10/02, 4/11/02, 4/13/02, 4/15/02, 4/16/02, 4/17/02, 4/18/02, 4/20/02, 4/22/02, 4/23/02,4/24/02,4/25/02, 4/26/02, 4/27/02, 4/29/02, 4/30/02 5/01/02, 5/2/02, 5/4/02, 5/6/02, 5/07/02, 5/8/02, 5/09/02, 5/10/02, 5/13/02, 5/14/02, 5/15/02, 5/16/02, 5/17/02, 5/20/02, 5/21/02, 5/22/02, 5/23/02, 5/24/02, 5/28/02, 5/29/02, 5/30/02 6/01/02, 6/3/02, 6/4/02, 6/5/02, 6/6/02, 6/7/02, 6/10/02, 6/11/02, 6/12/02, 6/13/02, 6/14/02, 6/17/02, 6/18/02, 6/19/02, 6/20/02, 6/22/02, 6/24/02, 6/25/02, 6/26/02, 6/27/02, 6/30/02 7/1/02, 7/4/02, 7/5/02, 7/11/02, 7/14/02, 7/15/02, 7/16/02, 7/17/02, 7/18/02, 7/19/02, 7/22/02, 7/23/02, 7/24/02, 7/25/02, 7/27/02, 7/29/02, 7/30/02 8/1/02, 8/3/02, 8/5/02, 8/6/02, 8/7/02, 8/8/02, 8/10/02, 8/12/02, 8/13/02, 8/14/02, 8/15/02, 8/16/02, 8/19/02, 8/20/02, 8/21/02, 8/22/02, 8/23/02, 8/26/02, 8/27/02, 8/28/02
|
The Anals of Stock ProctologyPublished weeknights by
8:30PM Happy Acres, Florida Time The American Academy of Stock Proctology and Is your subscription up for renewal? If you want to renew, do nothing, unless your credit card has expired. Please be sure your credit card info is current. If your credit card has expired, you must enter the new expiration date in your Paypal account in order for your subscription to be processed. If you subscribed via Paypal, your subscription will be renewed for one year on the 90 day anniversary of your sign-up and your credit card will be charged. If you want to cancel, use the button at the bottom of the page. This applies only if you subscribed through Paypal. Mailed-in subscriptions are for 1 year. If you subscribed by prior contribution, I will send you a notice before your subscription expires. If you have any questions, see the subscription page and FAQ's. If you can't find the answer, email me. Update 8/30/02 12:30PM Terms and methodology The 1 day 5 hour and 2 day cycles look like they are in the process of making a concurrent peak on the SPX, but the action is sloppy and the 8 day cycle is still in a weak swup. The Nas has been in a down phase or possibly a swup, for most of the morning. The salient feature of the remainder of today should be continued sloppy action. The action is so sloppy and so narrow that Doc can't derive any cmaps, except for a possible high on the SPX. Doc sees no point in trading today. Have a great holiday weak end! An abbreviated holiday weak end addition will be published tonight. Doc does not make trading recommendations. This update reports intraday time cycle estimates and centered moving average projections based on the Hurst cycle analysis method. Doc assumes no responsibility for the accuracy or inaccuracy of these estimates and projections. The market may or may not meet these projections. New stoolies should thoroughly familiarize themselves with the methodology before trading based on this method. There is no free lunch. Those who do not have the time or inclination to develop a trading strategy based on testing and research should not trade. Trade at your own risk.
Update 8/30/02 9:15AM Terms and methodology Looks like the "whole lotta nuthin'" theme is carrying through, although the futures sold off on the Nas after the bell yesterday and have not bounced back. Doc thinks the 1 day cycle is in a down phase, but the stock proctoscope is mighty cloudy this morning. The 1 day cycle should bottom soon after the open. Then there's a 3 hour wavelet low due at 10:15-10:30. But the 5 day cycle looks juxtaposed again. The 5 hour cycle high is due around 11:30. The crowd can't seem to get its act together. Looks like a mixed, sloppy market with an initial downward bias at this point. After that, we'll see. The 8 day cycle looks like it's in a swup, a weak one. there are no upside cmaps, and no downside projections below Wednesday's. Doc does not make trading recommendations. This update reports intraday time cycle estimates and centered moving average projections based on the Hurst cycle analysis method. Doc assumes no responsibility for the accuracy or inaccuracy of these estimates and projections. The market may or may not meet these projections. New stoolies should thoroughly familiarize themselves with the methodology before trading based on this method. There is no free lunch. Those who do not have the time or inclination to develop a trading strategy based on testing and research should not trade. Trade at your own risk.
Whole Lotta Nuthin (8/29/02) Cyclical juxtaposition and the holiday weekend means we got a whole lotta nuthin' going on. The next big move is going to be down, but the market could stayed trapped in a range for weeks on end before it starts. Eventually, the market will fall as the 10-13 week and six month cycles get in gear to the downside. The problem is that it's still early in the six month cycle up phase. Until the six month people start pulling their bids and flipping to the sell side, there probably isn't enough negativity among the shorter term cycle people to knock the market down for long. The 10-13 week cycle hasn't even rolled over to the downside. Until it does, and the long-termers get in gear, there won't be a collapse. By the same token, the 10-13 week crowd is clearly tapped out, so there's not enough good cheer to drive the market much higher even if the 6 month cycle boys are still putting on a happy face. What needs to happen is the 6 month guys need to quit on the market early, say in the next week or two. Then we could see a pretty good downdraft. But if they don't, we may have to sit through a sideways down phase that lasts six weeks, then another mild pop, before a really big dump beginning around Doc's birthday in November. In the meantime you can trade the channels. We'll call it channelingstool.com. The Feed added a net $4.75 billion. They rolled over $3 billion in 28 day repos and $2.75 billion of $4 billion in expiring overnight repos. They also added $6 billion in 7 day repos. Large repos are typical for a holiday weekend, and probably are not related to the market's weakness the past few days. Also, the Treasury sold $6.7 billion in new 2 year notes as part of its $27 billion auction on Wednesday. This acts as a temporary drain. Today's Feed was not even enough to offset that. Doc continues to believe that Al is backing away from active jamming of the stock market, and may only step in, in the event of a destabilizing meltdown. Friday, the $2.75 billion in overnight repos will expire. They will probably feed again for the holiday weekend. And the market will probably respond by starting the party early if they do. Nothing like a little holiday cheer. Al continues to rotate around the 10% growth lower limit for the total Feed, and is nearing the top of his "caution" box. He will almost certainly take it to the top, but Doc would be surprised if he took it above that. That might mean something really horrible is lurking. There was an enormous jump in borrowings from the Fed's discount window in the last statement week. What's that all about? Is a bonk in trouble, losing access to the Fed Funds market? So we'll get another plus Feed.
For bears, all Feeds have a positive side. That is, we know where they're
likely to stop and and reverse, and those peaks often represent great
opportunities to get short. The Feedometer
rose. Reiterating the point from last night, if all the excess Feed in
June and July could only result in a delayed 1/3 retracement of the
selloff, then Al and the Gang are indeed pushing on a string. You can lead
a Gang to Feed, but you can't make them eat it. Joe Sixpack, your
portfolio sphincters and hedgies, and all the foreigners who played such a
big part in recycling trade deficits back into US investments, have lost
their appetites. Some because they don't like the taste anymore, and others
because they've already pigged out and are stuffed to the gills. So,
lately, a big Feed can only start a little jam. And from every little jam a
little dump must come. Wednesday's mortgage app data showed a downtick, with warning signs of a possible top on the charts. Massive reliquefaction is still in the pipeline for the next 4-6 weeks, even if this is the applications peak. But we know its possible that the market can do a job of flushing that liquidity almost as fast as it's created. Invariably we see a sharp slowing in the growth of the M's when stock prices drop sharply over a period of months. Flush, flush. For now,
those mortgage apps are being funded 4 to 8 weeks later and showing up as
renewed hyper growth in M2, M3 and MZM, which is growing at a near 12%
pace annualized through August 19. The trickle
down into high powered M1 is being diverted somewhere, although there was
an uptick last week. The greatest part of the mortgage application bulge
is now beginning to fund. Look for huge increases in broader money to flow
down to M1, and possibly give a boost to the market. Doc wants to emphasize the word "possibly." Creating liquidity is one thing. What investors will do with it is another. The psychology has changed. The market is no longer viewed as a good place to put money by an ever growing crowd. Well, what's the
problem here? Has a bank somewhere been shut out of the Fed Funds market?
If anyone has a clue why the quantum leap in borrowing from the Fed, let's
hear it on L.O.B.
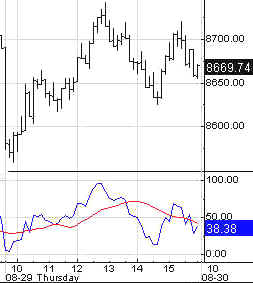
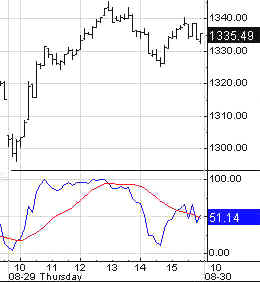
Portfolio Sphincters Index (SPX) and Sentiment
The VIX was nearly steady at 36.32. On the inverted scale chart it's near the center of the Stool Bands. We're still waiting for a touch of the top band to confirm a top. Whether that happens by another rally driving the VIX toward the band, or a selloff that pulls the upper projection of the band down, remains to be seen. As always, Doc relies only on price based indicators. The sentiment indicators are interesting, but they don't tell us anything new. The
superimposed 6-7 week cycle (red line) oscillator fell again. The 10-13 week oscillator is
slowing. The 17 day rate
of change, which is a proxy for the 6-7 week cycle, is building a top
pattern. The 29 day rate of change
(10-13 week cycle) teased us, but maintained its uptrend. Until the 29 day ROC and the 10-13 week cycle oscillator
turn lower, the downside will be limited. The 6 and 10-12 month oscillators are rising. As long as that continues, even a downturn in the 10-13 week cycle may not result in a big selloff. The best declines come when all of the cycles are in gear. It's going to take time before we see the kind of confluence we saw earlier in the summer. You remember that one, when Doc was so bearish, he was foaming at the mouth. The stoolicator indicates an overbought uptrend edging closer to a final peak. The short cycle oscillator is coming down hard. In itself, that's not significant, other than to confirm that shorter cycles are headed down. This still must be considered a counter cyclical move relative to the 6 month cycle, although it may be the beginning of the 10-13 week cycle top. The 6-7 week and 4 week
cycles are in down phases.
The 8 and 13 day cycles probably are making a bottom, with the downside
cmap of 910 having been met. The chart below is a zoom-in on the double linear regression chart going back to the September 2000 top, which you have seen here in recent days. Both the red and blue channels are projections of linear regression channels beginning at the September 2000 high. One ends at the March 2002 top and is projected from there. The second channel is projected from the recent high. The fact that both tracks are almost identical tells us that the market has not deviated from the course it was set on a long time ago. What's especially interesting at this point is that 5 weeks after the low, the market is in almost exactly the same position it was in 5 weeks after the September 2001 low, relative to both the long term and short term linear regressions channels. Can we draw any conclusions from that? Uh..., no. Fiber Nacho Upchuck
(Resistance)- If this is an up phase, these are your short term fibo
targets. And if it's a down, here are
your fibo support levels. The Cycle Conditions tables include cycle phase and a wild guess as to number of periods to the next turn, in days for the shortest cycles, weeks (W) or months (M) for the longer ones. This is a fluid exercise, in other words, the projections are likely to be wrong, but they force us to be vigilant for key turning points, and frequently work well enough to prevent costly misreadings. SPX Cycle Conditions as of 8/29/02
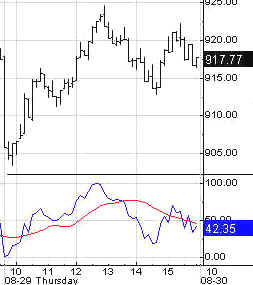
PTT - Periods Till Turn Nasgap Charts Rate of change indicators for both the 6-7 and 10-13 week cycles are close to sell signals, but the uptrends are still intact. It doesn't pay to jump to conclusions. The stoolicator is also still uptrending. The 6 month cycle oscillator upticked after a little pause that looked like it might be the beginning of a top. It's not nice to anticipate signals. Instead of getting a jump on the market, the market will likely jump on you. Splat! Once the lines cross on those oscillators, it will be time to short with reckless abandon. Be patient Upside cmaps for the 10-13 week cycle look like they've been hit, but they can be retested. We still need to see a confirming crossover on one of the indicators, in particular the 10-13 week cycle ozzie. We have the downtick from toppy territory. That's a start. While the 4 week and 6-7 week cycles appear to be in a mild down phase, the13 day cycle probably bottomed yesterday. So what we have here is... a mess. Sphincters
and hedgies and borkers, oh my! Running amok, but getting nowhere. And
until those cycles get in gear, that's the way it will be.
Fiber Nacho Upchuck Levels- Resistance
Fiber Nacho Dump Levels- Support Nasdaq Cycle Conditions as of 8/29/02
PTT
- Periods Till Turn AM Edition Features (Previous) These features are in morning edition, published around 9 AM ET US, or the Saturday Weak End Edition, published, uh, let's see, Saturday! Golden Stool HUI has hit
the 13 day cmap of 127 but the 6-7 week and 10-13 week cmaps have moved up
to 130 with an outside of 135, with an "outside outside" of 140
on the 4 week cycle cmap.
Couldn't break the downtrend. May head for retest in uncertain
picture. Uncle Buck's Illness
Buck took a turn for the worse yesterday with a sell signal on the
intermediate oscillator. Watch out for the bottom dropping. Bonks- No intermediate sell
signals yet. Biodrech- Still in top
building. Consumer- Inching closer to
10-13 week cycle sell signals, but the 6 month cycle is a long way from
downturn. Short cycle is within days of a bounce. Drugs- Similar picture. Retail is another with this
kind of picture. Same for the HMO's. Bubble Stocks- Is it the
big top building? Small Crap- Downtrend test
ahead. No intermediate sell signals yet. Energy- No sell signals
yet. Tenth Commandment of Stock Proctology: Thou shalt not anticipate. Trannies- OK OK, some rules
are made to be broken. Depends on the trend. SOX- Testing testing. Test,
two, two. Be careful here. Soft Where- Mixed signals
beget mixed action. Nutworkers- will it be a
bottom dropping? Sticking around for now. Internuts- This one too -
channelingstool.com. Stoolwethers - No Stoolwethers Today See you in Intraday Stool. Dr. Stepan N. Stool Share your thoughts on the Stool Pigeons Wire.
Renewals Welcome, and thank you for subscribing to the Anals of Stock Proctology. Your trial subscription will run for 90 days. At the end of that period your subscription will renew automatically, unless you cancel. If you wish to cancel your subscription use the button below. If you want to renew your subscription do nothing. Your subscription will renew and your credit card or Paypal bank account will be charged. If you want to renew, be sure your credit card information in your Paypal account is current. Paypal will not renew your subscription if the card has expired! Again, thanks for subscribing!
Explanation of Intraday Commentary-Build charts at http://www.livecharts.com. For custom time bars insert a comma after symbol and number of minutes, e.g. compx,90. This will give you a bar chart of the Nas with 90 minutes per bar. The one day cycle is usually most clear with 8 minute bars and 26/18 stochastics. It varies from day to day. Sometimes 6 minutes works best. Experiment to find the best fit for your trading style, and the market's dominant frequency at the time. The goal here is primarily to monitor the condition of the 8 and 13 day cycles. I typically use 90 minute bars with 26/18 stochastics for the 13 day cycle proxy on the indices during regular trading hours. Other cycles use 26/18 stochastics with the following: 8 days- 60 minute bars On the 24 hour futures charts, use a time per bar approximately 3 to 4 times the above number of minutes, to represent the cycles listed above. ABBREVIATIONS: cma: centered moving average
|
||||||||||||||||||||||||||||||||||||||||||||||||||||||||||||||||||||||||||||||||||||||||||||||||||||||||||||||||||||||

![[Most Recent HUI from www.kitco.com]](http://www.weblinks247.com/indexes/idx24_hui_en_2.gif)
![[Most Recent XAU from www.kitco.com]](http://www.weblinks247.com/indexes/idx24_sp500_en_2.gif)
![[Most Recent Quotes from www.kitco.com]](http://kitconet.com/charts/metals/gold/t24_au_en_usoz_2.gif)