|
Archives 12/30/01, 1/1/02, 1/2/02, 1/3/02, 1/4/02, 1/7/02, 1/8/02, 1/09/02, 1/10/02, 1/11/02, 1/14/02, 1/15/02, 1/16/02, 1/17/02, 1/18/02, 1/22/02, 1/23/02, 1/24/02, 1/25/02, 1/28/02, 1/29/02, 1/30/02, 1/31/02, 2/1/02, 2/4/02, 2/5/02, 2/06/02, 2/7/02, 2/9/02, 2/11/02, 2/12/02, 2/13/02, 2/14/02, 2/16/02, 2/19/02, 2/20/02, 2/21/02, 2/23/02, 2/25/02, 2/26/02, 2/27/02, 2/28/02, 3/1/02, 3/04/02, 3/05/02, 3/06/02, 3/7/02, 3/10/02,3/11/02, 3/12/02, 3/13/02, 3/14/02, 3/15/02, 3/18/02, 3/19/02, 3/20/02, 3/21/02, 3/22/02, 3/25/02, 3/26/02, 3/28/02, 3/30/02 4/1/02, 4/2/02, 4/3/02, 4/4/02, 4/6/02, 4/8/02, 4/9/02, 4/10/02, 4/11/02, 4/13/02, 4/15/02, 4/16/02, 4/17/02, 4/18/02, 4/20/02, 4/22/02, 4/23/02,4/24/02,4/25/02, 4/26/02, 4/27/02, 4/29/02, 4/30/02 5/01/02, 5/2/02, 5/4/02, 5/6/02, 5/07/02, 5/8/02, 5/09/02, 5/10/02, 5/13/02, 5/14/02, 5/15/02, 5/16/02, 5/17/02, 5/20/02, 5/21/02, 5/22/02, 5/23/02, 5/24/02, 5/28/02, 5/29/02, 5/30/02 6/01/02, 6/3/02, 6/4/02, 6/5/02, 6/6/02, 6/7/02, 6/10/02, 6/11/02, 6/12/02, 6/13/02, 6/14/02, 6/17/02, 6/18/02, 6/19/02, 6/20/02, 6/22/02, 6/24/02, 6/25/02, 6/26/02, 6/27/02, 6/30/02 7/1/02, 7/4/02, 7/5/02, 7/11/02, 7/14/02, 7/15/02, 7/16/02, 7/17/02, 7/18/02, 7/19/02, 7/22/02, 7/23/02, 7/24/02, 7/25/02, 7/27/02, 7/29/02, 7/30/02 8/1/02, 8/3/02, 8/5/02, 8/6/02, 8/7/02, 8/8/02, 8/10/02, 8/12/02, 8/13/02, 8/14/02, 8/15/02, 8/16/02, 8/19/02, 8/20/02, 8/21/02, 8/22/02, 8/23/02, 8/26/02, 8/27/02, 8/28/02, 8/29/02, 8/30/02 9/3/02, 9/4/02, 9/5/02. 9/6/02, 9/9/02, 9/10/02, 9/11/02, 9/12/02, 9/13/02, 9/16/02, 9/17/02, 9/18/02, 9/19/02, 9/20/02, 9/23/02, 9/24/02, 9/25/02, 9/26/02, 9/27/02
|
The Anals of Stock ProctologyPublished weeknights by
8:30PM Happy Acres, Florida Time The American Academy of Stock Proctology and Is your subscription up for renewal? If you want to renew, do nothing, unless your credit card has expired. Please be sure your credit card info is current. If your credit card has expired, you must enter the new expiration date in your Paypal account in order for your subscription to be processed. If you subscribed via Paypal, your subscription will be renewed for one year on the 90 day anniversary of your sign-up and your credit card will be charged. If you want to cancel, use the button at the bottom of the page. This applies only if you subscribed through Paypal. Mailed-in subscriptions are for 1 year. If you subscribed by prior contribution, I will send you a notice before your subscription expires. If you have any questions, see the subscription page and FAQ's. If you can't find the answer, email me. Update 10/1/02 12 Noon Terms and methodology It does appear that the 5 day cycle low is in, but the 8 day should still be down. The shortest cycles are fibrillating. Two and 3 day waves may hold the key here. They have already hit their upside cmaps. Watch them on 15 and 24 minute bar charts with 26/18 stochastics. When they turn lower, the market should break. The Feed was a drain. That should put pressure on late in the day. Bond market is a shambles today. The selling appears to be helping the short end, more than the stock market.
Update 10/1/02 9:15 AM Terms and methodology The jam is on. Manipulation, plain and simple. It can't be sustained, and it won't be. But it will definitely screw things up this morning. Doc expects the highs to be made on the open at 823 SP, 1185-90 on the Nasty, and 845 on the 100 Nads. The pullback from the high should last until around 10-10:30. Then they'll try again. From a cycle standpoint, Doc can't project where the low will be, but is guessing they'll get back at least to unchanged. The 5 day cycle low cmaps still point a bit lower. If the AM pullback is mild, the 5 day lows may be in. 8 day low is due Thursday. Doc will have to wait to see how the first hour plays out to get a better handle on cmaps and cycle timings.
Doc does not make trading recommendations. This update reports intraday time cycle estimates and centered moving average projections based on the Hurst cycle analysis method. Doc assumes no responsibility for the accuracy or inaccuracy of these estimates and projections. The market may or may not meet these projections. New stoolies should thoroughly familiarize themselves with the methodology before trading based on this method. There is no free lunch. Those who do not have the time or inclination to develop a trading strategy based on testing and research should not trade. Trade at your own risk. Termites! (9/30/02) The market's stage managers threw everything they had at it. And still the foundations shook. Not even a big Feed, not end of quarter manipulations, not even the usual enema of the shorts, which is themselves panicking, was enough to stop the heaving and shaking. So tomorrow, expect more of the same, and the day after, and the day after, and so on. When will it end? How will it end? We're supposed to be in that time window in which this cycle of the great secular bear market can end at any time. The window can stay open for a long time. The actual price low of a four year cycle can be many months before or after the anniversary of the last 4 year low, particularly with the secular trend channel sloping down. This is something new. Something we have never experienced. Every single 4 year cycle low since the 1940s has been in the context of a secular uptrend. When prices came down before, it was as if they hit an upward inclined pane and bounced off it. Not this time. This time, the inclined plane is headed down. When sharply descending prices hit do they bounce up? No they shoot out at the angel of attack. leading to short up phases that lose their upward momentum quickly. The last time this condition existed was in the 1930s. The most analogous situation is the unwinding of the 1920's bubble. The "four year cycle" encompassing the last phase of the bubble and its ultimate collapse lasted 6.5 years. There have also been times in history when the "Four Year Cycle " lasted only three years. So for those of us looking for a four year cycle low, and that includes Doc, we may have a long wait. Or hey! What if last September was it? Maybe the bulls were right. Maybe that was the bottom! Maybe December to March was the top. And maybe this isn't even the old bear market anymore. Maybe it's a brand new cyclical bear cub. Doc will leave you with that thought. The Feed added $5.75 billion in overnight repos with no rollovers. There are no rollovers oterh than the $5.75 billion, Tuesday. The big Feed sent the Feed Index rocketing back toward the 10% long term growth channel and to the top of the no growth channel. Once again Al is panicking in reaction to the market meltdown on Friday and this morning, as well as the Chicago Purchasing Managers Index. This is so predictable. What isn't predictable is where that Feed will go, back into bonds, or into stocks. Three trends are evident on
the Feed Index. One is the 10% growth trend beginning in May of 2001. Feed
growth has recently been at or below the lower boundary of that trend. The
blue channel going back to last December suggests that Al may now be
targeting an 8% growth rate. Then there's the golden box which says he's stopped growing Feed altogether over the last three months. The Feeding brought the fast Feedometer back to the center of its recent downtrend. Other than the mid-day rally, it didn't help enough to turn the market. Unless they come with something much much bigger, it's not going to make a difference. It didn't help the long end of the bond market either, but rates dropped sharply in the short end. The Gang of 22 is playing it real safe. The
Feedometer theoretically
measures excess Feed available for bond or stock market jamming. Bond yields gapped down, and hung
around the lows all day, hitting 3.57 and closing at 3.61. Intermediate
cmaps look like 3.40-3.50. 3.50 is also a long term support level. If they
break that, this is Japan redux. 90 day bill yields dropped through the
day, falling from 1.59 at the open to 1.53 at the close. That's a
breakdown through the recent lows, also ticking through the low of 1.54,
last January. Your Feed dollars at work. Financial and Economic Indicators (September 26)
All of Doc's
cycle charts
are powered by METASTOCK Portfolio Sphincters Index (SPX) and Sentiment Long Term The six month cycle oscillator continues to rise. This cycle either remains in a sideways up phase as it moves across the 18-month 2 year cycle channel, or it is just topping out. We should know in a few days, if not Tuesday. The weakness of the up phase and the amount of time left in the cycle suggest devastating losses through January. Obviously, given the 4 year cycle low in October 1998, over the next few months we need to be on the lookout for conditions indicating a four year cycle low, which would be followed by a ferocious rally finally convincing everyone the bear market is over. They'll be wrong. Sentiment and Momentum
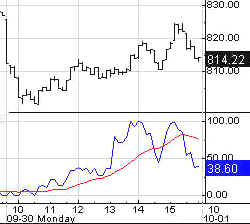
Indicators Short Term Cycles The Index touched the lower regression channel in the AM, leading to a snapback rally. It closed in the lower quarter of the channel. That kind of action only weakens the market. The channel's bottom line is just below 800. The 8 and 13 day cycles appear to have 4 to 9 days to go on the downside. Watch the hourly indicators to monitor this cycle. The up phase of the 6-7 week cycle remains a dead issue. It's been swept down by the cascading 10-13 week cycle wave. A four week cycle low is due within 5 days around 780, but the 6-7 week cycle should be accelerating down at that point. They will fight like hell to hold 800. Once it fails, we could see a waterfall decline. 10-13 Week Cycle The 10-13 week cycle should continue to govern. The cycle indicators continue lower with the 29 day rate of change nose-diving farther into negative territory, and the superimposed cycle indicator reaching the level normally seen at intermediate lows. Since the time isn't right yet, the implication could be that the market is about to get much much weaker. The low could be as little as 2 days away, and as much as 18 days, the latter being more likely. The cmap is 680, subject to daily adjustment as the appointed time approaches. VIX The VIX rose to 44.57. It moved to the middle of the inverted scale 6 month cycle Stool Band. A move through the lower blue channel band followed by a reversal would confirm an important low. At this point the indicator is simply trending right along with the market, and is telling us nothing we don't already know. Fear levels are not extreme enough to signal any kind of low. In any event, do not get sidetracked attempting to interpret sentiment indicators. They'll follow price. We already know the market is Dover Sole by conventional measures. Cycle Chart
Fiber Nacho Dump- Support levels and downside targets.
Fiber Nacho Reflux- Resistance levels and upside targets The Cycle Conditions tables include cycle phase and a wild guess as to number of periods to the next turn, in days for the shortest cycles, weeks (W) or months (M) for the longer ones. This is a fluid exercise, in other words, the projections are likely to be wrong, but they force us to be vigilant for key turning points, and frequently work well enough to prevent costly misreadings. SPX Cycle Conditions as of 9/30/02
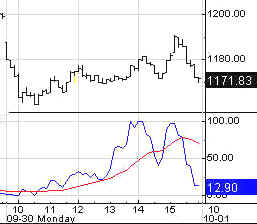
PTT - Periods Till Turn Nasgap Charts Long Term Confirmation of the 6 month cycle sell signal will come when the smoother line (red), which is a time series of the indicator line (navy), begins to flatten. Late signals are usually a sign of a much bigger move to come. They happen when one phase of a cycle is much shorter than typical, under the influence of larger downtrending waves. The down phase of this cycle should last into next year and carry well below 1000. Then we could see a big rally of the 4 year cycle low, which might bring the Nasty all the way back up to the level of the breakdown currently in progress. In the long term, we are looking at a situation like Germany's Neuermarkt, which shut down last week. The handful of large companies which remain will have no choice but to move to the NYSE. The 100 Nads will be reduced to 10. Cycle Chart Short Term Cycles Monday's down-up-down, along with the action of the last few days, is the picture of a slow motion breakdown. This market doesn't even merit the honorable appellation of Bear Market any more. It has now entered the termite stage. Welcome to the great Termite Market of 2002. The 4 week cycle down phase has 3 to 8 days remaining. The cmap is 1075-1125. The 8 and 13 day cycles appear to have 3 to 8 days of downside as well, with a cmap of 1125. The 6-7 week cycle up is a non issue at the moment. 10-13 Week Cycle Two to 17 days remain in the down phase. The cycle indicators are headed down hard. The cmap remains 1025.
Fiber Nacho Dump- Support levels and downside targets.
Fiber Nacho Reflux- Resistance levels and upside targets Nasdaq Cycle Conditions as of 9/30/02
PTT
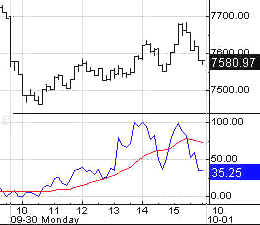
- Periods Till Turn AM Edition Features (Previous) These features are in morning edition, published around 9 AM ET US, or the Saturday Weak End Edition, published, uh, let's see, Saturday! Long Bong Hit - See top of page. Golden Stool The 6-7 week
cycle should be entering a bottom phase. The downside cmap of 122 has been
reached. Just a reminder that this is believed to be part of a long period
of consolidation as some longer cycles enter a sideways down phase that
could last well into 2003. Uncle Buck's Illness
Uncle Buck's 6 month cycle sideways up phase is nearing an end. One more
bounce. Then down at least to test the 104 area, maybe more. Suctor Watch - Looks at 10-13 week cycle cmaps. Bonkers - Looking like 600.
Biodrech- Cmap is 270. Housing Bubble- Heading for
295. Consumer- Looks like 185. Retail- Now that WalMart
has started cutting 'em, looking for 230. Energy- Would you believe
380 Small Craps- Assuming this
"support" breaks, you're looking at 300. Dow Transvestites- 2100 is
key. If it breaks, they'll roll downhill to 1750. Dirty SOX- Next stop 190.
Soft Where- Soft to 65.
Must break current level. Nutworkers- Packing it to
75. Telecommies- Will ring 290. Stoolwethers - Doc takes a look at 10-13 week cycle cmaps. Citicorpse- Did you see the
flick, Night of the Living Dead? This is the remake. Not sure how long it
will be in theaters. See it before it leaves. JPM- Another in that genre. FatAss- Doing the
breakdance. Ugly. Cmap looks like 57. But free falls can get out of hand. General Custer- Will make
stand at 22.50. General McClellan -
Marching toward 35+/-. Wally- Big markdowns in
store. Cutting prices to 45 again. Check out those signals on the 29 day
ROC and 10-13 week cycle ozzie. The amazing Karnak. Market Maker Management-
Bounce at 100, but cmap is 103. Amazin - Finally be ready
to drop on multiple sell signals. AhOL- Holding it in.
Another distribution phase. Mr Bill - Has lots of
friends at current levels. But cmap says 37. Will need to happen quick.
Cycle low is due. Crisco Skid may be taking a
break. Cmap of 10 is near, and lots of friends are here. Tell- Getting close to cmap
of 13. Farmer Not In- Makes
run for 22. BM- Gets flushed to 53. See you in Intraday Stool. Dr. Stepan N. Stool Share your thoughts on the Stool Pigeons Wire.
Renewals Welcome, and thank you for subscribing to the Anals of Stock Proctology. Your trial subscription will run for 90 days. At the end of that period your subscription will renew automatically, unless you cancel. If you wish to cancel your subscription use the button below. If you want to renew your subscription do nothing. Your subscription will renew and your credit card or Paypal bank account will be charged. If you want to renew, be sure your credit card information in your Paypal account is current. Paypal will not renew your subscription if the card has expired! Again, thanks for subscribing!
Explanation of Intraday Commentary-Build charts at http://www.livecharts.com. For custom time bars insert a comma after symbol and number of minutes, e.g. compx,90. This will give you a bar chart of the Nas with 90 minutes per bar. The one day cycle is usually most clear with 8 minute bars and 26/18 stochastics. It varies from day to day. Sometimes 6 minutes works best. Experiment to find the best fit for your trading style, and the market's dominant frequency at the time. The goal here is primarily to monitor the condition of the 8 and 13 day cycles. I typically use 90 minute bars with 26/18 stochastics for the 13 day cycle proxy on the indices during regular trading hours. Other cycles use 26/18 stochastics with the following: 8 days- 60 minute bars On the 24 hour futures charts, use a time per bar approximately 3 to 4 times the above number of minutes, to represent the cycles listed above. ABBREVIATIONS: cma: centered moving average
|
|||||||||||||||||||||||||||||||||||||||||||||||||||||||||||||||||||||||||||||||||||||||||||||||||||||||||||||||||||||

![[Most Recent HUI from www.kitco.com]](http://www.weblinks247.com/indexes/idx24_hui_en_2.gif)
![[Most Recent XAU from www.kitco.com]](http://www.weblinks247.com/indexes/idx24_sp500_en_2.gif)
![[Most Recent Quotes from www.kitco.com]](http://kitconet.com/charts/metals/gold/t24_au_en_usoz_2.gif)