|
Archives 12/30/01, 1/1/02, 1/2/02, 1/3/02, 1/4/02, 1/7/02, 1/8/02, 1/09/02, 1/10/02, 1/11/02, 1/14/02, 1/15/02, 1/16/02, 1/17/02, 1/18/02, 1/22/02, 1/23/02, 1/24/02, 1/25/02, 1/28/02, 1/29/02, 1/30/02, 1/31/02, 2/1/02, 2/4/02, 2/5/02, 2/06/02, 2/7/02, 2/9/02, 2/11/02, 2/12/02, 2/13/02, 2/14/02, 2/16/02, 2/19/02, 2/20/02, 2/21/02, 2/23/02, 2/25/02, 2/26/02, 2/27/02, 2/28/02, 3/1/02, 3/04/02, 3/05/02, 3/06/02, 3/7/02, 3/10/02,3/11/02, 3/12/02, 3/13/02, 3/14/02, 3/15/02, 3/18/02, 3/19/02, 3/20/02, 3/21/02, 3/22/02, 3/25/02, 3/26/02, 3/28/02, 3/30/02 4/1/02, 4/2/02, 4/3/02, 4/4/02, 4/6/02, 4/8/02, 4/9/02, 4/10/02, 4/11/02, 4/13/02, 4/15/02, 4/16/02, 4/17/02, 4/18/02, 4/20/02, 4/22/02, 4/23/02,4/24/02,4/25/02, 4/26/02, 4/27/02, 4/29/02, 4/30/02 5/01/02, 5/2/02, 5/4/02, 5/6/02, 5/07/02, 5/8/02, 5/09/02, 5/10/02, 5/13/02, 5/14/02, 5/15/02, 5/16/02, 5/17/02, 5/20/02, 5/21/02, 5/22/02, 5/23/02, 5/24/02, 5/28/02, 5/29/02, 5/30/02 6/01/02, 6/3/02, 6/4/02, 6/5/02, 6/6/02, 6/7/02, 6/10/02, 6/11/02, 6/12/02, 6/13/02, 6/14/02, 6/17/02, 6/18/02, 6/19/02, 6/20/02, 6/22/02, 6/24/02, 6/25/02, 6/26/02, 6/27/02, 6/30/02 7/1/02, 7/4/02, 7/5/02, 7/11/02, 7/14/02, 7/15/02, 7/16/02, 7/17/02, 7/18/02, 7/19/02, 7/22/02, 7/23/02, 7/24/02, 7/25/02, 7/27/02, 7/29/02, 7/30/02 8/1/02, 8/3/02, 8/5/02, 8/6/02, 8/7/02, 8/8/02, 8/10/02, 8/12/02, 8/13/02, 8/14/02, 8/15/02, 8/16/02, 8/19/02, 8/20/02, 8/21/02, 8/22/02, 8/23/02, 8/26/02, 8/27/02, 8/28/02, 8/29/02, 8/30/02 9/3/02, 9/4/02, 9/5/02. 9/6/02, 9/9/02, 9/10/02, 9/11/02, 9/12/02, 9/13/02, 9/16/02, 9/17/02, 9/18/02, 9/19/02, 9/20/02, 9/23/02, 9/24/02, 9/25/02, 9/26/02, 9/27/02, 9/30/02 10/1/02, 10/2/02, 10/3/02, 10/4/02, 10/7/02, 10/8/02, 10/9/02, 10/10/02, 10/11/02, 10/14/02, 10/15/02, 10/16/02, 10/17/02, 10/18/02, 10/21/02, 10/22/02, 10/23/02, 10/24/02, 10/25/02, 10/28/02, 10/29/02, 10/30/02, 10/31/02 11/1/02, 11/4/02, 11/5/02, 11/6/02, 11/7/02, 11/8/02, 11/11/02, 11/12/02, 11/13/02, 11/14/02, 11/15/02, 11/18/02, 11/19/02, 11/20/02, 11/21/02, 11/22/02, 11/25/02, 11/26/02, 11/27/02, 11/29/02 12/2/02,
12/3/02, 12/4/02,
12/5/02 1/1/03, 1/2/03, 1/03/03, 1/6/03, 1/7/03, 1/8/03, 1/9/03, 1/10/03, 1/13/03, 1/14/03, 1/15/03, 1/16/03, 1/17/03, 1/21/03, 1/22/03, 1/23/03, 1/24/03, 1/27/03, 1/28/03, 1/29/03, 1/30/03
 Doc's view of the Street. |
The Anals of Stock ProctologyPublished weeknights by
8:30PM Happy Acres, Florida Time The American
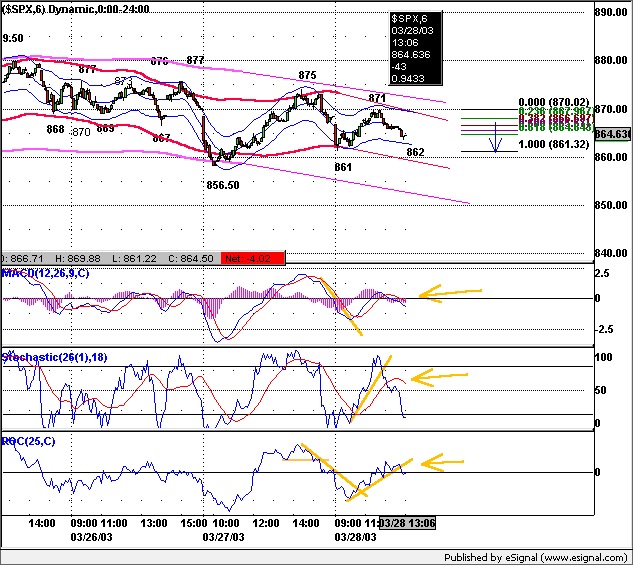
Academy of Stock Proctology and Is your subscription up for renewal? If you want to renew, do nothing, unless your credit card has expired. Please be sure your credit card info is current. If your credit card has expired, you must enter the new expiration date in your Paypal account in order for your subscription to be processed. If you subscribed via Paypal, your subscription will be renewed for one year on the 90 day anniversary of your sign-up and your credit card will be charged. If you want to cancel, use the button at the bottom of the page. This applies only if you subscribed through Paypal. Mailed-in subscriptions are for 1 year. If you subscribed by prior contribution, I will send you a notice before your subscription expires. If you have any questions, see the subscription page and FAQ's. If you can't find the answer, email me. Big Fine Print Doc does not make trading recommendations. This update reports time cycle estimates and centered moving average projections based on the Hurst cycle analysis method, and other techniques. This publication is for entertainment and educational purposes only. Doc assumes no responsibility for the accuracy or inaccuracy of the estimates and projections presented. The market may or may not meet the projections. Stoolies should thoroughly familiarize themselves with the methodology before trading based on this method. Those who do not have the time or inclination to develop a trading strategy based on testing and research should not trade. Trade at your own risk. Yadda yadda. How's your motha? More disclaimers at the bottom of the page. Doc welcomes the many new junior stock proctologists who have joined the American Society of Shortsellers in the past week. If you are not an experienced chartist or trader, ok, even if you are, you may find the Anals just a bit confusing for a little while. But Fear Not! You will get it after a few days, at most a couple of weeks. Questions can always be posted on the Stool Pigeons Wire message boards, where Doc and/or your fellow stoolies will respond. Explanations of abbreviations and terms are at the bottom of the page. The complete list of links to the entire archive is in the left column menu. Now it's time to sit back, relax, and enjoy the show. Many tanks! Doc Intraday Updates 2/3/03 12:30 PM 12:30 to 2 PM is the window for the 1 day cycle high, as well as the 3 day cycle high. However it's not clear that it would end what appears to be an 8 day cycle swup. It might, but at this point it's too early to tell. At the other extreme, if today's earlier high is taken out, which looks unlikely, then we'd have to reevaluate the slope of the bigger channels. Chart below. Join Doc for regular intraday updates in Stooltrading beta. 9:15 AM Fucutures were strong overnight, setting an upside cmap of 863. They double topped this morning at 862, and have backed down now to around 859, which is where the SPX should open. A one day cycle low "should" be set soon after the open. QQQ hit a cmap of 24.75 at 9 AM and are backing down. A 1 day cycle low is expected on those in the first hour. No price projections for the downside on either. The pullback should be mild. One day cycle highs should begin to form around 12:30 through 2 PM. The 3 day cycle upside cmap is 24.85-90 on the QQQ and, based on the fucutures, 866 on the SPX. As I enumerated in the Anals, signs on balance point to another week of swup, but that could change at a moment's notice. Intraday Friday - One day cycle lows were established in the first hour Friday, near the cmaps. The up phase followed with highs between 12:30 and 2 PM, again, near the cmaps. The following down phase looked like it was about to really get rolling in the last half hour, when suddenly the institutional portfolio sphincters threw everything they had at the tape in an effort to put some lipstick on month end statements. It was a truly disgusting display. Someone should go to jail. We should see a 1 day cycle low in the opening hour Monday . Whether that's on a huge gap down or just a small decline, US players will have to let the rest of the world decide. An up phase into mid day should follow. Pre Market Update at 9:15 AM NY time. Get StoolieSignal Special offer here only! The cycle map below is en estimate of how the market might behave over the next few hours. Should the pattern be broken, the map should be redrawn to fit the actual. Cmaps and times shown are guidelines only. Cycles vary in wavelength and amplitude. Directional changes within an hour of the expected turn and a few points of the cmap should be respected. The indicators rule. Times and prices are the projected cycle highs and lows with cmaps. 5-8 Day Cycle______ 2-3 Day Cycle_______ 5 Hr-1 Day Cycle
Friday's
Markets Reaching For the Stars 2/1/03 Doc shares with all stoolies a sense of profound sadness at the loss of heroes. But let us consider not their dying, but the wonder of their living. Seven extraordinary people spent their lives pursuing their dreams, yet always in service to their fellow man. Their courage, their dedication, and the selflessness of the entirety of their beings, are things of wonder. Now, they have achieved immortality. In the everyday business of money and Wall Street, there are few heroes. Selflessness is not a word that applies. This business is not about the pinnacles of human achievement, about expanding the limits of human knowledge, about caring and sacrifice and service to humanity. It is about money. It is about victims and victimizers. It is but a game, a dance, run by the slick and the venal, preying on a dancehall full of wide eyed fools willing to hand over the fruits their life's labor in the naive belief of the dance master's worthless promises. Pursuing a dream in this arena seems so trivial, but this is what I love to do. Perhaps it is what you love to do, too. Doing it has to be our contribution, however small. Each of us must find his own path. That is all we have, and that is the role we play in supporting our world. We must all reach for the stars, our stars, whatever they may be. Bears are divided about the market in the coming week. Some are looking for the continuation of a sustained decline. Others are looking for rallies of varying degrees. Bulls are just gaming a war scenario and praying that the caca doesn't all hit the fan at once. But war they say, is bullish. It is disgusting to relate war to the performance of the stock market. There is no connection. While there will always be noise and distortions in response to surprising news, the market will follow it's cycle path. Don't even think of wasting your time trying to game war scenarios. Doc sees a mix of signs that suggest the market could consolidate for a week or so, maybe drifting lower in the process, maybe not. Overall it does not look like anything dramatic will happen in either direction, as the indications are mixed. For a big move, the cycles need to be in gear, and it doesn't look like we are there yet. That could change by the end of the week. That's why we reevaluate it every day. The weak end's evaluation is below. Doc's Pooper Scooper. Be a Johnny Applestool! Help spread the Stool! Feel free to repost snippets from the Anals on message boards around the web. Just give a link back! Many tanks - Doc The Feed added a net of $1.75 billion. They did $5.75 billion in weekend repos while $4 billion expired. The $5.75 billion will expire Monday. This small addition to Feed looks like a half hearted attempt to stem the bleeding in the markets. If so, it is not going to work.. The Feed Index is still unchanged over the last two months and it will take an enormous amount of pumping to help stocks. That is probably not going to happen because of the inflationary implications such a move, and the precarious position of the bond market. Two
trends are evident on the Feed Index, which is the total Fed holdings of
loans and securities. One is the 10% growth trend beginning in May of
2001. The blue channel going back to last December suggests a 5% growth rate. Look at the 4 week moving
average (brown line) and compare it with the slope of the tow larger
channels for an indication for whether the slope of short term growth is
slower or faster than the 2 longer term trends. The Feedometer has established a short term downtrend channel. A rising Feedometer is good enough to hold the market flat. A decline in the Feedometer assures falling stock prices because there is not enough liquidity from institutions to offset the drain of foreign capital. Al must Feed, or the market shall recede. The
Feedometer theoretically measures excess Feed available for bond or stock
market jamming. Al selects a trend level he feels is needed to reflatulate
the economy. The Feedometer measures the difference between the apparent
trend target, and actual day to day Feeding (Fastow Feedometer), as well
as a four week moving average (Slowmo Feedometer). A break above the
orange trendline might indicate a more aggressive jamming policy.
Bond yields were down slightly Friday and continue to trade in an ever
narrower range. Indicators are stuck in neutral, and cycle waves are
diminishing in amplitude. How long can this can go on? With the 6
month cycle low now due, the next significant move will be up, and it should be
within days or weeks. Long Term
Doc concluded that bond yields are making a long term bottom because the
lower line of a long term linear regression channel has been pierced,
indicating the extreme over extension typical of a blowoff, and at the same
time, long term downside cmaps were met. Consider that a yield bottom is a
price top. Major tops take a long time to unfold. Bond yields could trade
in the 3.60 to 4.30 range for many months. If the 6 month cycle oscillator
turns up before dropping below the zero line, look for a big up move.
Otherwise just more of the same for up to a year. Dow Inflatables- One
to two weeks to go in the 6-7 week cycle and the cmap looks to be around 7550.
The 10-13 week cycle down phase will still have 3-6 weeks left at that point and
should have a substantially lower low, perhaps around 7200, i.e. a retest of the
October low. In the very short run, the Dow is still in a 13 day cycle swup. The
4 week cycle is also turning up. All of which means there will be plenty of
crosscurrents to drive us crazy next week. We be swuppin'! No crash next
week. All of Doc's daily cycle charts
are powered by METASTOCK Portfolio Sphincters Index (SPX) and Sentiment Cycle Chart Short Term Cycles The short cycle oscillator continued to rise. It looks increasingly likely that the 4 week cycle is in a swup, in spite of the fact that it still has a downside cmap of 820-830. The 4 week cycle up phase normally manifests as a slowing in the downtrend or a sideways movement, when longer cycles are heading lower. This movement began 54 days ago, and could extend for 5 -7 more days during which time the short cycle oscillator will rise while the index treads water. The 6-7 week cycle continues lower, and this should keep a lid on the upside potential. The 6-7 week cycle low is probably still 10 trading days away. The 17 day rate of change remains in a downtrend. The downside cmap on the 4-7 week cycles is now 820, subject to adjustment each day until the low is behind us. That cmap may yet move lower before the cycle ends. The 6-7 week cycle oscillator on the chart below is getting into a bottom zone. When larger cycles are in a down phase, the upturn in this oscillator will lead the price upturn by several weeks. Chartists are familiar with this as a positive divergence. The second upturn will mark the start of a rally. With the 10-13 week cycle heading down, the first upturn in the 6-7 week oscillator should be taken as an early warning of an impending turn within a week or so. 10-13 Week Cycle The 10-13 week cycle oscillators are heading down slowly. The one in the top chart is getting into a bottoming zone. It should stay down there and bounce around for weeks. When it forms a trough, and then begins to rise above the smaller peaks within the trough area, that would be the time to cover swing shorts. The 29 day ROC and the Stoolicator should confirm at that point. There should be 6-9 weeks remaining in this down phase. The 29 day rate of change is moving ever so gradually lower. Doc still expects a drip drip bounce, drip drip bounce, for weeks. The preliminary cmap is now 770-810, but could go lower as the cycle gets into its last few weeks. The next week or two should continue to be choppy, at least until the halfway point of the cycle is past in mid February. Dip buying will still be prevalent until then. Sentiment VIX declined. (down on the inverted scale chart). The touch of the lower channel Monday coincided with a short cycle low. Over the next few weeks the channels will turn lower and we should see much bigger numbers on VIX. The next big intermediate cycle low should see at least 50-60.
The 15 day rate of change is a proxy for the
4-7 week cycle. The 29 day rate of change is a proxy for the 10-13 week
cycle. The dark blue overlaid line is the 10-13 week cycle
oscillator, while the red line is the 6-7 week cycle oscillator. The VIX
is a measure of implied options volatility reflecting relative fear or
complacency. It is plotted below on an inverse scale to better show the
relationship to the price chart. The "Stool Bands" may reflect
either 6 month or 10-12 month cycles. Linear Regression Analysis- The rally off the July-October lows is the first to fail to reach the upper regression projections within 4 months of breaking the lower channel in the bear market. The 1 year regression is sloping down more sharply than at any time throughout this bear. Through the magic of METASTOCK, Doc took the 12 month regression channel with the time span fixed at one year, and moved it across the entire chart. In no prior 12 month period was the down slope as sharp as it is now. Having failed to break this 1 year regression channel, the market is about to enter a period of extended and accelerated decline. The last line of defense is the long term central regression projection. Now that the SPX has fallen below that, the bottom will drop out.
Long term cycle configurations are shown on the chart below. Keep in mind that the longer the nominal cycle length the greater the variance in the actual length of the cycle. The 18 month cycle can range from 12 to 24 months. The nominal 4 year cycle can be 3 years. It can be five years. Four years, give or take a few months has been most typical, especially in the latter half of the twentieth century, but a 3 year cycle is not uncommon. In the first half of the century, cycles frequently lasted 3 or 5 years. Hurst called them "nominal" cycles because cycles vary in length. Looking at charts going back 100 years or more you can see that a 1 year variance is not uncommon for the 4 year cycle. The 4 year cycle low was between the April and September 2001 lows. The 4 year cycle actual price high was in January 2002. The rally from the September lows to the final high in March 2002 was, in essence, a 4 year cycle bull market within a long term secular bear market. As opposed to the price high, the wave high is where the upper edgeband of the wave envelope contacts the upper band of the next longer wave. That was probably last November, when speculative fever was at its peak. The degree of speculative mania during the 3 month trading range in the fourth quarter is consistent with a major 4 year cycle top. The July-October double bottom looks like a nominal 18 month cycle low. The 18 month cycle wave high is ideally due around mid-year but the price high was probably in December. The wave high looks like it was in early January again coinciding with a wave of speculative mania. The 18 month and 4 year cycles should be in gear to the downside into at least the first half of 2004. At the current secular trend rate of decline, the mid year 2004 low extrapolates to between 585 and 676. In the event of a panic low an extreme of 525 is possible. For 2003, the low will probably be near 650 late in the third quarter or early in the fourth. That would be followed by a tepid year end rally of 10% or so. Currently the 10-12 month cycle is forming a top. The 6 month cycle is uncertain. The low may occur within a few weeks or it could extend into late March. The 6 month cycle may have resynchronized from the October 18 month cycle low. The variance in this cycle is a month to 6 weeks. Cycle lengths of 5-7 months are common. In this case the 12 month cycle starting down will limit any upside on the 6 month cycle. The probability of extended periods of decline, with brief interruptions, is high throughout the first half of this year. The current breakdown suggests the index will move to the bottom of the 18 month channel on the current 13 week cycle down phase, which is expected to last into March. Then after one or more weak rallies following "successful retests" of the lows, there will be another 20% killer wave down in the second half of 2003. (Subject to
change without notice. Dealer title, tax, and tags not included. Consult
your local directory for prices in your area. Past performance is not necessary
to be a Wall Street analcyst.) The Cycle Conditions tables include cycle phase and a wild guess as to number of periods to the next turn, in days for the shortest cycles, weeks (W) or months (M) for the longer ones. This is a fluid exercise, in other words, the projections are likely to be wrong, but they force us to be vigilant for key turning points, and frequently work well enough to prevent costly misreadings. SPX Cycle Conditions as of 1/31/03
PTT - Periods Till Turn Nasgap Charts The Nas is expected to behave more like the SPX with the continued de-weighting of tech. In the interest of publishing the Anals earlier in the evening Doc is presenting the charts and data without commentary, as it is largely redundant relative to the SPX commentary above. Cycle Chart Long Term View The cycle configurations are similar to those of the SPX. The 12 month cycle is forming a top. If the 13 week cycle down phase now under way does not break the lows, the next one will. The low for the year will be in the third quarter and may approach 700. The 3-4 year cycle low would be due no earlier than mid 2004. Ultimately the 3-4 year cycle low should be around 400, or below on a selling panic. After the following bull phase, the next bear phase will end with the Nasdaq folding, and the bigger stocks going over to the NYSE, perhaps in 2008 or 2009.
Nasdaq Cycle Conditions as of 1/31/03
PTT
- Periods Till Turn Suctor Watch and Stoolwethers- Now posted on separate page. Updated each morning between 8 AM and 9:00 AM NY time. Long Bong Hit - See top of page. Golden Stool Comments 2/2/03 PM Both Gold and Cousin HUI backed down a bit Friday. Gold has reached an uptrending resistance line. It will either blow through after consolidating for a few months, or it may trend below the line. It has probably gone as far as it's going to go for now, but as you can see from the long term projection in the weekly charts, $400 by mid year is a foregone conclusion. While there are indications of probable consolidation, there's no sign of significant pullback. If you are waiting for one, you may have a l-o-o-o-ng wait.
Charts as of 1/31/03 Close
HUI's picture
is a bit different. Reports of hedge funds buying the metal and shorting
the stocks may have some credence. Doc is focusing on a slightly different
cyclicality in the precious metals. The 4 month cycle has been in a
sideways down phase for 6 weeks. The end of the down phase is due in two
weeks. Doc thinks it's a bad idea to be short these stocks. Looking at the
weekly charts, Doc thinks a jailbreak is going to happen soon, with HUI
headed for 200 by mid-year. In the short run, HUI's downside cmap on the
13 day cycle is 138.
Uncle Buck's Illness Comments 2/1/03 Uncle B has gone into an up phase in his 13 week cycle. Given the downward slope of longer cycles, the up phase should be no more than a consolidation in the downtrend, although it could feature a brief rally at the beginning of this up phase. The 101 area looks like a ceiling. Longer term cmaps now look like 96 and perhaps 92, around mid-year. Doc is not a big believer in intermarket analysis, but Uncle B and SPX (gray line on chart) usually move in the same direction at the same time. Relative magnitude varies greatly, however. An up phase in the dollar suggests that we should be alert to the possibility of stocks stabilizing as long as Uncle Buck does. Chart as of
1/31/03 close
Get StoolieSignal Special offer here only! Suctor Watch and Stoolwethers- Now posted on separate page. Updated each morning between 8 AM and 9:00 AM NY time. See you in Intraday Stool. Dr. Stepan N. Stool Share your thoughts on the Stool Pigeons Wire.
Renewals Thank you for subscribing to the Anals of Stock Proctology. Your trial subscription will run for 90 days. At the end of that period your subscription will renew automatically, unless you cancel. If you wish to cancel your subscription use the button below. If you want to renew your subscription do nothing. Your subscription will renew and your credit card or Paypal bank account will be charged. If you want to renew, be sure your credit card information in your Paypal account is current. Paypal will not renew your subscription if the card has expired!
Explanation of Intraday Commentary-Build charts at http://www.livecharts.com. For custom time bars insert a comma after symbol and number of minutes, e.g. compx,90. This will give you a bar chart of the Nas with 90 minutes per bar. The one day cycle is usually most clear with 8 minute bars and 26/18 stochastics. It varies from day to day. Sometimes 6 minutes works best. Experiment to find the best fit for your trading style, and the market's dominant frequency at the time. The goal here is primarily to monitor the condition of the 8 and 13 day cycles. I typically use 90 minute bars with 26/18 stochastics for the 13 day cycle proxy on the indices during regular trading hours. Other cycles use 26/18 stochastics with the following: 8 days- 60 minute bars On the 24 hour futures charts, use a time per bar approximately 3 to 4 times the above number of minutes, to represent the cycles listed above. About centered moving average projections. ABBREVIATIONS: cma: centered moving average |


![[Most Recent HUI from www.kitco.com]](http://www.weblinks247.com/indexes/idx24_hui_en_2.gif)
![[Most Recent XAU from www.kitco.com]](http://www.weblinks247.com/indexes/idx24_sp500_en_2.gif)
![[Most Recent Quotes from www.kitco.com]](http://kitconet.com/charts/metals/gold/t24_au_en_usoz_2.gif)