|
Archives 12/30/01, 1/1/02, 1/2/02, 1/3/02, 1/4/02, 1/7/02, 1/8/02, 1/09/02, 1/10/02, 1/11/02, 1/14/02, 1/15/02, 1/16/02, 1/17/02, 1/18/02, 1/22/02, 1/23/02, 1/24/02, 1/25/02, 1/28/02, 1/29/02, 1/30/02, 1/31/02, 2/1/02, 2/4/02, 2/5/02, 2/06/02, 2/7/02, 2/9/02, 2/11/02, 2/12/02, 2/13/02, 2/14/02, 2/16/02, 2/19/02, 2/20/02, 2/21/02, 2/23/02, 2/25/02, 2/26/02, 2/27/02, 2/28/02, 3/1/02, 3/04/02, 3/05/02, 3/06/02, 3/7/02, 3/10/02,3/11/02, 3/12/02, 3/13/02, 3/14/02, 3/15/02, 3/18/02, 3/19/02, 3/20/02, 3/21/02, 3/22/02, 3/25/02, 3/26/02, 3/28/02, 3/30/02 4/1/02, 4/2/02, 4/3/02, 4/4/02, 4/6/02, 4/8/02, 4/9/02, 4/10/02, 4/11/02, 4/13/02, 4/15/02, 4/16/02, 4/17/02, 4/18/02, 4/20/02, 4/22/02, 4/23/02,4/24/02,4/25/02, 4/26/02, 4/27/02, 4/29/02, 4/30/02 5/01/02, 5/2/02, 5/4/02, 5/6/02, 5/07/02, 5/8/02, 5/09/02, 5/10/02, 5/13/02, 5/14/02, 5/15/02, 5/16/02, 5/17/02, 5/20/02, 5/21/02, 5/22/02, 5/23/02, 5/24/02, 5/28/02, 5/29/02, 5/30/02 6/01/02, 6/3/02, 6/4/02, 6/5/02, 6/6/02, 6/7/02, 6/10/02, 6/11/02, 6/12/02, 6/13/02, 6/14/02, 6/17/02, 6/18/02, 6/19/02, 6/20/02, 6/22/02, 6/24/02, 6/25/02, 6/26/02, 6/27/02, 6/30/02 7/1/02, 7/4/02, 7/5/02, 7/11/02, 7/14/02, 7/15/02, 7/16/02, 7/17/02, 7/18/02, 7/19/02, 7/22/02, 7/23/02, 7/24/02, 7/25/02, 7/27/02, 7/29/02, 7/30/02 8/1/02, 8/3/02, 8/5/02, 8/6/02, 8/7/02, 8/8/02, 8/10/02, 8/12/02, 8/13/02, 8/14/02, 8/15/02, 8/16/02, 8/19/02, 8/20/02, 8/21/02, 8/22/02, 8/23/02, 8/26/02, 8/27/02, 8/28/02, 8/29/02, 8/30/02
|
The Anals of Stock ProctologyPublished weeknights by
8:30PM Happy Acres, Florida Time The American Academy of Stock Proctology and Is your subscription up for renewal? If you want to renew, do nothing, unless your credit card has expired. Please be sure your credit card info is current. If your credit card has expired, you must enter the new expiration date in your Paypal account in order for your subscription to be processed. If you subscribed via Paypal, your subscription will be renewed for one year on the 90 day anniversary of your sign-up and your credit card will be charged. If you want to cancel, use the button at the bottom of the page. This applies only if you subscribed through Paypal. Mailed-in subscriptions are for 1 year. If you subscribed by prior contribution, I will send you a notice before your subscription expires. If you have any questions, see the subscription page and FAQ's. If you can't find the answer, email me. Update 9/6/02 12:30 PM Terms and methodology The 1 day cycle cmaps were slightly exceeded this morning but the timing was as expected. the 5 hour and 1 day cycles should be in down phase, but the direction is uncertain. Could be down or sideways. The cycle lows are due around 1:25 and 2:55. With the 5, 8, 13 day, and 4 and 6-7 week cycles turning up, that means the market could go out very strong toward the close. It's too early to think about getting short yet. The 5 and 8 day cmaps are preliminary. If they get to those levels quickly and break through, we will be looking at higher numbers.
Doc does not make trading recommendations. This update reports intraday time cycle estimates and centered moving average projections based on the Hurst cycle analysis method. Doc assumes no responsibility for the accuracy or inaccuracy of these estimates and projections. The market may or may not meet these projections. New stoolies should thoroughly familiarize themselves with the methodology before trading based on this method. There is no free lunch. Those who do not have the time or inclination to develop a trading strategy based on testing and research should not trade. Trade at your own risk. Update 9/6/02 9 AM Terms and methodology Fucutures are off to the races. Here's the first of what could be a series of spikes and selloffs as the stage managers and portfolio sphincters conspire to engineer a "perfect bottom." The 5 hour and 1 day cycle up phases are due to peak around 10:15 and 11:45 AM. While the 5 and 8 day cycles may be in an up phase for a couple of days, it's not clear at this point that the highs will be much higher than today's highs. We should get a better idea by the mid-day update.
Shorts, Spikes, and Hammers (9/5/02) Weakness overnight Wednesday and Thursday was a bit of a surprise after Wednesday's strong close. Following an initial plunge the market stabilized while awaiting the non-news from Intel. It wasn't worse than expected so the knee jerk was to the upside after the bell. There are still plenty of signs that a couple of the shorter cycles are at or within 2% of cycle lows, but the almighty 10-13 week cycle has rolled over and is headed down. The 6 month cycle is still in an up phase, if you can call it that. It's moving sideways across the major trend channel as the indicators for the cycle decelerate as they higher. The 4 and 6-7 week cycles should bottom within 5 days, perhaps as soon as today. When those cycles turn up, they'll be in gear with the 6 month cycle, but working against a 10-13 week cycle that wants to come down. Even if the up phase of the 6-7 week cycle is short, we are probably looking at 2-3 weeks before a really big downside move. In the meantime it will be churn and burn, which is ok for scalping day trades and overnight positions. You'll have to pay close attention to intraday indicators to make the most of it. Doc doesn't see much chance of meaningful upside at this point. Mostly it's a matter of time before the market breaks down. Keep in mind that the stage managers and portfolio sphincters may be in cahoots in attempting to engineer a "perfect bottom", with a retest or near retest of the July lows, followed by a manufactured rally, and Proctovision proclaiming multiple major bottom sightings. The closer the market gets to those lows, the more violent the spikes will be as trading programs kick in. Doc guesses that we'll see more than one before the buying ammo is exhausted and the market crashes through the lows. You don't want to be sitting in your shorts when one of those spikes pops up. But when they do, hammer 'em! The Feed drained 4.5 billion on Thursday. $3 billion in 28 day repos were rolled. They did an additional $8.5 billion in overnight repos, but that was more than offset by expiration of $7 billion in overnight repos and and $6 billion in 7 day repos. The $8.5 billion issued Thursday will expire Friday. Anything less than that in new repos will represent a drain. As a result of two days of
moderate draining we are left to wonder whether Al is pumping or not.
Total Feed remains below the peak level reached in early June, but is
still within the 10% annual growth channel. The Feedometer, which theoretically
measures excess Feed available for market jamming, is back to neutral. Doc
is convinced that, barring a total collapse which endangers the immediate
stability of the financial system, Al has decided to let the market sink
or swim on its own. It's pretty clear that they are no longer responding
to sharp drops in the market with the kind of massive pumping we saw last
year. The adjusted monetary base through
September 4 reflects the pattern we see in the Feed Index on a day to day
basis, with growth slowing dramatically over the last two months. Broader measures of money, such as
MZM were growing rapidly through 8/26. The growth rate may
accelerate as the brunt of the mortgage bulge is
funded. This probably explains why Al held back on feeding for awhile. Now
that the economy is failing to respond to all the money, we can only
wonder when they will out and out panic. Probably it will take at least
another month. By that time broad money growth should be exploding. If
there's no uptick in economic data for the concurrent period, it's going
to be extremely interesting to see not only how Al responds, but what the
bond market does as well. M1, while upticking, continues to
lag, reflecting lagging business activity. The trickle down effect isn't
working yet.
All of Doc's
cycle charts
are powered by METASTOCK Portfolio Sphincters Index (SPX) and Sentiment The VIX rose to 42.23. The 30.96 reading on August 22 was the 10-13 week cycle high, as the upper Stool band projection dropped to that level after the fact. It now looks all but certain that we'll see record setting (for this bear market) high numbers on the VIX. The thing to remember is that sentiment extremes change in conjunction with the market's trend and that it is difficult to gauge when a reading is extreme enough to indicate a price high or low. Price based indicators must always be the final arbiter. The 17 day rate of change, a
proxy for the 6-7 week cycle, is
downtrending in negative territory. The superimposed 6-7 week cycle
oscillator (red line) is now at the level from which previous bounces have
launched. The low is due in this cycle at any time over the next 5 days. The
10-13 week cycle oscillator (dark blue) is heading down. It should be at least
4 weeks, and as much as 7 weeks, before a low in this cycle. The upturn in the 6-7
week cycle due any day now, will trigger a reaction rally and a good
short selling opportunity. The 6 month cycle oscillator is headed up, in what can hardly be called an up phase. The trading stoolicator has turned down. The initial signal on that indicator was damned timely but Doc was cautious at the time, as other indicators were lagging. The 10-13 week cycle oscillator just topped out on Wednesday. The 10-13 week cycle is now in a down phase. The big question is whether the upturn due in the 4 and 6-7 week cycles and the up phase still under way in the 6 month cycle will cushion the down phase of the 10-13 week cycle. The short cycle oscillator is on the trampoline. It started to bounce today, but it could also correct upward without a substantial price rise because of mixed cyclicality. Cycle juxtaposition could lead to a volatile rangebound market for several weeks. The beginning of any rally 6-7 weeks after the July low will be widely touted by bulls. The environment will be a tricky one, and Doc still feels that scalping trades over the course of a day or two remains the best strategy in this environment. Very short term downside cmaps are
840-80. The index is already in the upper end of that range. A shot down
to 840 is still possible over the next 5 days.
Fiber Nacho Dump- Support levels and downside targets.
Fiber Nacho Reflux- Resistance levels and upside targets The Cycle Conditions tables include cycle phase and a wild guess as to number of periods to the next turn, in days for the shortest cycles, weeks (W) or months (M) for the longer ones. This is a fluid exercise, in other words, the projections are likely to be wrong, but they force us to be vigilant for key turning points, and frequently work well enough to prevent costly misreadings. SPX Cycle Conditions as of 9/5/02
PTT - Periods Till Turn Nasgap Charts Downside cmaps for the 13 day and 4 week cycles appear to have been met, but the market may be trending, and a lower low is possible for the 6-7 week cycle in the next week or two. The cmap or the 6-7 week cycle suggests a test of the July low may be just ahead. The downturn in the 10-13 week cycle should limit the upside of any rally. The 29 day rate of change is near a sell signal. The signal looks late, but it may also be that the market has yet one more rally left in it before the big dump. Everyone in the world knows that a test of the low is at hand, and that this will mark the end of the bear market. There's a chance that a few cowboys will try to get a jump on that. One way or the other, a series of short vicious bounces are almost a sure thing before a decisive break of the lows. The 10-13 week cycle
is entering a down phase that should
last 4-6 weeks. The short cycle ozzie says
a bounce is due and the 6 month cycle is still headed up. The best bet
under the circumstances is for a few weeks of flop and chop before the Nas
breaks away from the area of the lows.
Fiber Nacho Dump- Support levels and downside targets.
Fiber Nacho Reflux- Resistance levels and upside targets Nasdaq Cycle Conditions as of 9/5/02
PTT
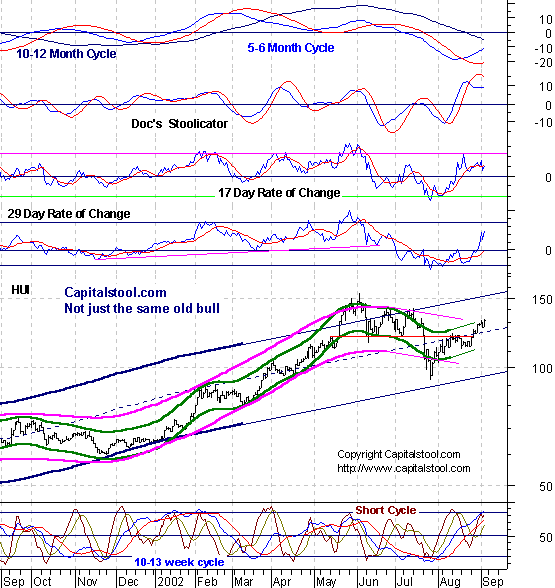
- Periods Till Turn AM Edition Features (Previous) These features are in morning edition, published around 9 AM ET US, or the Saturday Weak End Edition, published, uh, let's see, Saturday! Golden Stool The gold stock
index is trading in the range of its shorter cycle cmaps of 132-133, but
still has a 10-13 week cycle cmap of 140.
The 10 Year bond yield hit short and long term cmaps at 3.90 and is
resting on the long term channel. But there's no sign yet that the trend
will reverse. Uncle Buck's Illness
Buck dipped then rallied overnight. He could bounce a bit more, but mixed
cycles should keep him rangebound for a while before the next big plunge. Biodrech- In the bounce
zone. Where's the bounce? IF it does pop its head up, hammer it. Drugs- Short cycles pause
while everything else begins to turn lower. Consumer- Short cycles
bounce as 10-13 week cycle tops out. Retail- Short cycles head
for bounce while 10-13 week cycle builds top. Bubble- 10-13 week cycle
heading for top as short cycle has small bounce. Small crap- Short cycles
nearing a bounce as 10-13 week cycle builds a top. Bonks- Short cycles within
days of a bounce or pause, but the 10-13 week cycle has topped out. Energy- Surprisingly, 10-13
week cycle also in or near a top phase. Trannies- May have one
bounce left in this sideways up phase before another collapse. SOX- Took out the low, but
resting on level formerly known as support with short cycle bounce due.
Bigger cycles are topping out. The big dump is out there after the pause
that refreshes. Soft Where- 10-13 week
cycle up phase coming to an end, but there's a bounce here somewhere,
first. Nutworkers- More work to do
in 10-13 week cycle sideways up phase before bottom drops out. Internuts- Same story. Telecoms- May retest top of
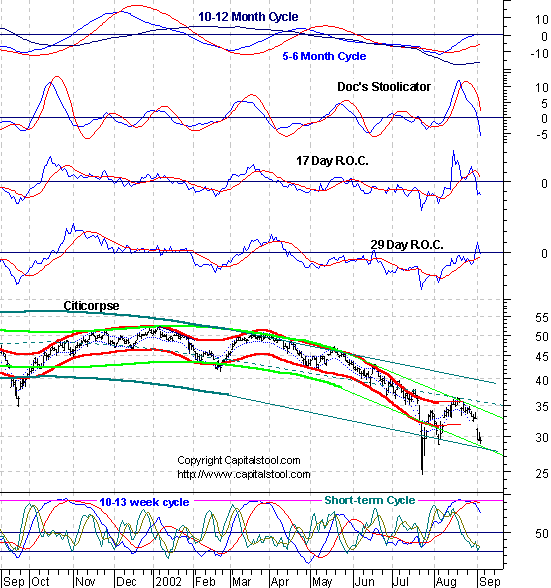
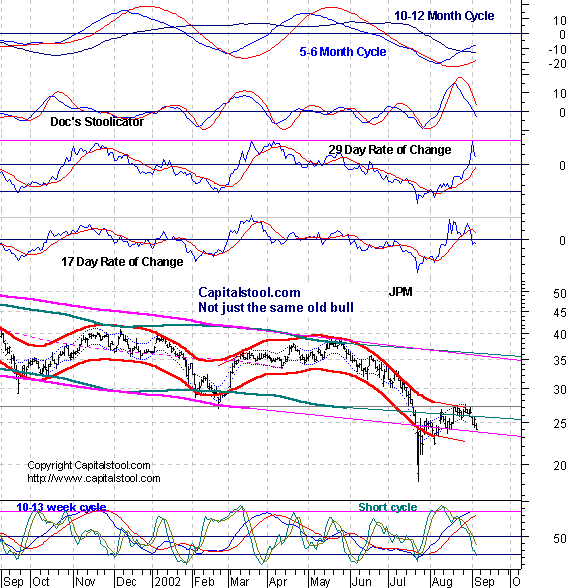
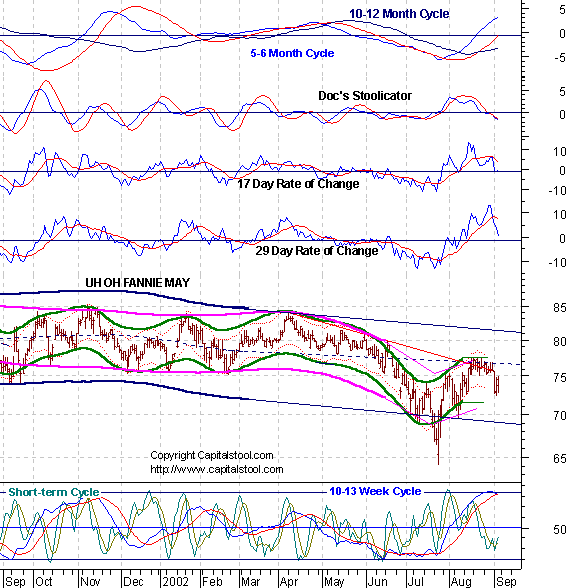
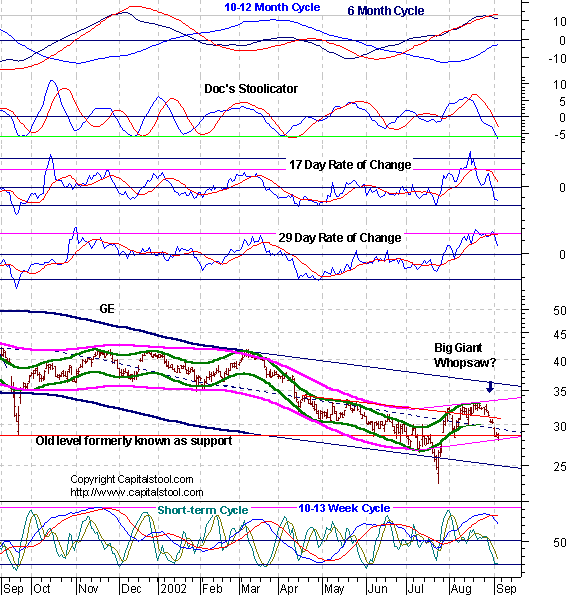
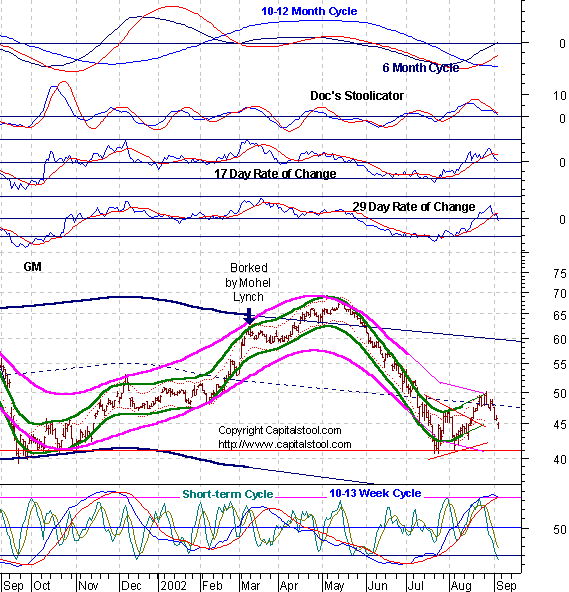
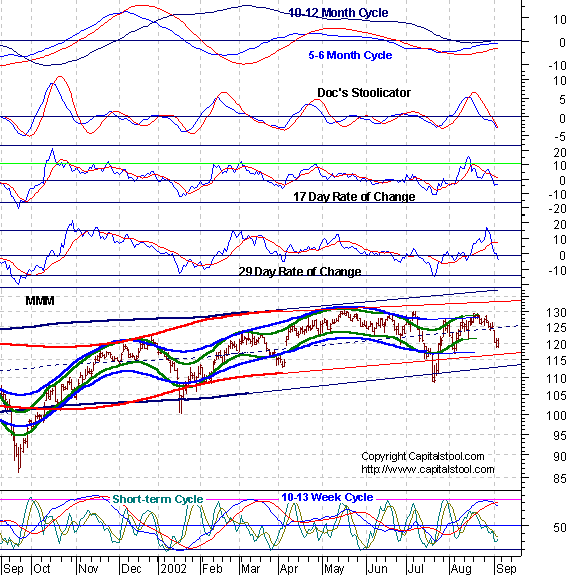
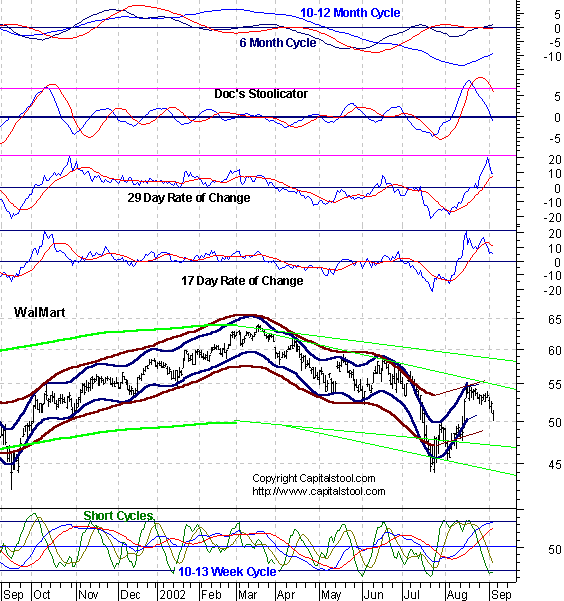
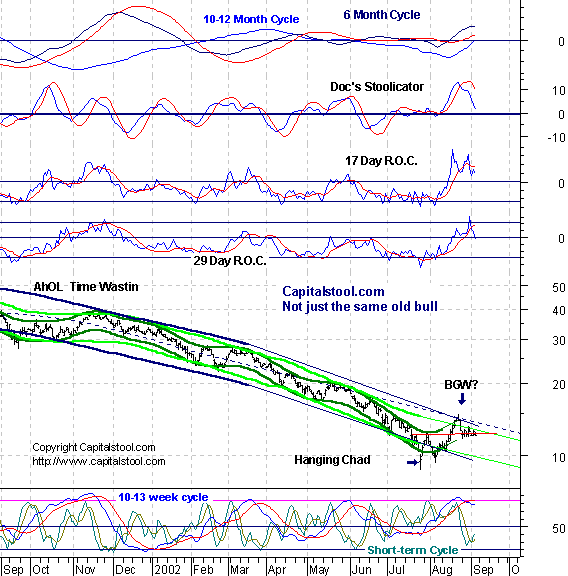
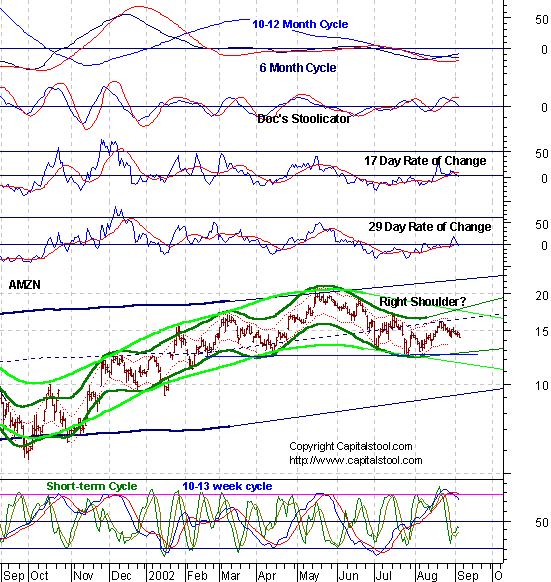
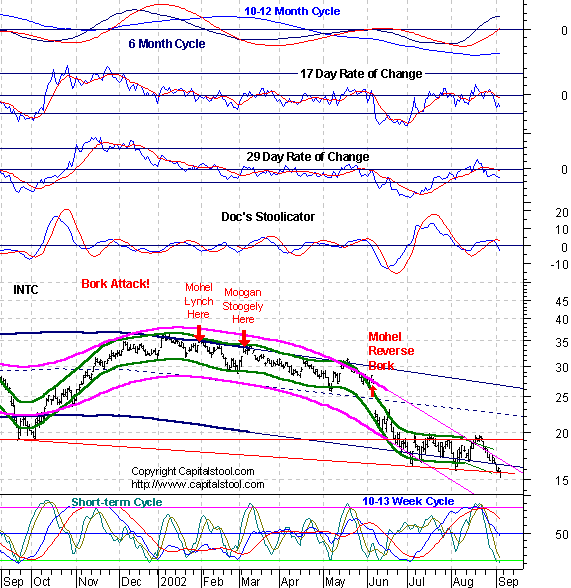
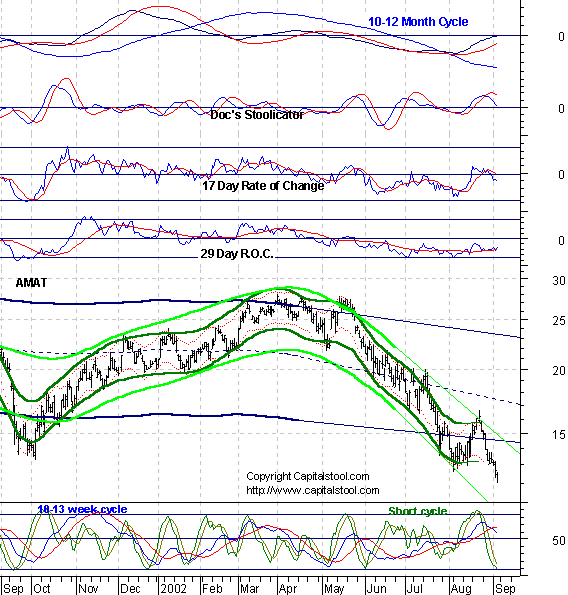
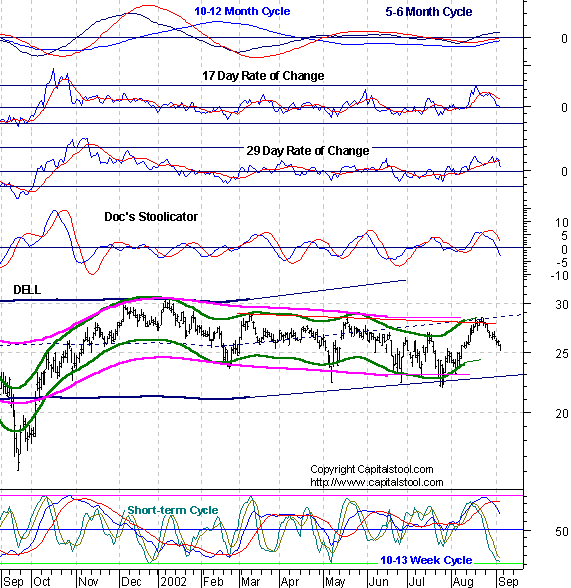
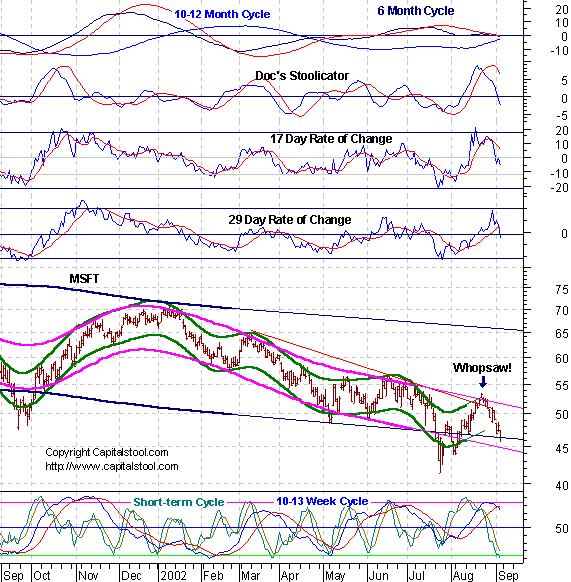
channel before playing dead for good. Stoolwethers - We see the same pattern in almost all the stoolwethers. Short cycle ozzies are in the trampoline zone, while the 10-13 week cycle is topping out, and the 6 month cycle sideways up phase begins to slow. Citicorpse JPM- Fannie- General Custer- The Other General- Major Market Manipulators- Wally's- AhOL- AMZN- This one may have
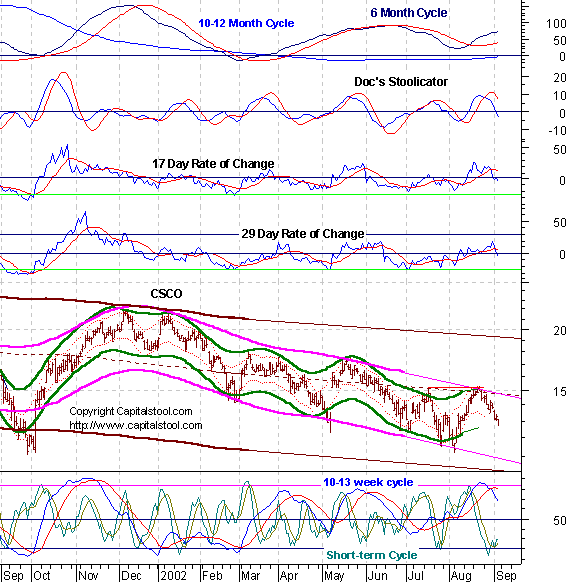
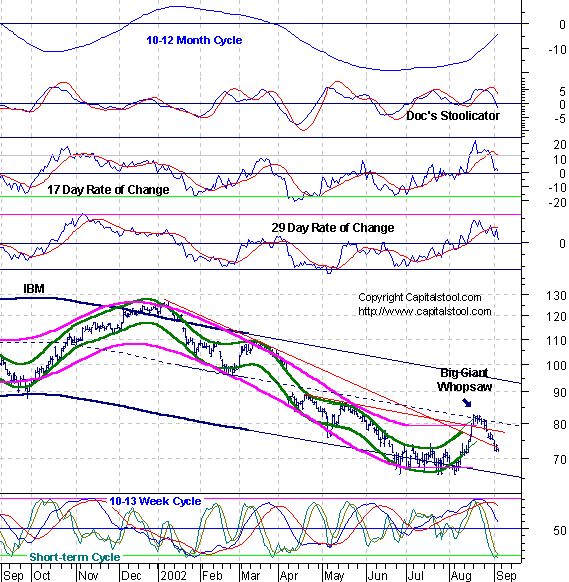
already had its bounce. Tell - AMAT- DELL- Mr. Bill CSCO- MyBM See you in Intraday Stool. Dr. Stepan N. Stool Share your thoughts on the Stool Pigeons Wire.
Renewals Welcome, and thank you for subscribing to the Anals of Stock Proctology. Your trial subscription will run for 90 days. At the end of that period your subscription will renew automatically, unless you cancel. If you wish to cancel your subscription use the button below. If you want to renew your subscription do nothing. Your subscription will renew and your credit card or Paypal bank account will be charged. If you want to renew, be sure your credit card information in your Paypal account is current. Paypal will not renew your subscription if the card has expired! Again, thanks for subscribing!
Explanation of Intraday Commentary-Build charts at http://www.livecharts.com. For custom time bars insert a comma after symbol and number of minutes, e.g. compx,90. This will give you a bar chart of the Nas with 90 minutes per bar. The one day cycle is usually most clear with 8 minute bars and 26/18 stochastics. It varies from day to day. Sometimes 6 minutes works best. Experiment to find the best fit for your trading style, and the market's dominant frequency at the time. The goal here is primarily to monitor the condition of the 8 and 13 day cycles. I typically use 90 minute bars with 26/18 stochastics for the 13 day cycle proxy on the indices during regular trading hours. Other cycles use 26/18 stochastics with the following: 8 days- 60 minute bars On the 24 hour futures charts, use a time per bar approximately 3 to 4 times the above number of minutes, to represent the cycles listed above. ABBREVIATIONS: cma: centered moving average
|
|||||||||||||||||||||||||||||||||||||||||||||||||||||||||||||||||||||||||||||||||||||||||||||||||||||||||||||||||||||


![[Most Recent HUI from www.kitco.com]](http://www.weblinks247.com/indexes/idx24_hui_en_2.gif)
![[Most Recent XAU from www.kitco.com]](http://www.weblinks247.com/indexes/idx24_sp500_en_2.gif)
![[Most Recent Quotes from www.kitco.com]](http://kitconet.com/charts/metals/gold/t24_au_en_usoz_2.gif)