|
Archives 12/30/01, 1/1/02, 1/2/02, 1/3/02, 1/4/02, 1/7/02, 1/8/02, 1/09/02, 1/10/02, 1/11/02, 1/14/02, 1/15/02, 1/16/02, 1/17/02, 1/18/02, 1/22/02, 1/23/02, 1/24/02, 1/25/02, 1/28/02, 1/29/02, 1/30/02, 1/31/02, 2/1/02, 2/4/02, 2/5/02, 2/06/02, 2/7/02, 2/9/02, 2/11/02, 2/12/02, 2/13/02, 2/14/02, 2/16/02, 2/19/02, 2/20/02, 2/21/02, 2/23/02, 2/25/02, 2/26/02, 2/27/02, 2/28/02, 3/1/02, 3/04/02, 3/05/02, 3/06/02, 3/7/02, 3/10/02,3/11/02, 3/12/02, 3/13/02, 3/14/02, 3/15/02, 3/18/02, 3/19/02, 3/20/02, 3/21/02, 3/22/02, 3/25/02, 3/26/02, 3/28/02, 3/30/02 4/1/02, 4/2/02, 4/3/02, 4/4/02, 4/6/02, 4/8/02, 4/9/02, 4/10/02, 4/11/02, 4/13/02, 4/15/02, 4/16/02, 4/17/02, 4/18/02, 4/20/02, 4/22/02, 4/23/02,4/24/02,4/25/02, 4/26/02, 4/27/02, 4/29/02, 4/30/02 5/01/02, 5/2/02, 5/4/02, 5/6/02, 5/07/02, 5/8/02, 5/09/02, 5/10/02, 5/13/02, 5/14/02, 5/15/02, 5/16/02, 5/17/02, 5/20/02, 5/21/02, 5/22/02, 5/23/02, 5/24/02, 5/28/02, 5/29/02, 5/30/02 6/01/02, 6/3/02, 6/4/02, 6/5/02, 6/6/02, 6/7/02, 6/10/02, 6/11/02, 6/12/02, 6/13/02, 6/14/02, 6/17/02, 6/18/02, 6/19/02, 6/20/02, 6/22/02, 6/24/02, 6/25/02, 6/26/02, 6/27/02, 6/30/02 7/1/02, 7/4/02, 7/5/02, 7/11/02, 7/14/02, 7/15/02, 7/16/02, 7/17/02, 7/18/02, 7/19/02, 7/22/02, 7/23/02, 7/24/02, 7/25/02, 7/27/02, 7/29/02, 7/30/02 8/1/02, 8/3/02, 8/5/02, 8/6/02, 8/7/02, 8/8/02, 8/10/02, 8/12/02, 8/13/02, 8/14/02, 8/15/02, 8/16/02, 8/19/02, 8/20/02, 8/21/02, 8/22/02, 8/23/02, 8/26/02, 8/27/02, 8/28/02, 8/29/02, 8/30/02 9/3/02, 9/4/02, 9/5/02. 9/6/02, 9/9/02, 9/10/02, 9/11/02, 9/12/02, 9/13/02, 9/16/02, 9/17/02, 9/18/02, 9/19/02, 9/20/02, 9/23/02, 9/24/02, 9/25/02, 9/26/02, 9/27/02, 9/30/02 10/1/02, 10/2/02, 10/3/02, 10/4/02, 10/7/02, 10/8/02, 10/9/02, 10/10/02, 10/11/02, 10/14/02, 10/15/02, 10/16/02, 10/17/02, 10/18/02
|
The Anals of Stock ProctologyPublished weeknights by
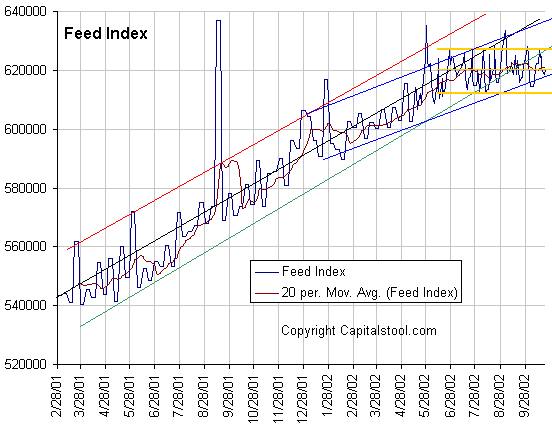
8:30PM Happy Acres, Florida Time The American Academy of Stock Proctology and Is your subscription up for renewal? If you want to renew, do nothing, unless your credit card has expired. Please be sure your credit card info is current. If your credit card has expired, you must enter the new expiration date in your Paypal account in order for your subscription to be processed. If you subscribed via Paypal, your subscription will be renewed for one year on the 90 day anniversary of your sign-up and your credit card will be charged. If you want to cancel, use the button at the bottom of the page. This applies only if you subscribed through Paypal. Mailed-in subscriptions are for 1 year. If you subscribed by prior contribution, I will send you a notice before your subscription expires. If you have any questions, see the subscription page and FAQ's. If you can't find the answer, email me. Maximum Strength Stool (10/22/02) Doc is back from vacation. So let's do some catching up on those things we missed. To sum up, the worst may be over, and the end may be nigh, but there's still no light at the end of the tunnel, as the bear shits in the woods, and we wait for the next streetcar. Going fo-wad, we expect that there will be an inflection point, and that visibility will improve, as long as you are looking backwards. That's the way the cookie crumbles. Other than that, it's still a bear market, in spite of what the poodits and analcysts would have you believe, but it's not your father's bear market. Because of increasing wave magnitude and duration variation, timing is everything! What else is new? Doc will leave you with these final thoughts. The trend is your friend. Cut your profits and let your losses run. (That one always confuses Doc. Does it confuse you too?) Don't fight the Fed, and most of all, don't fight the freaking tape... Dammit. And now, the numbers. The Feed did $2 billion in overnight repos, resulting in a net add of $2 billion because there were no rollovers. That $2 billion will expire Wednesday. There are no other expirations. The minimal addition had no impact on either the Feed Index or the Feedometer. The action over the next few days will tell us whether the Fed still wants to maintain the 8% growth channel. Three trends are evident on
the Feed Index, which is the total Fed holdings of loans and securities. One is the 10% growth trend beginning in May of 2001. Feed
growth has recently been at or below the lower boundary of that trend. The
blue channel going back to last December suggests that Al may now be
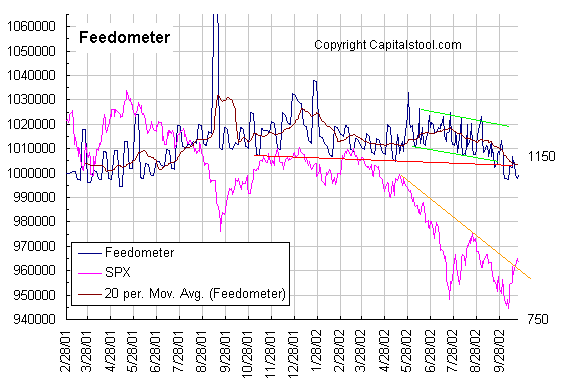
targeting an 8% growth rate. Then there's the golden box which says he's stopped growing Feed altogether over the last three months. The Feedometer still shows that Al has the markets on a starvation diet. The
Feedometer theoretically
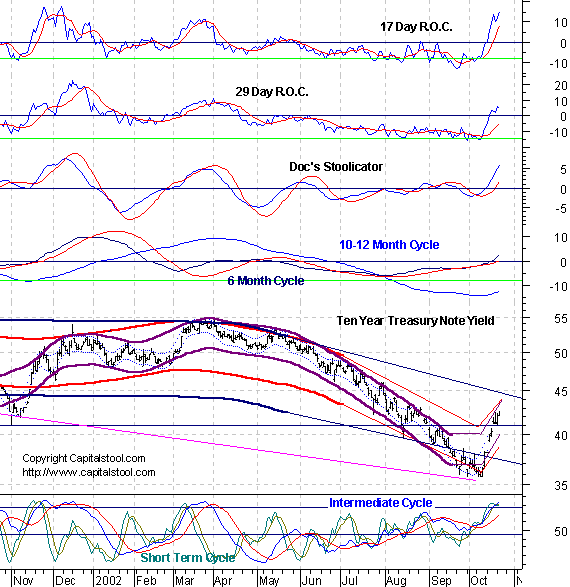
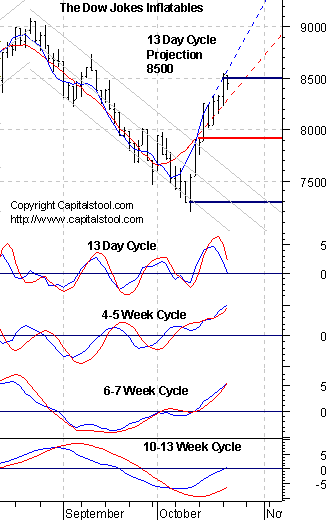
measures excess Feed available for bond or stock market jamming. Big problems in bond land continued. Up a stunning 60 bp's in 9 days. To put this in perspective, this would be like rates moving from 7% to 8.25 % in the bad old days, which may be about to return. Doc's wife, who does interior deco faux finishes, has a client who cancelled a job today because the mortgage on the new house he was about to close on blew out. Evidently he wasn't locked in. This story is the top of the iceberg and is being repeated by the thousands every day all over the country. A lot of mortgages aren't going to fund, which means that a lot of builders won't be able to pay off construction loans on schedule. There's a major credit blow up and liquidity crunch in the making. The upside cmap on the 6-7 week
cycle is 4.28. However, it seems likely that 4.50 is on the horizon in the
short run. Note that the 10-12 month cycle is just turning up from the
lows. Given that the index is already nearing the upper edge of the
2 year cycle channel (dark blue), the 2 year cycle and longer waves are
also likely to head up over the next couple of months.
All of Doc's
cycle charts
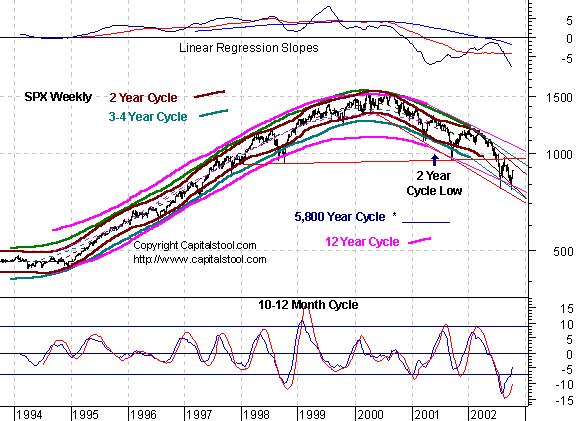
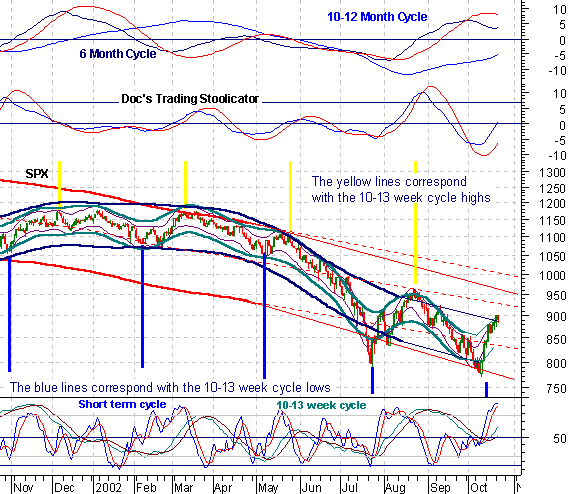
are powered by METASTOCK Portfolio Sphincters Index (SPX) and Sentiment Long Term While the whole world is fixating on the "4 year cycle low", Doc thinks it's a non-issue. Since October 1998 was a bottom, virtually everyone was expecting a 4 year low in this time frame. But bubbles are peculiar. The tsunami wave spawns atypical wave responses. The November 1929 low was at a 3 year anniversary. The next important low was in July 1932. At other times we have seen cycles run 4.5 years, or 3 years. Focusing in a 4 year low is a bad idea. Cycle lengths vary, and long term indicators do not suggest that the ultimate bear market low is at hand. The most obvious long term wave this time has been around two years in duration, and the last low was in mid 2001. So we should look for the next one around mid-year next year, give or take 3 months either way. That would also correspond with the 10-12 month cycle which bottomed in July and is now in the midst of a weak sideways up phase. This up phase shows every sign of manifesting as a broad trading range in which highs fall short of past highs and nominal new lows are made on downswings. The current rally is part of
a 6 month cycle top within the 10-12 month cycle up phase. As a result of
the rally, the downside cmaps Doc had been posting are no longer valid on
the current 5-6 month cycle. The 10-12 month cycle is headed up. Significantly
lower lows look like they will be delayed until well into next year. Sentiment and Momentum Indicators
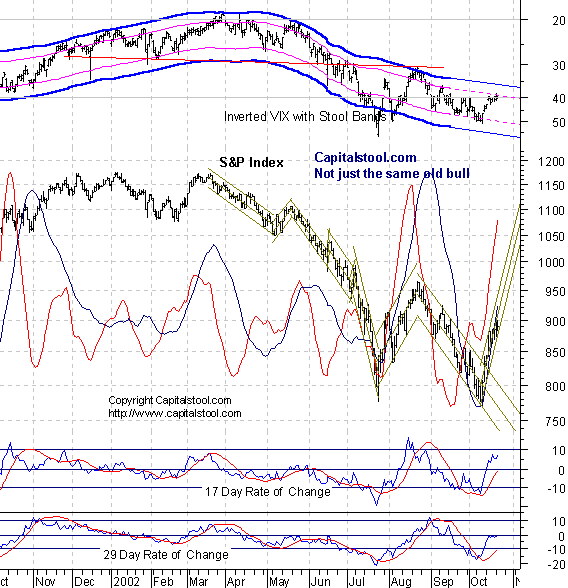
The 17 day rate of change is a proxy for the
6-7 week cycle. the 29 day rate of change is a proxy for the 10-13 week
cycle. The dark blue overlaid line is the 10-13 week cycle
oscillator, while the red line is the 6-7 week cycle oscillator. The VIX
is a measure of implied options volatility reflecting relative fear or
complacency. It is plotted below on an inverse scale to better show the
relationship to the price chart. The "Stool Bands may reflect either
6 month or 10-12 month cycles. Short Term Cycles Still no sell signals from the cycle or rate of change indicators. However, the short cycle oscillator in the chart below is in the top zone and looks ready to turn down. The down phase is likely to be shallow. The 4 and 6-7 week cycle cmaps still point to slightly higher prices but time is running out on the up phase. 10-13 Week Cycle Still up with from 1 to 3 weeks remaining. Still no upside cmap. there's too much ambiguity in the projections. VIX The VIX continues to flirt with the top zone on the inverted scale stool band chart. Cycle Chart The Cycle Conditions tables include cycle phase and a wild guess as to number of periods to the next turn, in days for the shortest cycles, weeks (W) or months (M) for the longer ones. This is a fluid exercise, in other words, the projections are likely to be wrong, but they force us to be vigilant for key turning points, and frequently work well enough to prevent costly misreadings. SPX Cycle Conditions as of 10/22/02
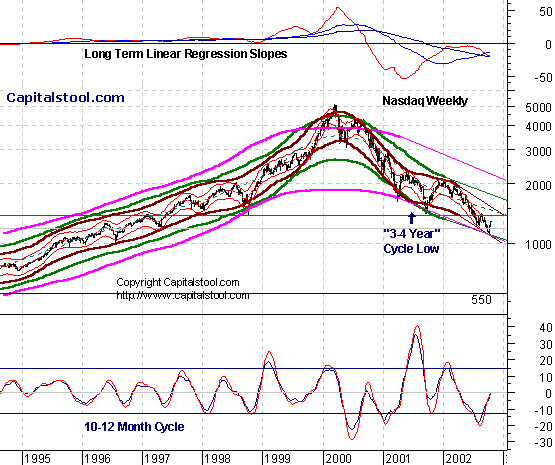
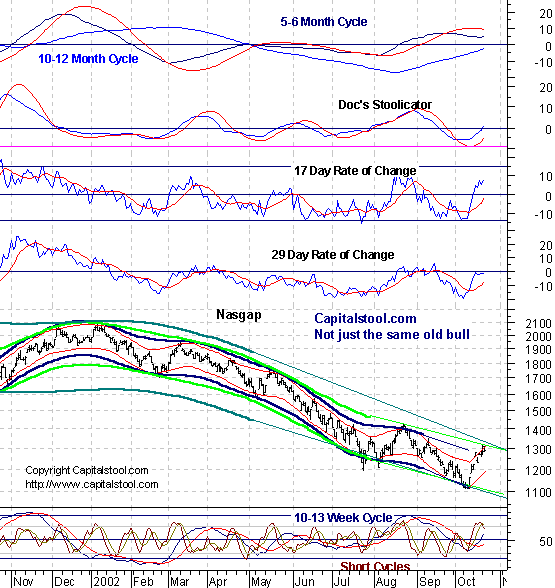
PTT - Periods Till Turn Nasgap Charts Long Term The "4 Year Cycle" looks like it bottomed last year, lasting only 3 years as a result of the influence of the tsunami bubble wave. The Nasty may actually have been in an up phase since then, with the current rally being the rigor mortis rally before the Nas heads for its ultimate price objective of negative 400. By 2007, the Nas will be the National Toilet Paper Exchange. (Assuming that this interpretation is correct, of course.) In the meantime we'll have to
grit our teeth until the current 5-6 month cycle top phase within this
10-12 month cycle sideways up phase is complete. That should be within 1
to 3 weeks. Doc doesn't think the up phase will exceed 1330-1340. Cycle Chart Short Term Cycles The 13 day cycle has hit its cmap and should be in a shallow down phase for the next 4 days. The 4 and 6-7 week cycles have cmaps of 1330-50, but that could change. Cycle highs are due within 5 days. 10-13 Week Cycle The 10-13 week cycle also apparently has a cmap of 1330 but that too could change. The up phase still has 1 to 3 weeks remaining. Nasdaq Cycle Conditions as of 10/22/02
PTT
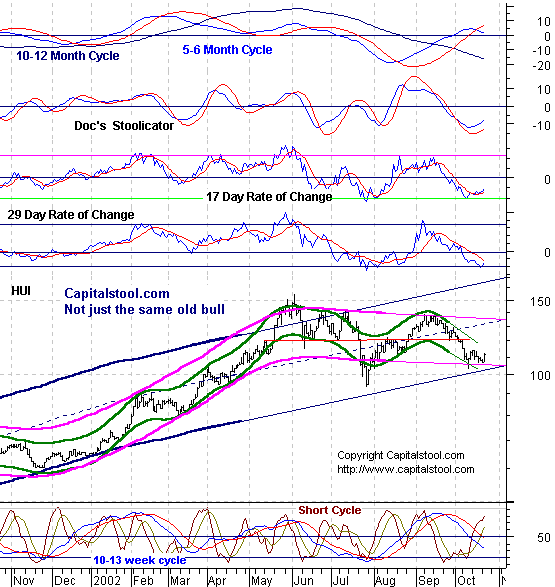
- Periods Till Turn Long Bong Hit - See top of page. AM Edition Features (Previous) These features are in morning edition, published between 7:30-8 AM ET US, or the Saturday Weak End Edition, published, uh, let's see, Saturday! Golden Stool HUI turned
yesterday. On schedule! The index double bottomed at a cyclically
appropriate time, after testing downside cmaps for cycles up to six
months. At his point the best thing for gold stock bulls to do from a
technical perspective is to keep your fingers crossed. The first order of
business is to get out of this base and move above 114. Uncle Buck's Illness
If the incipient upturn in the intermediate cycle oscillator fails, Buck
could be in trouble. Short cycle sell signal suggests a move to the low
end of the recent range. Suctor Watch and Stoolwethers- Now posted on separate page. Updated each morning between 8 AM and 9:30 AM NY time. See you in Intraday Stool. Dr. Stepan N. Stool Share your thoughts on the Stool Pigeons Wire.
Renewals Welcome, and thank you for subscribing to the Anals of Stock Proctology. Your trial subscription will run for 90 days. At the end of that period your subscription will renew automatically, unless you cancel. If you wish to cancel your subscription use the button below. If you want to renew your subscription do nothing. Your subscription will renew and your credit card or Paypal bank account will be charged. If you want to renew, be sure your credit card information in your Paypal account is current. Paypal will not renew your subscription if the card has expired! Again, thanks for subscribing!
Explanation of Intraday Commentary-Build charts at http://www.livecharts.com. For custom time bars insert a comma after symbol and number of minutes, e.g. compx,90. This will give you a bar chart of the Nas with 90 minutes per bar. The one day cycle is usually most clear with 8 minute bars and 26/18 stochastics. It varies from day to day. Sometimes 6 minutes works best. Experiment to find the best fit for your trading style, and the market's dominant frequency at the time. The goal here is primarily to monitor the condition of the 8 and 13 day cycles. I typically use 90 minute bars with 26/18 stochastics for the 13 day cycle proxy on the indices during regular trading hours. Other cycles use 26/18 stochastics with the following: 8 days- 60 minute bars On the 24 hour futures charts, use a time per bar approximately 3 to 4 times the above number of minutes, to represent the cycles listed above. ABBREVIATIONS: cma: centered moving average
|

![[Most Recent HUI from www.kitco.com]](http://www.weblinks247.com/indexes/idx24_hui_en_2.gif)
![[Most Recent XAU from www.kitco.com]](http://www.weblinks247.com/indexes/idx24_sp500_en_2.gif)
![[Most Recent Quotes from www.kitco.com]](http://kitconet.com/charts/metals/gold/t24_au_en_usoz_2.gif)