|
Archives 12/30/01, 1/1/02, 1/2/02, 1/3/02, 1/4/02, 1/7/02, 1/8/02, 1/09/02, 1/10/02, 1/11/02, 1/14/02, 1/15/02, 1/16/02, 1/17/02, 1/18/02, 1/22/02, 1/23/02, 1/24/02, 1/25/02, 1/28/02, 1/29/02, 1/30/02, 1/31/02, 2/1/02, 2/4/02, 2/5/02, 2/06/02, 2/7/02, 2/9/02, 2/11/02, 2/12/02, 2/13/02, 2/14/02, 2/16/02, 2/19/02, 2/20/02, 2/21/02, 2/23/02, 2/25/02, 2/26/02, 2/27/02, 2/28/02, 3/1/02, 3/04/02, 3/05/02, 3/06/02, 3/7/02, 3/10/02,3/11/02, 3/12/02, 3/13/02, 3/14/02, 3/15/02, 3/18/02, 3/19/02, 3/20/02, 3/21/02, 3/22/02, 3/25/02, 3/26/02, 3/28/02, 3/30/02 4/1/02, 4/2/02, 4/3/02, 4/4/02, 4/6/02, 4/8/02, 4/9/02, 4/10/02, 4/11/02, 4/13/02, 4/15/02, 4/16/02, 4/17/02, 4/18/02, 4/20/02, 4/22/02, 4/23/02,4/24/02,4/25/02, 4/26/02, 4/27/02, 4/29/02, 4/30/02 5/01/02, 5/2/02, 5/4/02, 5/6/02, 5/07/02, 5/8/02, 5/09/02, 5/10/02, 5/13/02, 5/14/02, 5/15/02, 5/16/02, 5/17/02, 5/20/02, 5/21/02, 5/22/02, 5/23/02, 5/24/02, 5/28/02, 5/29/02, 5/30/02 6/01/02, 6/3/02, 6/4/02, 6/5/02, 6/6/02, 6/7/02, 6/10/02, 6/11/02, 6/12/02, 6/13/02, 6/14/02, 6/17/02, 6/18/02, 6/19/02, 6/20/02, 6/22/02, 6/24/02, 6/25/02, 6/26/02, 6/27/02, 6/30/02 7/1/02, 7/4/02, 7/5/02, 7/11/02, 7/14/02, 7/15/02, 7/16/02, 7/17/02, 7/18/02, 7/19/02, 7/22/02, 7/23/02, 7/24/02, 7/25/02, 7/27/02, 7/29/02, 7/30/02 8/1/02, 8/3/02, 8/5/02, 8/6/02, 8/7/02, 8/8/02, 8/10/02, 8/12/02, 8/13/02, 8/14/02, 8/15/02, 8/16/02, 8/19/02, 8/20/02, 8/21/02, 8/22/02, 8/23/02, 8/26/02, 8/27/02, 8/28/02, 8/29/02, 8/30/02 9/3/02, 9/4/02, 9/5/02. 9/6/02, 9/9/02, 9/10/02, 9/11/02, 9/12/02, 9/13/02, 9/16/02, 9/17/02, 9/18/02, 9/19/02, 9/20/02, 9/23/02, 9/24/02, 9/25/02, 9/26/02, 9/27/02, 9/30/02 10/1/02, 10/2/02, 10/3/02, 10/4/02, 10/7/02, 10/8/02, 10/9/02, 10/10/02, 10/11/02, 10/14/02, 10/15/02, 10/16/02, 10/17/02, 10/18/02, 10/21/02, 10/22/02, 10/23/02, 10/24/02, 10/25/02, 10/28/02, 10/29/02, 10/30/02, 10/31/02 11/1/02, 11/4/02, 11/5/02, 11/6/02, 11/7/02, 11/8/02, 11/11/02, 11/12/02, 11/13/02, 11/14/02, 11/15/02, 11/18/02, 11/19/02, 11/20/02, 11/21/02, 11/22/02, 11/25/02, 11/26/02, 11/27/02, 11/29/02 12/2/02,
12/3/02, 12/4/02,
12/5/02 1/1/03, 1/2/03, 1/03/03, 1/6/03, 1/7/03
 Doc's view of the Street. |
The Anals of Stock ProctologyPublished weeknights by
8:30PM Happy Acres, Florida Time The American
Academy of Stock Proctology and Is your subscription up for renewal? If you want to renew, do nothing, unless your credit card has expired. Please be sure your credit card info is current. If your credit card has expired, you must enter the new expiration date in your Paypal account in order for your subscription to be processed. If you subscribed via Paypal, your subscription will be renewed for one year on the 90 day anniversary of your sign-up and your credit card will be charged. If you want to cancel, use the button at the bottom of the page. This applies only if you subscribed through Paypal. Mailed-in subscriptions are for 1 year. If you subscribed by prior contribution, I will send you a notice before your subscription expires. If you have any questions, see the subscription page and FAQ's. If you can't find the answer, email me. Doc does not make trading recommendations. This update reports time cycle estimates and centered moving average projections based on the Hurst cycle analysis method. This publication is for entertainment and educational purposes only. Doc assumes no responsibility for the accuracy or inaccuracy of the estimates and projections presented. The market may or may not meet the projections. Stoolies should thoroughly familiarize themselves with the methodology before trading based on this method. Those who do not have the time or inclination to develop a trading strategy based on testing and research should not trade. Trade at your own risk. Yadda yadda. How's your motha? PM Update 1/9/03 1:00 PM The 5 hour cycle down phase continues. Looking for the cycle low around 2 PM and a 1 day cycle low in the last hour. The 3 day cmap of 931 will come down if the current softness persists. The tentative downside cmap on the 5 hour cycle is 920. Get StoolieSignal Special offer here only! The cycle map below is an estimate of how the market might behave over the next few hours. Should the pattern be broken, the map should be redrawn to fit the actual. Cmaps and times are guidelines only. Cycles vary in wavelength and amplitude. Directional changes within an hour of the expected turn and a few points of the cmap should be respected. The indicators rule. 5-8 Day Cycle______ 2-3 Day Cycle_______ 5 Hr-1 Day Cycle
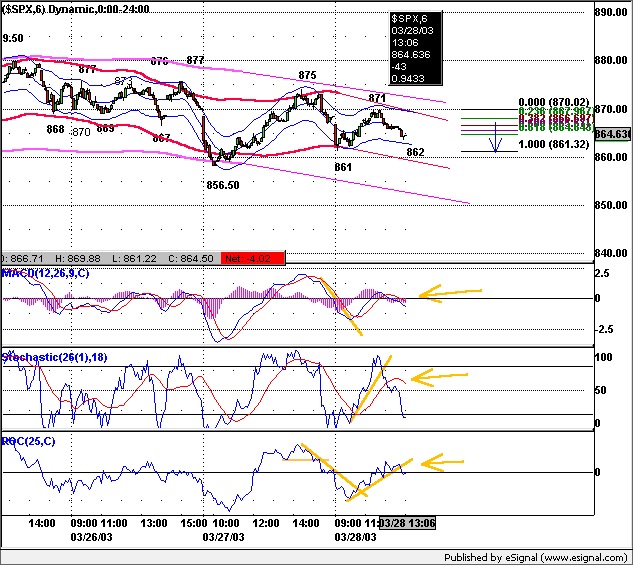
Pre Market Update 1/9/03 1:00 PM We have a little jam in the fucutures just before the open on the November unemployment claims. Another case of over reaction to ancient history. So what else is new. So far the move is within the parameters of the expectations Doc had last night. The preliminary upside cmap for the up phase is 916. Doc will be testing Stooltrading again today. Updates will be posted on the hour and half hour, and as needed, with alerts on IDS. Stooltrading will have an intraday focus. If all goes well over the next few weeks Stooltrading will be available by a variety of subscription plans from weekly to annual. Please send your feedback to Doc via private messenger on the Stool Pigeons Wire, or by email. Get StoolieSignal Special offer here only! Wednesday's
Markets Intraday - The market fell hard on the open into a 1 day low around 10 AM. The up phase was weak and died early just before noon. They spent the remainder of the day drifting lower, with no bounce off what should have been a 5 hour cycle low at 3 PM. 3 and 5 day cycle lows were due. If htye happened we don't know it yet. Could have been it at the end of the day. However, the cmaps look like 902-904. Those numbers could be hit in the AM and generate a bounce. Could also see an 8 day cycle low Turdsday, with the cmap currently looking like 898. Somewhere between 898-904 looks like shport and a good place to cover short scalps. As for going dong, against Doc's religion. he sits out the rallies. (Or tries to short them too soon, and gets squished.) The 1 day cycle low may have been in at the close. If not, it will be early tomorrow. The cmap on that is 908 which was ticked near the close. Expecting at least a small bounce through late AM. Update at 9:15 AM NY time. Get StoolieSignal Special offer here only! The cycle map below is en estimate of how the market might behave over the next few hours. Should the pattern be broken, the map should be redrawn to fit the actual. Cmaps and times are guidelines only. Cycles vary in wavelength and amplitude. Directional changes within an hour of the expected turn and a few points of the cmap should be respected. The indicators rule. 5-8 Day Cycle______ 2-3 Day Cycle_______ 5 Hr-1 Day Cycle
Uncle Buck's Butt Crack 1/8/03 Wednesday is of course, MoGauge
day. The Mortgage Bonkers Ass. released it's weekly Mortgage Applications
Index, and it it left a big stink. Was it a seasonal adjustment thing? Won't
know till next week. But if this holds, it will show up as a spike
in broader money measures in 4-6 weeks. As usual, most of the jump was in
refi's. Purchases were up, but remain in a six month downtrend. Next
week will be key. If this continue higher still, yet another round of
reflatulation is under way that will give the market a temporary boost in
March. But let's withhold judgment until next week when the numbers will not
be impacted by the holiday seasonal adjustment. Perhaps more important is the behavior of Uncle Buck today. What was that?
Over the last few days Doc has been thinking about the relationship between the Feed, via the Gang of 22, the mental institutions, and furriners. These are the three legs to the market stool, also known as the "capital stool." Doc thinks, one leg, the mental institutions are tapped out. They have minimal cash reserves, and their buying alone is not sufficient to prop up the market in the face of steady, if not increasing new supply, in the form of both bonds and stocks, including stock supply via option exercise and pubic offerings. Whatever inflows they get, they use to buy. The capital stool's second leg is the Gang of 22 (Fed primary henchmen), who take the Feed, multiply it by a factor of what? 8? 9? Whatever. They have a lot of leverage. Anyway, they multiply the Feed, and they use it to trade stocks and bonds. When stocks are good, in other words, when there's lots of suckers, they buy stocks. Now when there's not so many willing suckers, the Gang doesn't want to buy stocks so much. No one to offload to. So they buy bonds. And if the bonds aren't so good, they plow the Feed right back into short term Treasury paper, which does no one any good, and results in what is known in the vernukuler as the Feed pushing on a string. This is what they have been doing lately. In fact, they have even been shorting bonds, as evidenced by their recent gargantuan borrowings of bonds and notes from the Feed. That leaves the ROW. The ROW has had their their little fingers burnt more than a few times and more than a little bit in the last three years. As a matter of fact, they have been the Street's primary bagholders. If they decide they don't like the rules of this Wall Street - Washington carny game any more, they will take their marbles and go home. The way we know where their marbles are is too watch Uncle Buck. As long as he is acting like the sick worthless lazy old dog that he is, it doesn't matter how much Al feeds. There is no way the market can go up without the suckers buying US stocks and bonds with US dollars. Uncle Buck's dropping drawers, and exposed butt crack tells us all we need to know. In the interest allowing you to download your Anals a little earlier in the evening, Doc has made some changes to eliminate some of the redundancies which take time but add little to content. Primarily this involves presenting the Nasgap charts and data sans the commentary which adds little because it is usually a reflection of the comments in the SPX section. Be a Johnny Applestool! Help spread the Stool! Feel free to repost snippets from the Anals on message boards around the web. Just give a link back! Many tanks - Doc The Feed added $6.25 billion in overnight repos. There were no expirations. In addition to the expiring overnight repos, $3.5 billion in 3 day repos and $7 billion in 28 day repos will expire on Fed Turdsday. According to my trusty HP, that's $16.75 billion to replaced. After today's atrocious market performance, Doc doesn't doubt that they'll do it. The market is the ornery tail that wags the Feed dog. Two
trends are evident on the Feed Index, which is the total Fed holdings of
loans and securities. One is the 10% growth trend beginning in May of
2001. The blue channel going back to last December suggests an 8% growth rate. Look at the 4 week moving
average (brown line) and compare it with the slope of the tow larger
channels for an indication for whether the slope of short term growth is
slower or faster than the 2 longer term trends. Both the Feedometer's 6 month downtrend channel, and the recent uptrend is still intact. All the pumping over the last six weeks has only managed to keep the market flat. Hasn't helped the bond market either. The size of the Feed on Turdsday and the market's reaction will tell us whether the Feed has the desire to try to jam it, and whether the players will cooperate. Doc thinks the market is Fed up, and just won't take any more. The
Feedometer theoretically measures excess Feed available for bond or stock
market jamming. Al selects a trend level he feels is needed to reflatulate
the economy. The Feedometer measures the difference between the apparent
trend target, and actual day to day Feeding (Fastow Feedometer), as well
as a four week moving average (Snowmo Feedometer). A break above the
orange trendline might indicate a more aggressive jamming policy. Bond yields were down a bit.
It is still early in an apparent 13 week cycle up phase. With the 6 and 12
month cycles opposing one another, the 13 week cycle should have a
mild upward bias, but
this market could remain range bound for months. Dow Inflatables- Well, well, well. Both the 13 day
and 4 week cycle (not shown) cmaps appear to have dropped to 8800. Is that
just Doc's bias? If the Dow does no better over the next two days, the
sell signal on the 13 day ozzie will be confirmed, with 4-5 days to go. A
deep pullback would either abort the up phase in the 10-13 week cycle or
ensure that its slope is no better than flat. All of Doc's daily cycle charts
are powered by METASTOCK Portfolio Sphincters Index (SPX) and Sentiment Cycle Chart Short Term Cycles The 8-13 day cycle high is in. The preliminary downside cmap is 898 on the 8 day and 875 or so on the 13 day, the low of which isn't due until next week. The 4 and 6-7 week cycles cmaps have dropped to 935- 945. These cycles should peak from 1 to 9 days from now. The short cycle oscillator is near a top zone, and could flash a sell signal in a day or two. 10-13 Week Cycle The cycle oscillators are moving up but the upturn on the 29 day rate of change remains stalled. It's possible that the up phase began in mid-December and that the recent pop was the blowoff. We'll see. It's still too early for upside cmaps. A relatively flat week ahead would signal a flat up phase, which would be consistent with the 6 month cycle heading down, and the 10-12 month cycle topping out. It's still an "if-then" thing. The up phase could last into mid February or end as soon as next week. VIX VIX was up. (Chart scale is inverted to show relationship with prices.) The indicator is at the top of a 6 month channel that has marked previous intermediate highs and lows. However, it may be on a trend path toward the low 20s. So it's 50-50 that this was the top. Big help.
The 15 day rate of change is a proxy for the
4-7 week cycle. The 29 day rate of change is a proxy for the 10-13 week
cycle. The dark blue overlaid line is the 10-13 week cycle
oscillator, while the red line is the 6-7 week cycle oscillator. The VIX
is a measure of implied options volatility reflecting relative fear or
complacency. It is plotted below on an inverse scale to better show the
relationship to the price chart. The "Stool Bands" may reflect
either 6 month or 10-12 month cycles.
The 29 Day Dickarms never reached an extreme on the last 10-13 week cycle down
phase that would support a big move to the upside. The Cycle Conditions tables include cycle phase and a wild guess as to number of periods to the next turn, in days for the shortest cycles, weeks (W) or months (M) for the longer ones. This is a fluid exercise, in other words, the projections are likely to be wrong, but they force us to be vigilant for key turning points, and frequently work well enough to prevent costly misreadings. SPX Cycle Conditions as of 1/8/03
PTT - Periods Till Turn Nasgap Charts The Nas is expected to behave more like the SPX with the continued de-weighting of tech. In the interest of publishing the Anals earlier in the evening Doc is presenting the charts and data without commentary, as it is largely redundant relative to the SPX commentary above. Cycle Chart Nasdaq Cycle Conditions as of 1/8/03
PTT
- Periods Till Turn Long Bong Hit - See top of page. AM Edition Features (Previous) These features are in morning edition, published between 7:30-8 AM ET US, or the Weak End Edition. Golden Stool - Pog and Cousin HUI staged a recovery yesterday. When a chart
is trending up strongly, the down phase of shorter cycles will be very
shallow, sometimes to the extent of just a barely noticeable slowing in
the larger advance. The only sign that the issue is in a down phase is the
declining oscillator. Price however, either goes sideways, or continues to
advance at a slower rate while the oscillator corrects. This is what Doc
calls a sideways down phase or swdp. Swdp's usually have very bullish
implications, the exception being when the larger cycle governing the
overall movement is reaching a top phase. In that case the ensuing shorter
cycle up phase will be brief. Based on the 12 month cycle being early in
its up phase, Doc isn't worried about that. At the moment, the cmaps
project very little, if any downside in the current 6-7 week and 13 week
cycle down phases which are due to end next week. Doc is just going to
hold on through the gyrations in the expectation of pog near 400 and HUI
near 200 later this year. If anything changes, Doc will let you know
right here.
Uncle Buck's Illness Comments in the AM Edition
Suctor Watch and Stoolwethers- Now posted on separate page. Updated each morning between 8 AM and 9:00 AM NY time. See you in Intraday Stool. Dr. Stepan N. Stool Share your thoughts on the Stool Pigeons Wire.
Renewals Thank you for subscribing to the Anals of Stock Proctology. Your trial subscription will run for 90 days. At the end of that period your subscription will renew automatically, unless you cancel. If you wish to cancel your subscription use the button below. If you want to renew your subscription do nothing. Your subscription will renew and your credit card or Paypal bank account will be charged. If you want to renew, be sure your credit card information in your Paypal account is current. Paypal will not renew your subscription if the card has expired!
Explanation of Intraday Commentary-Build charts at http://www.livecharts.com. For custom time bars insert a comma after symbol and number of minutes, e.g. compx,90. This will give you a bar chart of the Nas with 90 minutes per bar. The one day cycle is usually most clear with 8 minute bars and 26/18 stochastics. It varies from day to day. Sometimes 6 minutes works best. Experiment to find the best fit for your trading style, and the market's dominant frequency at the time. The goal here is primarily to monitor the condition of the 8 and 13 day cycles. I typically use 90 minute bars with 26/18 stochastics for the 13 day cycle proxy on the indices during regular trading hours. Other cycles use 26/18 stochastics with the following: 8 days- 60 minute bars On the 24 hour futures charts, use a time per bar approximately 3 to 4 times the above number of minutes, to represent the cycles listed above. ABBREVIATIONS: cma: centered moving average |


![[Most Recent HUI from www.kitco.com]](http://www.weblinks247.com/indexes/idx24_hui_en_2.gif)
![[Most Recent XAU from www.kitco.com]](http://www.weblinks247.com/indexes/idx24_sp500_en_2.gif)
![[Most Recent Quotes from www.kitco.com]](http://kitconet.com/charts/metals/gold/t24_au_en_usoz_2.gif)