|
10 Minute Bar Charts 7/15/02 Dow Jokes Inflatables
Archives 12/30/01, 1/1/02, 1/2/02, 1/3/02, 1/4/02, 1/7/02, 1/8/02, 1/09/02, 1/10/02, 1/11/02, 1/14/02, 1/15/02, 1/16/02, 1/17/02, 1/18/02, 1/22/02, 1/23/02, 1/24/02, 1/25/02, 1/28/02, 1/29/02, 1/30/02, 1/31/02, 2/1/02, 2/4/02, 2/5/02, 2/06/02, 2/7/02, 2/9/02, 2/11/02, 2/12/02, 2/13/02, 2/14/02, 2/16/02, 2/19/02, 2/20/02, 2/21/02, 2/23/02, 2/25/02, 2/26/02, 2/27/02, 2/28/02, 3/1/02, 3/04/02, 3/05/02, 3/06/02, 3/7/02, 3/10/02,3/11/02, 3/12/02, 3/13/02, 3/14/02, 3/15/02, 3/18/02, 3/19/02, 3/20/02, 3/21/02, 3/22/02, 3/25/02, 3/26/02, 3/28/02, 3/30/02 4/1/02, 4/2/02, 4/3/02, 4/4/02, 4/6/02, 4/8/02, 4/9/02, 4/10/02, 4/11/02, 4/13/02, 4/15/02, 4/16/02, 4/17/02, 4/18/02, 4/20/02, 4/22/02, 4/23/02,4/24/02,4/25/02, 4/26/02, 4/27/02, 4/29/02, 4/30/02 5/01/02, 5/2/02, 5/4/02, 5/6/02, 5/07/02, 5/8/02, 5/09/02, 5/10/02, 5/13/02, 5/14/02, 5/15/02, 5/16/02, 5/17/02, 5/20/02, 5/21/02, 5/22/02, 5/23/02, 5/24/02, 5/28/02, 5/29/02, 5/30/02 6/01/02, 6/3/02, 6/4/02, 6/5/02, 6/6/02, 6/7/02, 6/10/02, 6/11/02, 6/12/02, 6/13/02, 6/14/02, 6/17/02, 6/18/02, 6/19/02, 6/20/02, 6/22/02, 6/24/02, 6/25/02, 6/26/02, 6/27/02, 6/30/02 7/1/02, 7/4/02, 7/5/02, 7/11/02, 7/14/02
|
The Anals of Stock ProctologyPublished weeknights by
8:30PM Happy Acres, Florida Time The American Academy of Stock Proctology and Subscription Renewals are coming up! Did you subscribe nearly 90 days ago? If you want to renew, do nothing. If you subscribed via Paypal, your subscription will be renewed automatically on the 90 day anniversary and your credit card will be charged. If you want to cancel, use the button at the bottom of the page. This applies only if you subscribed through Paypal. Mailed-in subscriptions are for 1 year. If you subscribed by prior contribution, I will send you a notice before your subscription expires. If you have any questions, see the subscription page and FAQ's. If you can't find the answer, email me. PM Update 7/16/02 12:50 PM The 1 day cycle has peaked at the revised targets posted at 11 AM. The down phase should last until 2:30. From here it looks like it will be shallow. The 3 day cycle cmaps for the upside have nearly been met, but a shallow down phase will lead to an attempt at higher highs late in the day or early tomorrow. Doc does not make trading recommendations. This update reports intraday time cycle estimates and centered moving average projections based on the Hurst cycle analysis method. Doc assumes no responsibility for the accuracy or inaccuracy of these estimates and projections. The market may or may not meet these projections. New stoolies should thoroughly familiarize themselves with the methodology before trading based on this method. There is no free lunch. Those who do not have the time or inclination to develop a trading strategy based on testing and research should not trade. Trade at your own risk. On the other hand, if you made any extra this week on account of The Stool, send it in!
AM Update 7/16/02 11:10 AM Revised cmaps for the 1 day cycle high are Nas 1405, SPX 920-25, Nas 100 1055 and Dow 8650 +/-. AM Update 7/16/02 9:25 AM Terms and methodology Yesterday afternoon's turn was apparently a 3 day cycle low that came in just a little early. It also turned the 8 and 13 day cycle ozzies on the hourly charts. So, officially, the market is in an up phase, which will almost certainly be of the sideways variety. Fucutures suggest a weak opening, but after that, look for flopping and chapping. It's too early to reliably forecast a 3 day cycle high. Yesterday may have been it, but if prices don't literally fall apart immediately we could see a higher high tomorrow. Should have a better handle after seeing the extent of this morning's pullback. Disregarding the fucutures for now, the 1 day cycle is in an up phase with a high due at 11 AM. The 5 hour cycle high was at the close. So after the opening pullback, look for a reaction high at 11 AM. Cmaps for this cycle are shown below. For the most part, they were hit at the close yesterday. The Dow's 1 day cycle cmap is 8625-50.
Your Tax Dollars At Work 7/15/02 In spite of the fact that there are some signs that, yes, Monday's action was a short term low, to Doc it just doesn't pass the smell test. It looked more like a massive buy program in a vacuum than the kind of good technical buying seen at intermediate lows in the past. Meaningful technical support for a continuation of any magnitude is simply not there. If you recall, we saw similar moves in the dollar during its recent drop when the Bank of Japan, and/or other central banks intervened. This looks like the same thing. The excuse was the Dow testing the September closing low. In reality, it probably had more to do with President Hoover's re-election chances. When he said that "the economy is fundamentally sound," that was more than an echo of the 1929-32 bear market. It was deja vu all over again, and the selloff began to accelerate. The real danger is, of course, not only a market meltdown, but a meltdown of the US economy and the entire worldwide financial system. If the Shrub administration, watching that 440 point meltdown, decided to do something about it, who can blame them? We know it will be an exercise in futility, but in the short run, it's to be expected, and we could see more of the same in the days and weeks ahead, i.e. vicious selloffs triggering vertical rallies, seemingly out of nowhere. There's no alternative but to trade with tight stops. We are getting close to an intermediate low. Assuming that was not it, it should occur at any time over the next couple of weeks. It doesn't look like there will be a great deal more downside, other than another one day panic selloff and reversal, or two. It's getting very tricky for shorts in here (ok stating the obvious). There's not enough yet to say the low is in, but it is time to stay flexible. Based on current cycle configurations, Doc's guess is that Monday was the 13 day and possibly 4 week cycle low, that we get a swup or for a few days again, then another swoon into the final low for this 6 month cycle within the next 2-4 weeks. The Feed did $4 billion in overnight repos. There were no rollovers, so all of that was a direct feed to the markets. Were there strings attached? Direct instructions from the Boss of Bosses, so to speak? While this Feed is not unusually large, on top of the steady pumping in recent weeks, it may have been enough, if strong enough hints were made to The Gang of 22. How many times have we seen the market turn at 2:30 on days of a big Feed? Too many. The total Feed is only at the
center of the recent growth path. The Feedometer suggests the Feed
still has room to pump if they have the need or inclination. They may be
in position, for a change, to begin having an influence on stock prices
with liquidity beginning to build in the pockets of both the portfolio
sphincters, and the Gang of 22.
Portfolio Sphincters Index (SPX) and Sentiment The 17 day rate of change, which represents the 6-7 week cycle, upticked slightly, but not enough to signal a reversal.. The superimposed 6-7 week cycle oscillator (red) continued to head down, suggesting that that this is a still a new 6-7 week cycle down phase following an extremely weak sideways up phase. The 29 day rate of change had a tiny uptick and remains in a downtrend. This indicator should stabilize and turn up ahead of price when the 10-13 week cycle bottoms. The 10-13 week cycle oscillator (navy) is still meandering at weak levels. A solid uptick is required to signal reversal. The VIX is now at 39.3. While some poodits, and even fellow bears, are calling that extreme, on the inverted scale chart, it is only just below the center of the Stool Band projection. This is not extreme, considering normal cyclical influences. At a major low, extreme fear readings normally persist for several days. A buy signal will not be generated until the index drops below the blue band and then reverses. At this point that will be a reading of more than 50. In truth, we won't know where the extreme is, until after it finally turns. The blue channel lines are the extension of a linear
regression channel from the February and May 2001 highs. The 6 month cycle
oscillator continues to drift lower, confirming the downtrend. The trading
stoolicator is again drifting lower. If it
doesn't uptick, no big rally. The indicator going
flat at this level signals a stable downtrend. The short cycle oscillator
downticked and remains on a sell signal. The 10-13 week cycle oscillator is
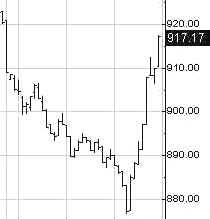
flat in negative territory, confirming that the trend remains down. The low is due
at any time over the next 17 days with a target of 832 on a closing basis.
It's important to keep in mind that it's a fluid target. How close
is close enough depends on your trading time frame. As the low is
approached, price can either move down to the projection, or the
projection can move up. Prices are testing the lower edge band of the long
term cycle. It can drop below by 50-75 points, but it also might make a
rounded low, instead of a panic selloff. Day traders can still scalp.
10-13 week cycle traders should be prepared to close positions when the
indicators for that cycle begin to turn, or when it's clear that the
downside cmaps are met. They have not done so yet. If this "rally is going
to continue, where might it stop? The recovery Monday was a 38.2% retrace
of last week's drop. The next fiber nacho regurgitation area is at 932-35. The Cycle Conditions tables include cycle phase and a wild guess as to number of periods to the next turn, in days for the shortest cycles, weeks (W) or months (M) for the longer ones. This is a fluid exercise, in other words, the projections are likely to be wrong, but they force us to be vigilant for key turning points, and frequently work well enough to prevent costly misreadings. SPX Cycle Conditions as of 7/15/02
PTT - Periods Till Turn Nasgap Charts The 10-13 week cycle oscillator and the trading stoolicator continue to look bottomish. It's not a signal until they clearly turn up. If they simply meander at these levels, the market is trending. Same thing goes for the 6 month cycle ozzie. A flat ozzie means nothing, simply a trend confirmation until the direction changes. The short cycle oscillator
is bouncing around like a jumping bean. It looks like a swup is under way.
The only way to trade the market at this point is to day trade until a new
trend is clearly established. The centered moving average projection for
the 10-13 week cycle remains 1275, but that could change. It's important
to be alert and flexible. The PPT is lurking out there at every
turn. Monday's
recovery stopped at a multiple fiber nacho reflux level. The next levels
are at 1400 and 1419. Nasdaq Cycle Conditions as of 7/15/02
PTT
- Periods Till Turn AM Edition Features (Previous) The downtrend in bond
yields is intact. The 10 year yield could drop to 4.38 or even retest the
lows of October before this is over. Recent action looks like a sideways
up phase, which means that yields could drop sharply in a final
panic that coincides with a stock market selling panic. The SOX are
in a 10-13 and 6-7 week cycle sideways up phase. 400-415 will present
formidable resistance to any further advance. There is a
market crash! Oil stocks. The 480-90 are is critical support. There's
no sign that it will hold. You'd think
with energy stocks dropping, the Transports might be doing better. NOT.
They are headed down from a huge area of distribtuion. Networkers
and other badly decimated tech groups are already in a 10-13 week cycle up
phase. Short cycles are extended and should top out here. The remainder of
the 10-13 week cycle up phase should develop into a trading range for a
few weeks before breaking down again. Is the crash
in consumer stocks over yet? Not according to the indicators on this
chart. Bonks are
approaching a level formerly known as major support. The index bounced off
cycle channel support yesterday. MMM, the
heaviest weighted stock in the Dow, is slowly but surely forming a major
top. The 113-15 area is a level formerly known as support. Don't expect
anything dramatic here. Too many mixed indications. JPM, the
stock all stoolies love to hate is in a nicely defined down phase, but
looks like it wants to start a swup. INTC is in a
swup along the bottom of its long term cycle channel. 20 is major
resistance. IBM is
another one in a swup. It could last another day, or weeks. When it's
over, look for another drop. Henceforth and forevermore, if you would like to request a "stock o'der", please post your request in Dear Dr. Stool. If you have not already registered for the message board, please do so. The only required info is user name and password which you choose yourself, and your email address, which you can keep private by selecting the keep private option. Doc looks forward to featuring your ideas. We've had some good ones! Uncle Buck's Illness
Looks like they were lowering Buck's coffin into the ground and the
harness broke. Down again this AM. The chart illustrates that the 10-13
week cycle can turn up, and prices still drop, if the bigger trend is weak
enough. The same thing may happen with stocks. The 10-13 week cycle upturn
that is due may turn out to be a complete dud. Golden Stool Gold stocks
remain in the late stages of an intermediate sideways down phase.
Indicators re conflicting. Until they get in gear the volatility within
this trading range will continue. Be on the lookout of upturns in the
10-13 week cycle indicators. That would signal a blastoff through the
highs. See you in Intraday Stool. Dr. Stepan N. Stool Let me know what you think on the Stool Pigeons Wire. Renewals Welcome, and thank you for subscribing to the Anals of Stock Proctology. Your trial subscription will run for 90 days. At the end of that period your subscription will renew automatically, unless you cancel. If you wish to cancel your subscription use the button below. If you want to renew your subscription do nothing. Your subscription will renew and your credit card or Paypal bank account will be charged. Again, thanks for subscribing!
Explanation of Intraday Commentary-Build charts at http://www.livecharts.com. For custom time bars insert a comma after symbol and number of minutes, e.g. compx,90. This will give you a bar chart of the Nas with 90 minutes per bar. The one day cycle is usually most clear with 8 minute bars and 26/18 stochastics. It varies from day to day. Sometimes 6 minutes works best. Experiment to find the best fit for your trading style, and the market's dominant frequency at the time. The goal here is primarily to monitor the condition of the 8 and 13 day cycles. I typically use 90 minute bars with 26/18 stochastics for the 13 day cycle proxy on the indices during regular trading hours. Other cycles use 26/18 stochastics with the following: 8 days- 60 minute bars On the 24 hour futures charts, use a time per bar approximately 3 to 4 times the above number of minutes, to represent the cycles listed above. ABBREVIATIONS: cma: centered moving average |
|||||||||||||||||||||||||||||||||||||||||||||||||||||||||||||||||||||||||||||||||||||||||||||||||||||||||||||||||||||||

![[Most Recent XAU from www.kitco.com]](http://www.weblinks247.com/indexes/idx24_nasdaq_en_2.gif)
![[Most Recent XAU from www.kitco.com]](http://www.weblinks247.com/indexes/idx24_sp500_en_2.gif)
![[Most Recent Quotes from www.kitco.com]](http://kitconet.com/charts/metals/gold/t24_au_en_usoz_2.gif)
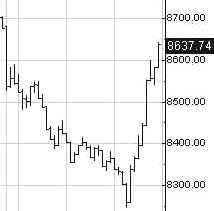
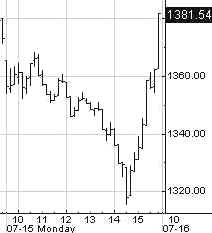
 The
Dow ended with a loss of 45 after being down nearly 445. It took 90
minutes to run up 400 points. That, ladies and germs, is the effect
of one or more massive buy programs based on the Dow testing the
September low. I'm not going to speculate about who was behind this, but
I'll simply take note of the fact that President Hoover, who has no clue,
gave a speech today, and the market reacted badly again. An awful lot was
at stake here, not the least of which is Shrub's re-election, not to
mention the welfare of the entire worldwide financial system. If the
gummit did intervene, they certainly had reason.
The
Dow ended with a loss of 45 after being down nearly 445. It took 90
minutes to run up 400 points. That, ladies and germs, is the effect
of one or more massive buy programs based on the Dow testing the
September low. I'm not going to speculate about who was behind this, but
I'll simply take note of the fact that President Hoover, who has no clue,
gave a speech today, and the market reacted badly again. An awful lot was
at stake here, not the least of which is Shrub's re-election, not to
mention the welfare of the entire worldwide financial system. If the
gummit did intervene, they certainly had reason.