|
Archives 12/30/01, 1/1/02, 1/2/02, 1/3/02, 1/4/02, 1/7/02, 1/8/02, 1/09/02, 1/10/02, 1/11/02, 1/14/02, 1/15/02, 1/16/02, 1/17/02, 1/18/02, 1/22/02, 1/23/02, 1/24/02, 1/25/02, 1/28/02, 1/29/02, 1/30/02, 1/31/02, 2/1/02, 2/4/02, 2/5/02, 2/06/02, 2/7/02, 2/9/02, 2/11/02, 2/12/02, 2/13/02, 2/14/02, 2/16/02, 2/19/02, 2/20/02, 2/21/02, 2/23/02, 2/25/02, 2/26/02, 2/27/02, 2/28/02, 3/1/02, 3/04/02, 3/05/02, 3/06/02, 3/7/02, 3/10/02,3/11/02, 3/12/02, 3/13/02, 3/14/02, 3/15/02, 3/18/02, 3/19/02, 3/20/02, 3/21/02, 3/22/02, 3/25/02, 3/26/02, 3/28/02, 3/30/02 4/1/02, 4/2/02, 4/3/02, 4/4/02, 4/6/02, 4/8/02, 4/9/02, 4/10/02, 4/11/02, 4/13/02, 4/15/02, 4/16/02, 4/17/02, 4/18/02, 4/20/02, 4/22/02, 4/23/02,4/24/02,4/25/02, 4/26/02, 4/27/02, 4/29/02, 4/30/02 5/01/02, 5/2/02, 5/4/02, 5/6/02, 5/07/02, 5/8/02, 5/09/02, 5/10/02, 5/13/02, 5/14/02, 5/15/02, 5/16/02, 5/17/02, 5/20/02, 5/21/02, 5/22/02, 5/23/02, 5/24/02, 5/28/02, 5/29/02, 5/30/02 6/01/02, 6/3/02, 6/4/02, 6/5/02, 6/6/02, 6/7/02, 6/10/02, 6/11/02, 6/12/02, 6/13/02, 6/14/02, 6/17/02, 6/18/02, 6/19/02, 6/20/02, 6/22/02, 6/24/02, 6/25/02, 6/26/02, 6/27/02, 6/30/02 7/1/02, 7/4/02, 7/5/02, 7/11/02, 7/14/02, 7/15/02, 7/16/02, 7/17/02, 7/18/02, 7/19/02, 7/22/02, 7/23/02, 7/24/02, 7/25/02, 7/27/02, 7/29/02, 7/30/02 8/1/02, 8/3/02, 8/5/02, 8/6/02, 8/7/02, 8/8/02, 8/10/02, 8/12/02, 8/13/02, 8/14/02, 8/15/02, 8/16/02, 8/19/02, 8/20/02, 8/21/02, 8/22/02, 8/23/02, 8/26/02, 8/27/02, 8/28/02, 8/29/02, 8/30/02 9/3/02, 9/4/02, 9/5/02. 9/6/02, 9/9/02, 9/10/02, 9/11/02, 9/12/02, 9/13/02, 9/16/02, 9/17/02, 9/18/02, 9/19/02, 9/20/02, 9/23/02, 9/24/02, 9/25/02, 9/26/02, 9/27/02, 9/30/02 10/1/02, 10/2/02, 10/3/02, 10/4/02, 10/7/02, 10/8/02, 10/9/02, 10/10/02, 10/11/02, 10/14/02, 10/15/02, 10/16/02, 10/17/02, 10/18/02, 10/21/02, 10/22/02, 10/23/02, 10/24/02, 10/25/02, 10/28/02, 10/29/02, 10/30/02, 10/31/02
|
The Anals of Stock ProctologyPublished weeknights by
8:30PM Happy Acres, Florida Time The American Academy of Stock Proctology and Is your subscription up for renewal? If you want to renew, do nothing, unless your credit card has expired. Please be sure your credit card info is current. If your credit card has expired, you must enter the new expiration date in your Paypal account in order for your subscription to be processed. If you subscribed via Paypal, your subscription will be renewed for one year on the 90 day anniversary of your sign-up and your credit card will be charged. If you want to cancel, use the button at the bottom of the page. This applies only if you subscribed through Paypal. Mailed-in subscriptions are for 1 year. If you subscribed by prior contribution, I will send you a notice before your subscription expires. If you have any questions, see the subscription page and FAQ's. If you can't find the answer, email me. A Time to Reap (11/5 /02) Doc can't remember a time when Wack Street had developed a more lopsided consensus. The wise men and women of the Street have somehow determined that Al will cut interest rates by 25 basis points, and if not 25 points, then he'll cut 50, by cracky! About the wisest reason Doc heard in support of this foregone conclusion was something he overheard this afternoon on Crapvision. One of the poodits said "The Fed does not want to disappoint the market." In other words, the Greenspan put. Well..... Aside from the fact that Doc thinks the G-put has expired, it makes absolutely no difference what the Fed does. The market will do what it's going to do, and what it's going to do is top out. The action or inaction of the Fed may change the shape of that top, but make-a no mistake-a Jake-a, today's the day, or Doc might just have to fade away. Doc will stick with what he wrote over the weekend. Sell the news, regardless of what it is. The players have already bought and covered heavily in anticipation of the event. There's not much dry powder out there, and the Feed has shown no inclination to supply more. Even if they cut rates as a symbolic gesture, if they don't simultaneously expand the Feed, it's a no go. What they'll get is just more of the same rationing of Feed. Every day, there's 10 times the demand for Feed as the Feed is willing to supply. So what happens if they announce that they will now supply Feed at 1.5% instead of 1.75%. Demand will increase to 15 times supply? Probably not. But it's irrelevant. Unless Al actually gives more Feed, the market will go nowhere. Doc believes that the liquidity driving this rally came both from the selling in August and from the mortgage bulge which just ended. The Fed has actually been leaning against the wind during the period of the bulge, which began in June, and just topped out. The peak of the bulge was two weeks ago, and some of those mortgages have been blown out by the rate uptick. But there's still funding that will be coming through the pipeline over the next four weeks. When those loans are held by the GSE's the money supply expands, and some of that finds its way into the market. The same mechanism fed the October - November 2001 rally. Given the market's current strength, Al may just be willing to continue sitting tight. They tend to Feed big only when the market is coming unraveled. In spite of all that mortgage credit creation, money supply growth has actually slowed in recent weeks. Faced with the sale of $40+ billion in government bonds it's going to slow even more in the weeks ahead if the Fed doesn't start buying like mad. The Fed may be saving up for the coming crisis, and maybe they will open the floodgates, but they also may be taking the attitude that they can afford to wait and see because of the market's recent strength. The thing to do over the next couple days is watch the market to see if the indicators begin to confirm the top which Doc believes is all but in. We can speculate about what the Fed will do and how the market will react until the cows come home, but it really doesn't matter if the objective is to trade for profit. It's really quite simple. All you have to do is follow the indicators. They will tell you what to do, and they will tell you in good time. Speculating about the Fed is fun, but it won't help us make money. Following the indicators will. Even if we are wrong in our speculation as to how all this will set up, and what the players will do about it, we can still preserve our capital, and even make short side profits from time to time. All it takes is a disciplined approach to technical and cyclical analysis. Follow the indicators. Don't front run, and you will be well served, no matter what the news. The Feed added $4 Billion in 2 day repos as $2 billion in overnight repos expired, for a net gain of $2 billion. There will be no expirations on Cut Day. Total Feed remains in the center of the 5 month long flat range, and at the longer term 8% growth lower channel line. If Al cuts one, he isn't telegraphing it through open market operations. He has not grown the Fed's balance sheet at all in more than 5 months. This coincides with the period in which the mortgage market has been booming. Al appears to be leaning against the tide in an attempt to keep money growth from exploding into yet another bubble with even more disastrous consequences, such as ruining his rapidly fading reputation once and for all. $23 billion in 5 year notes were auctioned Tuesday. The Treasury will sell at least $18 billion in 10 Year Notes Wednesday. This is all brand new debt ladies and germs. If the Fed isn't printing it, i.e. if they're not buying it outright, or issuing repos hand over fist to help others buy it, this is an indirect tightening. Al is worried about these growing mushroom cloud budget deficits, as well he should be. The notes will be issued on November 15. Without massive printing over the next 10 days, all markets are going to develop a very bad case of indigestion. This could be the straw that breaks the bull's back. Three trends are evident on
the Feed Index, which is the total Fed holdings of loans and securities. One is the 10% growth trend beginning in May of 2001. Feed
growth has recently been at or below the lower boundary of that trend. The
blue channel going back to last December suggests that Al may now be
targeting an 8% growth rate. Then there's the golden box which says he's stopped growing Feed altogether over the last
five months. The Feedometer is still near the bottom of its 5 month range. Al probably expects the new credit coming in from the late lamented mortgage bulge to keep things liquid. Doc thinks that's a bad bet. If they are playing a wait and see game, the markets are in for a nasty surprise over the next few days. Whether or not they cut rates doesn't matter. It's all symbolic. Printing money is what it's all about, and lately they're not printing. Doc suspects that they may only respond if the markets go into meltdown mode. The
Feedometer theoretically
measures excess Feed available for bond or stock market jamming. Bond yields
gapped higher again, and held most of the gains despite drifting lower
into the close. The 10-13 week cycle
is topping, but short cycles are bottoming and the recent highs should be
tested in short order. The 6 month
and 10-12 month cycles are heading up. Based on the fact that long term
downside cmaps were hit in September, an upturn in long term cycles should
be in the works. If the 10-13 week cycle down phase takes the form of a
trading range, look for yields to begin moving solidly higher beginning in
mid-December-January.
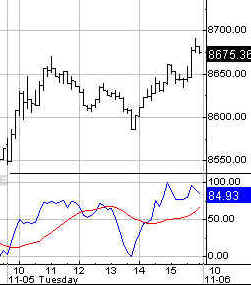
Intraday Outlook - A 5 hour high is due at the open, with a possible higher 1 day cycle high at 11 AM. The upside cmap is 920. Look for the down phase to last until approximately 12:30. Then they should start moving up again into the Feed announcement. The 3 and 5 day cycle lows are in, or near, and the 8 day cycle is still topping out. The opposed cycles may keep prices locked in a narrow range with the exception of the usual hysteria after the Feed announcement at 2:15. Once things settle down, look for more "nothing." Stay tuned for the pre-market update around 9 AM and the PM outlook around 1 PM. 5 Day Cycle______ 2-3 Day Cycle_______ 9-10 Hr Cycle_______ 5 Hr- 1 Day Cycle
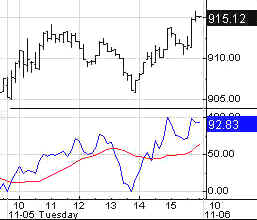
All of Doc's
cycle charts below are powered by METASTOCK Portfolio Sphincters Index (SPX) and Sentiment Sentiment and Momentum Indicators
The 17 day rate of change is a proxy for the
6-7 week cycle. the 29 day rate of change is a proxy for the 10-13 week
cycle. The dark blue overlaid line is the 10-13 week cycle
oscillator, while the red line is the 6-7 week cycle oscillator. The VIX
is a measure of implied options volatility reflecting relative fear or
complacency. It is plotted below on an inverse scale to better show the
relationship to the price chart. The "Stool Bands may reflect either
6 month or 10-12 month cycles. Short Term Cycles The 8 and 13 day cycles are supposed to be in a top, with a cap around 918. The 4 week cycle is not a factor. The 6-7 week cycle is still in a top, with the cmap now looking like 930, which was hit on Monday's buying panic. The overlaid cycle indicator is headed down and is at the point where prices should begin to follow. The 17 day rate of change has also turned down another sign that the price high is imminent. 10-13 Week Cycle This cycle is closing in on its cmap of 930-940. The top is due at any time over the next 13 days. Tops on this cycle are often marked by a couple weeks of churning following a blowoff day. We had the blowoff day. Maybe we'll get another one, maybe not. The 29 day rate of change is at a top level but must turn down to confirm. Cycle oscillators are in position to confirm a top within a day or two. VIX The VIX is in the upper sell signal band on the inverted scale Stool Bands. The bands are rising with the trend, and the best signal would come on a spike through the blue band. A break of the trend would be a sell signal confirmation. Both the 17 day and 29 day
Dickarms indexes have begun to turn at sell signal levels. These
signals may either be early or concurrent. They put us on notice that the
market is extremely overbought. The price action will tell us when it
turns. Cycle Chart Virtually everyone was expecting a 4 year low in the current time frame. But bubbles are peculiar. The tsunami wave spawns atypical wave responses. The November 1929 low was at a 3 year anniversary. The next important low was in July 1932. At other times we have seen cycles run 4.5 years, or 3 years. Focusing in a 4 year low is a bad idea, especially when the whole world expects it. Cycles vary in duration, and long term indicators do not suggest that the this was the bear market low. The most obvious long term wave this time has been approximately two years in duration, and the last low was in mid 2001. So we should look for the next one around mid-year next year, give or take 3 months either way. That would also correspond with the 10-12 month cycle which bottomed in July and is now in the midst of a sideways up phase in the range of 780 to 950. A retest of the August high is possible, but it's more likely that the current rally will fall short. The rally is part of a 6 month cycle top within the 10-12 month cycle up phase. Significantly lower lows look like they will be delayed until well into next year. 925 and 960 are areas of heavy resistance. The Cycle Conditions tables include cycle phase and a wild guess as to number of periods to the next turn, in days for the shortest cycles, weeks (W) or months (M) for the longer ones. This is a fluid exercise, in other words, the projections are likely to be wrong, but they force us to be vigilant for key turning points, and frequently work well enough to prevent costly misreadings. SPX Cycle Conditions as of 11/5/02
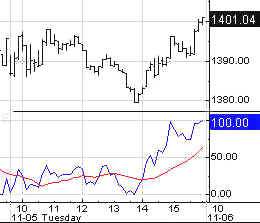
PTT - Periods Till Turn Nasgap Charts Cycle Chart Short Term Cycles The 8 and 13 day cycles are at the cmap of 1400-1440 with a top phase due. The 6-7 week cycle cmap rose again, this time to 1410, which it hit on Monday. The 17 day rate of change fell, but did not flash a sell signal. The signal appears to be imminent. A double top or negative divergence normally precedes the price turn, however. 10-13 Week Cycle The 10-13 week cycle cmap stayed pointed at 1390. Price has blown the top of the major trend channel. That's usually what happens at an overextended top. It looks like an exhaustion move, but we won't know for sure until it turns and the indicators confirm. That could still take a few days. The "4 Year Cycle" looks like it bottomed last year, lasting only 3 years as a result of the influence of the tsunami bubble wave. The Nasty may actually have been in a 3-4 year cycle up phase since then, with the current move being the rigor mortis rally before the Nas heads for its ultimate price objective of negative 400. Note that as the 10-12 month cycle oscillator has moved up, the market has moved sideways in a range of 1400 to 1100. The top could form in that cycle at any time over the next month or two. By 2007, when a 12 year low is due, the Nas will be the National Toilet Paper Exchange. There is massive resistance above current levels. The going will get a lot tougher from here. Nasdaq Cycle Conditions as of 11/5/02
PTT
- Periods Till Turn Long Bong Hit - See top of page. AM Edition Features (Previous) These features are in morning edition, published between 7:30-8 AM ET US, or the Saturday Weak End Edition, published, uh, let's see, Saturday! Golden Stool HUI hit the
upside cmap of 120 for shorter cycles. It's still a little early for a
reliable 10-13 week cmap, but on a preliminary basis it looks like 130 in
late November. Uncle Buck's Illness
Buck moved up overnight and was trading at 106.20 at 6:40 AM, and it looks
like the rally has run out of gas. It bounced off 105.75 yesterday, the
bottom of the 10-12 month cycle channel, as the short cycle ozzie turned
up. We'll have a better idea of whether the 10-12 month cycle channel is
turning down after this short cycle up phase. If it's weak, the next
important move should be a major breakdown.. Suctor Watch and Stoolwethers- Now posted on separate page. Updated each morning between 8 AM and 9:30 AM NY time. See you in Intraday Stool. Dr. Stepan N. Stool Share your thoughts on the Stool Pigeons Wire.
Renewals Welcome, and thank you for subscribing to the Anals of Stock Proctology. Your trial subscription will run for 90 days. At the end of that period your subscription will renew automatically, unless you cancel. If you wish to cancel your subscription use the button below. If you want to renew your subscription do nothing. Your subscription will renew and your credit card or Paypal bank account will be charged. If you want to renew, be sure your credit card information in your Paypal account is current. Paypal will not renew your subscription if the card has expired! Again, thanks for subscribing!
Explanation of Intraday Commentary-Build charts at http://www.livecharts.com. For custom time bars insert a comma after symbol and number of minutes, e.g. compx,90. This will give you a bar chart of the Nas with 90 minutes per bar. The one day cycle is usually most clear with 8 minute bars and 26/18 stochastics. It varies from day to day. Sometimes 6 minutes works best. Experiment to find the best fit for your trading style, and the market's dominant frequency at the time. The goal here is primarily to monitor the condition of the 8 and 13 day cycles. I typically use 90 minute bars with 26/18 stochastics for the 13 day cycle proxy on the indices during regular trading hours. Other cycles use 26/18 stochastics with the following: 8 days- 60 minute bars On the 24 hour futures charts, use a time per bar approximately 3 to 4 times the above number of minutes, to represent the cycles listed above. ABBREVIATIONS: cma: centered moving average
|

![[Most Recent HUI from www.kitco.com]](http://www.weblinks247.com/indexes/idx24_hui_en_2.gif)
![[Most Recent XAU from www.kitco.com]](http://www.weblinks247.com/indexes/idx24_sp500_en_2.gif)
![[Most Recent Quotes from www.kitco.com]](http://kitconet.com/charts/metals/gold/t24_au_en_usoz_2.gif)