|
Archives 12/30/01, 1/1/02, 1/2/02, 1/3/02, 1/4/02, 1/7/02, 1/8/02, 1/09/02, 1/10/02, 1/11/02, 1/14/02, 1/15/02, 1/16/02, 1/17/02, 1/18/02, 1/22/02, 1/23/02, 1/24/02, 1/25/02, 1/28/02, 1/29/02, 1/30/02, 1/31/02, 2/1/02, 2/4/02, 2/5/02, 2/06/02, 2/7/02, 2/9/02, 2/11/02, 2/12/02, 2/13/02, 2/14/02, 2/16/02, 2/19/02, 2/20/02, 2/21/02, 2/23/02, 2/25/02, 2/26/02, 2/27/02, 2/28/02, 3/1/02, 3/04/02, 3/05/02, 3/06/02, 3/7/02, 3/10/02,3/11/02, 3/12/02, 3/13/02, 3/14/02, 3/15/02, 3/18/02, 3/19/02, 3/20/02, 3/21/02, 3/22/02, 3/25/02, 3/26/02, 3/28/02, 3/30/02 4/1/02, 4/2/02, 4/3/02, 4/4/02, 4/6/02, 4/8/02, 4/9/02, 4/10/02, 4/11/02, 4/13/02, 4/15/02, 4/16/02, 4/17/02, 4/18/02, 4/20/02, 4/22/02, 4/23/02,4/24/02,4/25/02, 4/26/02, 4/27/02, 4/29/02, 4/30/02 5/01/02, 5/2/02, 5/4/02, 5/6/02, 5/07/02, 5/8/02, 5/09/02, 5/10/02, 5/13/02, 5/14/02, 5/15/02, 5/16/02, 5/17/02, 5/20/02, 5/21/02, 5/22/02, 5/23/02, 5/24/02, 5/28/02, 5/29/02, 5/30/02 6/01/02, 6/3/02, 6/4/02, 6/5/02, 6/6/02, 6/7/02, 6/10/02, 6/11/02, 6/12/02, 6/13/02, 6/14/02, 6/17/02, 6/18/02, 6/19/02, 6/20/02, 6/22/02, 6/24/02, 6/25/02, 6/26/02, 6/27/02, 6/30/02 7/1/02, 7/4/02, 7/5/02, 7/11/02, 7/14/02, 7/15/02, 7/16/02, 7/17/02, 7/18/02, 7/19/02, 7/22/02, 7/23/02, 7/24/02, 7/25/02, 7/27/02, 7/29/02, 7/30/02 8/1/02, 8/3/02, 8/5/02, 8/6/02, 8/7/02, 8/8/02
|
The Anals of Stock ProctologyPublished weeknights by
8:30PM Happy Acres, Florida Time The American Academy of Stock Proctology and Is your subscription up for renewal? If you want to renew, do nothing, unless your credit card has expired. Please be sure your credit card info is current. If your credit card has expired, you must enter the new expiration date in your Paypal account in order for your subscription to be processed. If you subscribed via Paypal, your subscription will be renewed for one year on the 90 day anniversary of your sign-up and your credit card will be charged. If you want to cancel, use the button at the bottom of the page. This applies only if you subscribed through Paypal. Mailed-in subscriptions are for 1 year. If you subscribed by prior contribution, I will send you a notice before your subscription expires. If you have any questions, see the subscription page and FAQ's. If you can't find the answer, email me. PM Update 8/12/02 12:45 PM Terms and methodology The 1 day cycle up phase is under way. Now looking for a high in that cycle by 1:00 (5 hour basis) and 2:30-2:45. The 8 day cycle has begun to rollover. The upside cmaps have moved down, appearing to confirm that the top is in. It's too early for downside cmaps. The crowd tends to quiet down leading up to the FOMC circus. Could be, not much happens form here until tomorrow at 2:15. Stay tuned. Doc does not make trading recommendations. This update reports intraday time cycle estimates and centered moving average projections based on the Hurst cycle analysis method. Doc assumes no responsibility for the accuracy or inaccuracy of these estimates and projections. The market may or may not meet these projections. New stoolies should thoroughly familiarize themselves with the methodology before trading based on this method. There is no free lunch. Those who do not have the time or inclination to develop a trading strategy based on testing and research should not trade. Trade at your own risk.
AM Update 8/12/02 9:45 AM Terms and methodology Revised cmaps based on opening trading on the 1 day cycles are Nas 1282-85, SPX 892, NDX 918. Next update around 12:30 unless major change intervenes. AM Update 8/12/02 9:00 AM Terms and methodology Friday's 1 day cycle high came late, but the down phase would be short if recent patterns hold and the 8 day cycle is still up. If those longer cycles still have a positive slope the low should come by 10:30 AM. If it comes later, it's a good bet that longer cycles are topping out, and may be shifting toward a neutral configuration, with equal length up and down legs. That would indicate the rally is running out of gas. But Doc is getting ahead of himself. The fucutures are very weak. The AM cmaps for the 1 day cycle are based on the futures for the SPX, and consider both the market action Friday, and the futures on the Nas. There's still a chance that the 8 day cycle upside cmaps can be hit in the up phases of the intraday cycles, highs of which would be due between 11:30 and 1:30. But at this point, the bulls need a miracle. The question now, as I raised on the message board last night, is whether what looked like a trend change was simply the result of a dramatic jump in volatility. We could get the answer today and tomorrow.
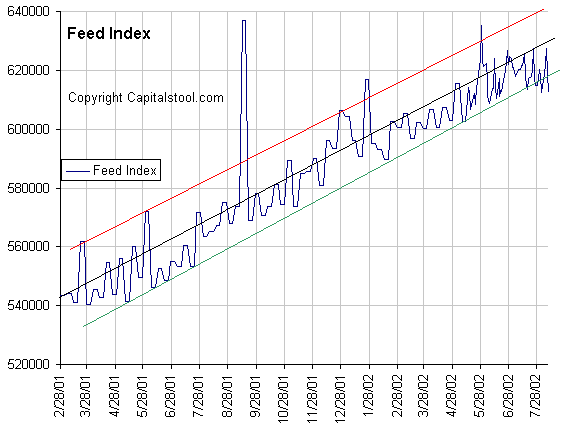
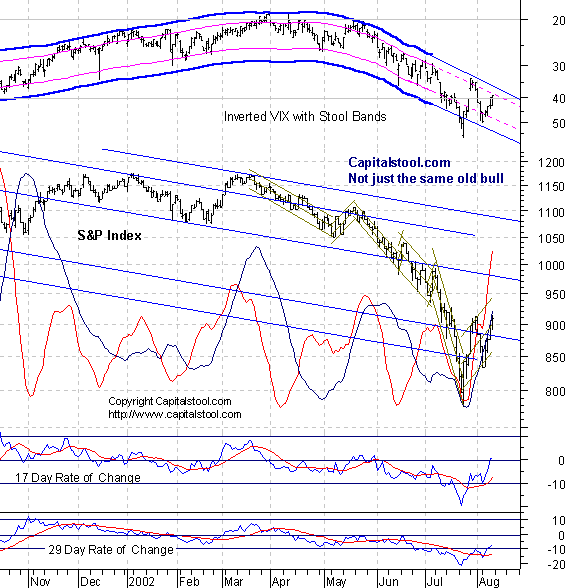
The Market Is The Message (8/10/02) Cyclicality has turned favorable in the last few weeks as the six month cycle people exhausted their selling. Massive liquidity injections by the Feed through the summer gave the Gang of 22 a whoopee cushion to sit on, and they are doing it now to stimulate demand for stocks. During the early summer liquidity build, they had stepped aside in the stock market, making massive bond purchases instead. Along with the mental institutions shifting portfolios out of stocks and into bonds, that sent bond yields crashing. Plummeting bond yields, in turn reflatulated the mortgage bubble. M3 growth has begun to kick up dramatically as a result and will continue to do so for at least another 6 weeks due to the enormous mortgage application bulge now in the pipeline. (See Thursday's charts and discussion.) As the mortgages are funded, the money flows into money market funds and M3 balloons. M1 had been moribund for months, but the explosion in M3 is now beginning to pull M1 up along with it. Some of the new money is flowing into bank accounts. The banking system is also explosively growing consumer credit lines. The entire system is reliquifying, putting a gaint wad into into the pockets of the Gang of 22 and the banking system in general. Now what are they doing with some of that extra stash? Why, they're buying stocks, obviously! What the hell else do you expect them to do with it?. Bankers and traders are human. Money burns a hole in their pockets, just like it does you and me. Their dumbass models are telling them that stocks are undervalued. So they're buying hoping to suck everyone else in yet again. This could go on for awhile. But sooner or later the wheels will fall off this rickety financial system as it weaves violently to and fro. Al almost certainly sees big inflationary portents in the growing tidal wave of credit coming at us on the horizon. He has begun to lean into the wind. (or probably piss into the wind.) What the outcome of this monetary explosion will be, Doc doesn't pretend to know. The market will weave the story one day at a time. In the end the market is the message. The Feed allowed $5.25 billion in overnight repos to expire and took in another $1 billion in weekend matched sale purchase agreements, for a net drain of $6.25 billion, Friday. The $1 billion in MSP's will come back on Monday, unless the action is repeated. Is there any doubt now that Al is tightening the belt? He gave minimal support to the Treasury auctions, and for the second week in a row actively drained reserves over the weekend. The total Feed Index is now well below the 10% growth trend. Doc believes that Al sees that sees the coming blizzard of money and credit and wants to try to head off a hyperinflationary disaster. The evidence clearly suggests that the Fed will not cut rates. The next move will be an increase.
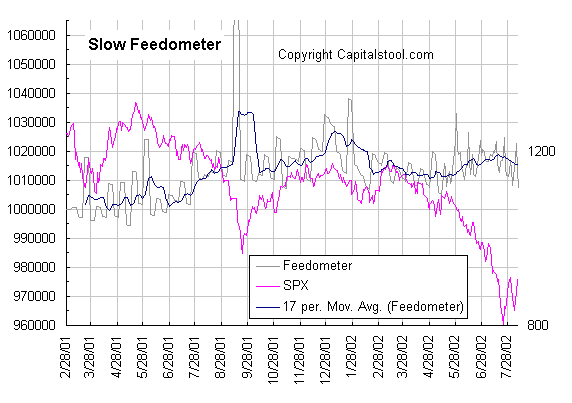
The tightening
can be seen even more vividly in the Slow Feedometer. There's already
enough liquidity in the system to support the market and everything else.
The world is awash in a tidal wave of dollars. The market's action the
last few weeks speaks for itself. For months, the Gang of 22 refused to
put the excess liquidity to work in stocks as their customers were
pounding them with a flood of sell orders. Or perhaps they tried but the
force of institutional selling was simply too great. Still, there's enough
excess there now to drive prices up for awhile yet, as cycles up to six
months have turned favorable. Sellers have done most of the selling they're
going to do, so prices rise. In time those sellers will return.
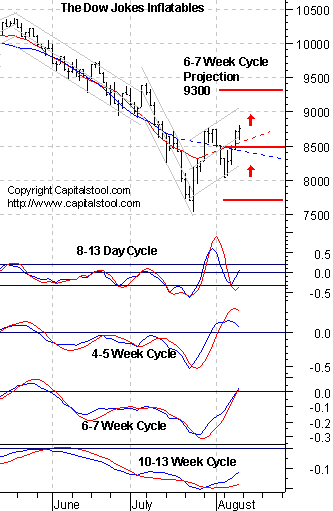
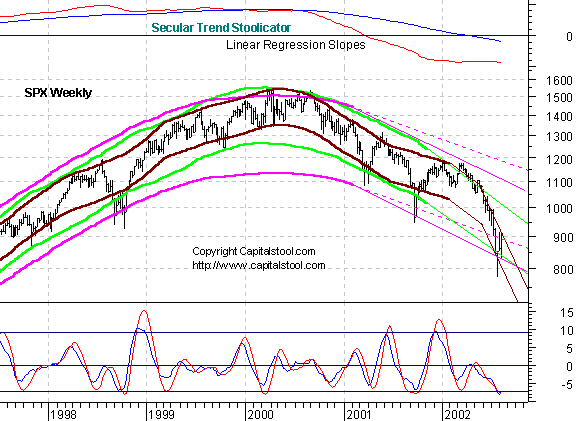
Portfolio Sphincters Index (SPX) and Sentiment
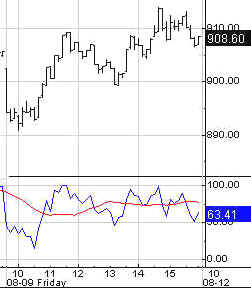
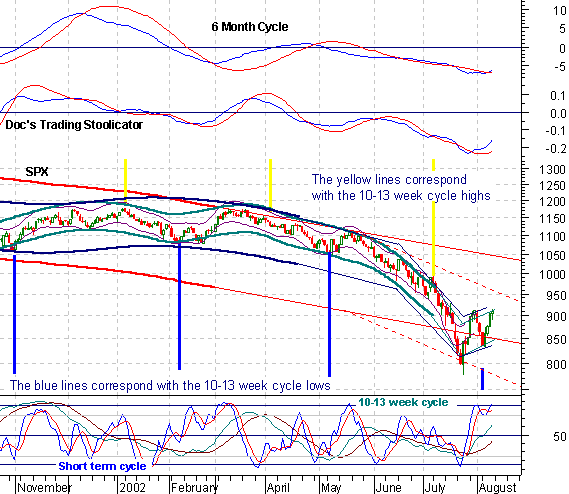
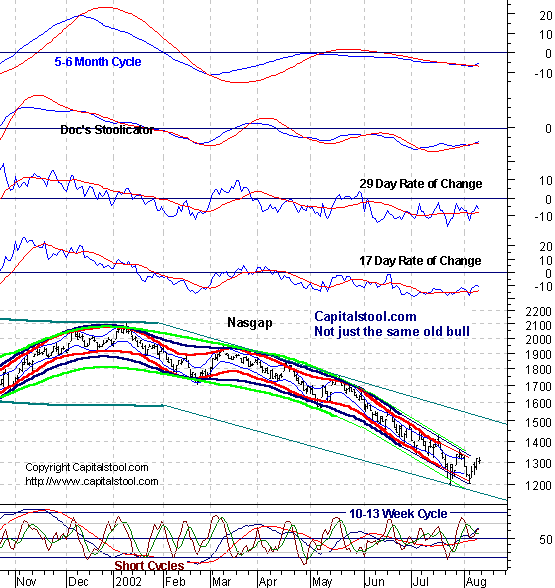
All cycles from 8 days to 6 months looks to be in gear to the upside. That doesn't mean the up phase has to half the six months, or more. It could, but at this point it's impossible to say. If the thrust dies over the next couple days, the upside could take the shape of a trading range. For now it looks like the slope will be only mildly positive, unless we see a tremendous breakout this week. The VIX fell to 39.36. In retrospect, the late July spike looks like a good low for the 6 month cycle. Further confirmation will come when the channel begins to turn sideways. The 17 and 29 day rate of
change indicators which represent the 6-7 and 10-13 week cycles are
confirming the upturn. If they get above the zero line the move
could be explosive. If they don't this rally will die early and the market
will settle into a range. Cmaps now point to highs of 960 to 980 in the next couple of
weeks. It's very early. These projections are not carved in stone and
could easily shift either way. We are still on the cusp of the turn and
whether buyers or sellers hold the balance of power is still uncertain. The 6
month cycle indicator is starting to confirm the turn.
Whipsaws happen, but this is a smooth indicator that doesn't shift easily.
The upward
bias should last at least a month or two, but we don't know what the slope
of the trend looks like yet. The 6 month cycle oscillator is starting to turn up. The trading stoolicator is strengthening. Keep in mind that when the indicators are this far below zero, an upturn does not necessarily mean an actual upturn in the trend. It may only be a marked slowing in the downtrend. the increased volatility makes the reading all the more difficult. Is it the volatility or the trend change that's moving the market higher. We should know in a day or three. The short cycle oscillator looks like it's topping out, but in the
initial stage of the 6 month cycle up phase, it can stay high for days. Don't
put too much on the overbought position of that indicator. Shorting
this market, on anything other than an intraday scalp with protection,
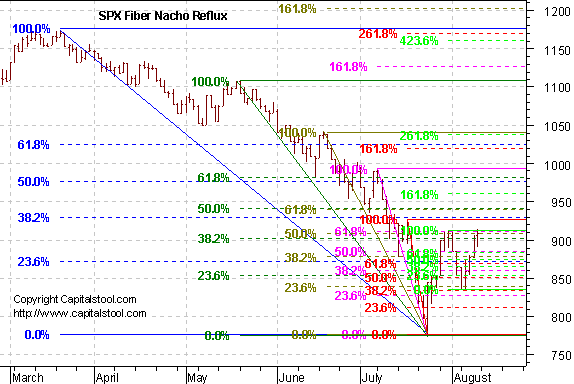
could still be hazardous to your health. The 910 fiber nacho reflux
stopped the market in its tracks. If it gets through it, next is 930, then 940. On the long term weekly chart
it also looks like the 6 month cycle low is forming. What isn't clear is
what form the up phase will take. A clear breakout above 920 should lead
to a sharp up phase that approaches 1000. Churning in the low 900- high
800 area would signal a sideways up phase that could last months and
months. Doc suspects Number 2. This is after all, Stock Proctology. Stock
Proctology... Number 2.... get it? The Cycle Conditions tables include cycle phase and a wild guess as to number of periods to the next turn, in days for the shortest cycles, weeks (W) or months (M) for the longer ones. This is a fluid exercise, in other words, the projections are likely to be wrong, but they force us to be vigilant for key turning points, and frequently work well enough to prevent costly misreadings. SPX Cycle Conditions as of 8/9/02
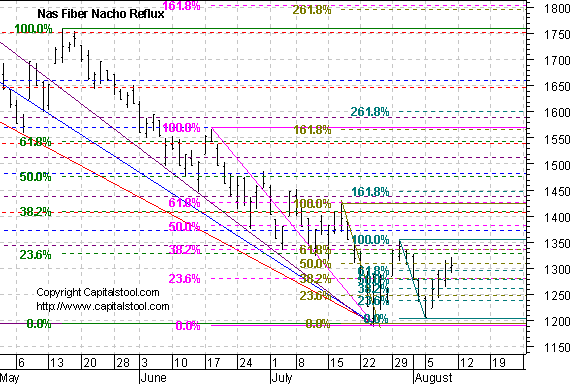
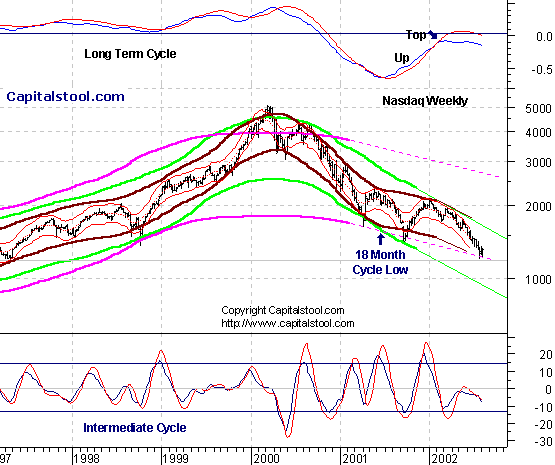
PTT - Periods Till Turn Nasgap Charts The Nas sputtered Friday as it approached downtrending cycle channel projections. The 6 month cycle oscillator is starting to confirm the turn but the upturns in shorter oscillators are weak or nonexistent.
The 10-13 week cycle oscillator says the Nas is in a swup and it's already
flattening out. Cmaps are pointing to the 1335-55 area, but it is early
and those will change. The 6 month cycle low cmap has moved up to 1150. That hasn't
been met, and it may not be. However, if this rally fails near term, that would be the target for the
final low on this 6 month cycle. Lie the SPX the Nas sits on the
cusp, only it is weaker and less like to participate in the rally should
it continue.
1328-45 is an area of heavy fiber nacho reflux activity. But first it has
to get through 1310.
The Nasty is sitting on the bottom of its secular trend channel
projection, and in the middle of the downtrending 4 year cycle, for which
a low is due any time. This is a no-decision for the time being.
Probability slightly favors an intermediate up phase beginning soon, but
it may show up as a trading range. Nasdaq Cycle Conditions as of 8/9/02
PTT
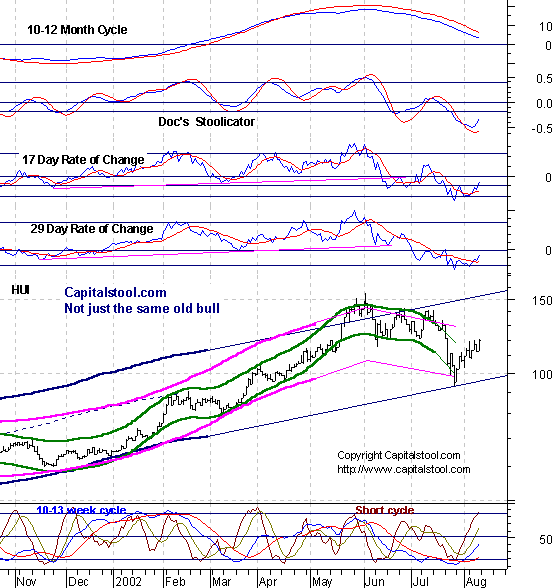
- Periods Till Turn Golden Stool The 4 week cycle cmap on HUI is now
137, with the cycle high due this week. The 6-7 and 10-13 week cycles are
also headed up. The 10-12 month cycle oscillator can be
expected to lag the price turn. We want to see it begin to flatten in the
area of the zero line then gradually turn up. The higher the level of the
trough in that indicator, the more bullish the implications. If we see a
positive crossover above the zero line, gold stocks are in for an extended
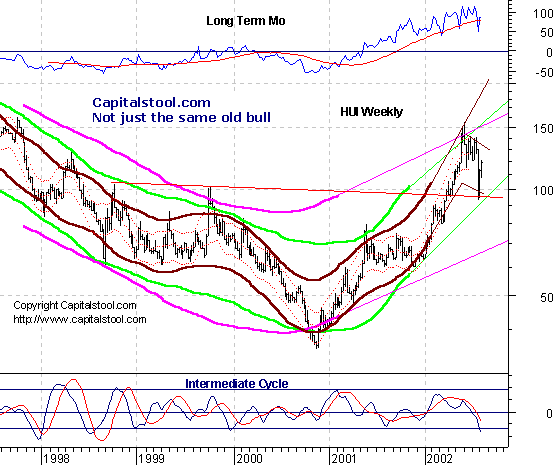
and powerful advance. Pretty chart if you're a gold stock bull! HUI's selloff
was a classic return to the scene of the crime, i.e. where it made it's
breakout. Upside, the next test of the trend's strength will come as it
approaches 130. The long term
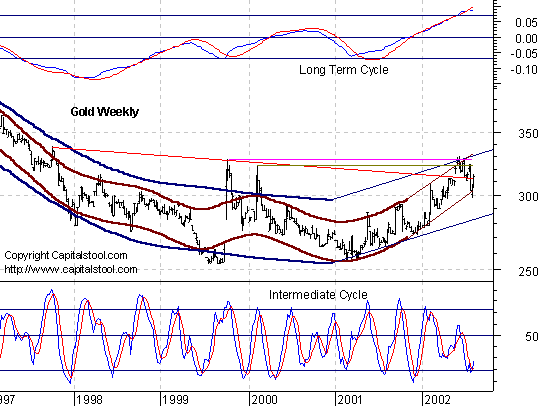
chart of the metal itself is a fi-i-ine looking chart. The long term trend
is up. The intermediate oscillator just gave a buy signal off the bottom
of an ascending channel. Doc will be disappointed if Gold doesn't break
out above 330 and turn the long term channels up more sharply. AM Edition Features (Previous) These features are in morning edition, published around 9 AM ET US, or the Saturday Weak End Edition, published, uh, let's see, Saturday! We're still waiting for the
signal. Will it be hyperinflation, or deflationary collapse? An upturn is
due. The answer may lie in the strength of that upturn. No answer yet from the
weekly chart either. We'll have to reserve judgment until we see the
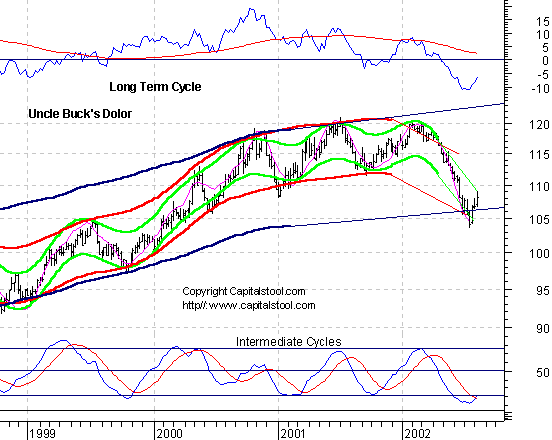
upturn. Uncle Buck's Illness Uncle Buck
is old, sick and tired. He'll limp along here for a little while, and may
even bounce a bit, as his government nurses push him along in his
wheelchair. Suctor Watch - Doc handicaps the long term charts. Bonkers-
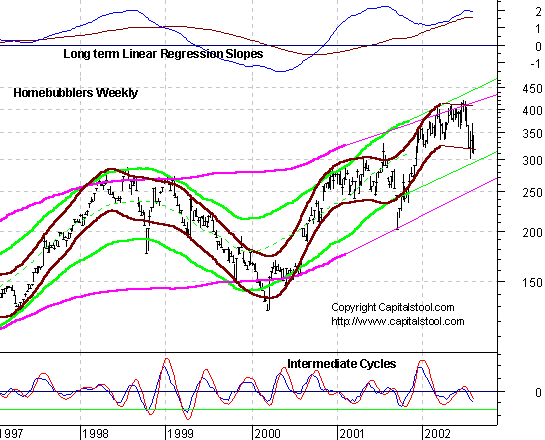
Intermediate up phase ahead. Swup or spike? Housing
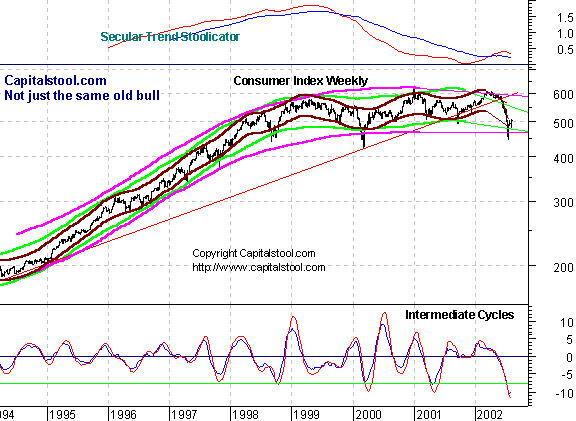
Bubble Builders- Getting ready to blow again. Con-sumer
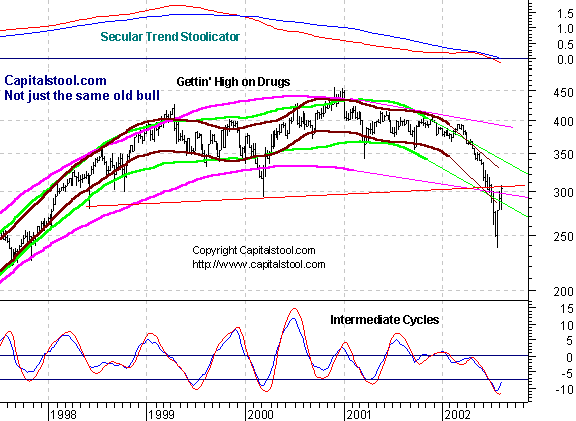
Index- The wayback viewer says not much downside for the next few months. Druggies
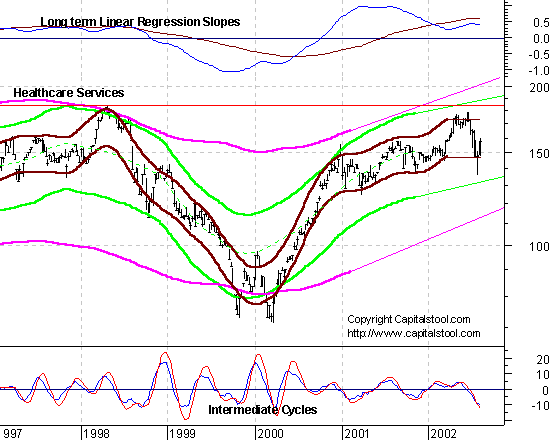
have returned to the scene of the crime, and may steal more. Healthcare
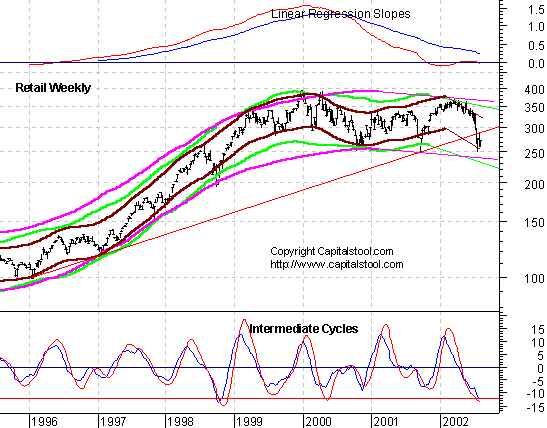
Services- Look for a wild ride as HMO's top out long term. Retail-
Wayback viewer say return to scene of crime is due off intermediate low
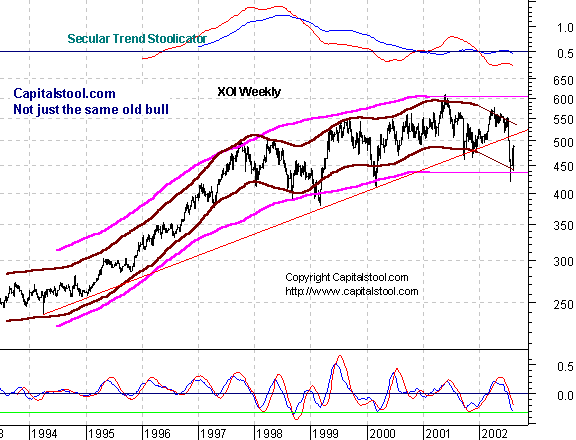
soon. Energy-
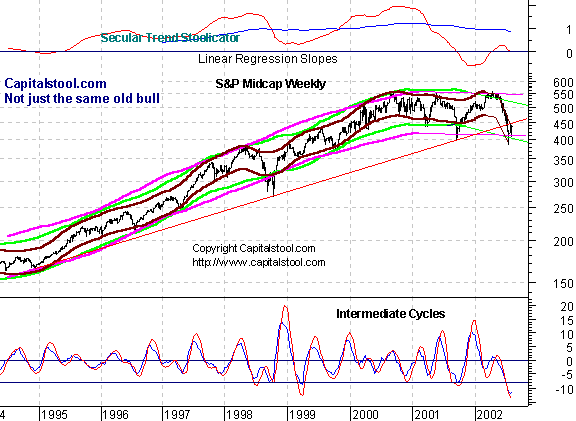
Wayback viewer sees sexular top but intermediate return to scene of crime. Mid-Crap-
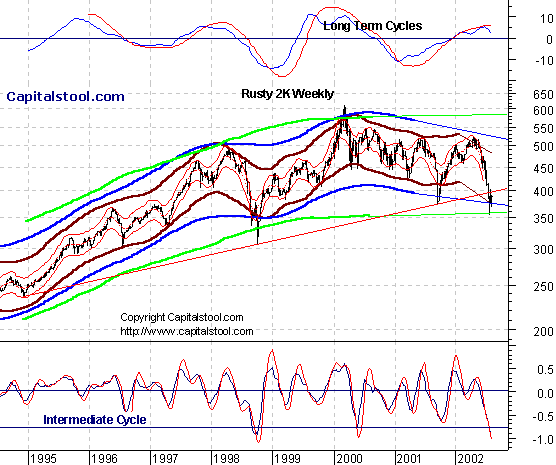
Wayback viewer sees intermediate low but no getup and go. Small Crap-
Long Term Toppy, intermediate choppy. Tech- Still
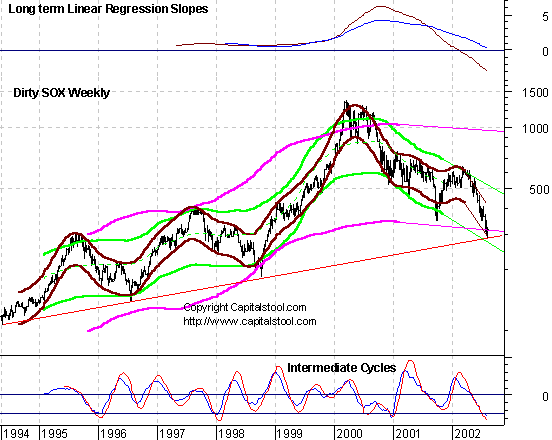
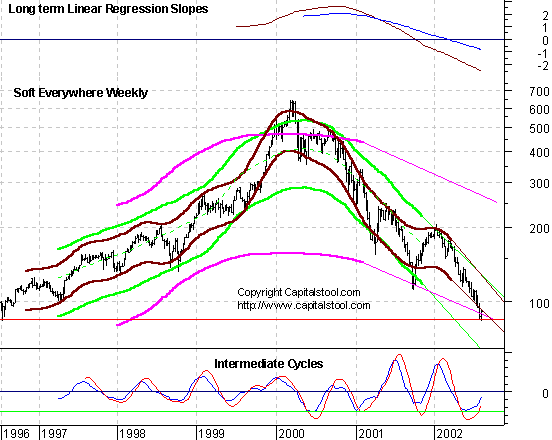
sick. SOX will try rebound soon or fall off cliff. Soft Where Everywhere-
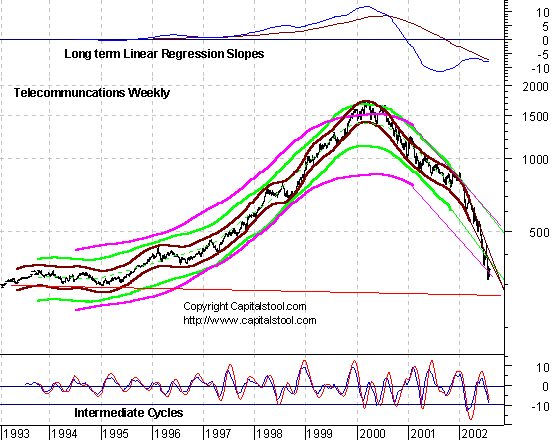
No rally in intermediate up phase. Crash may be coming. Telecom
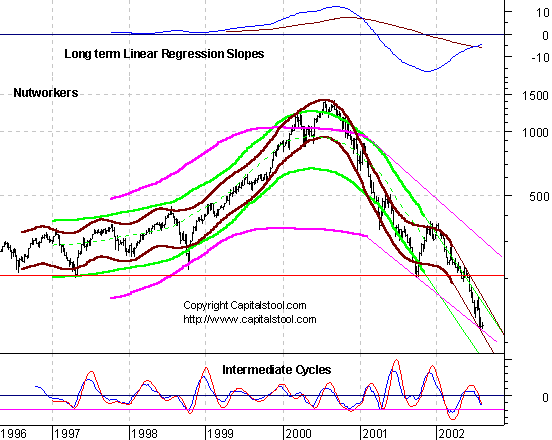
corpses may yet dive to 275. Nutworkers-
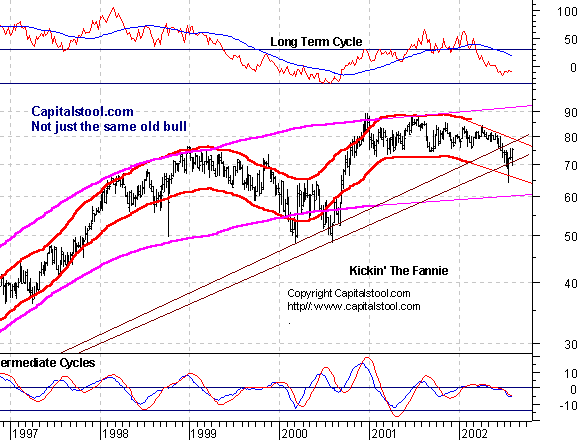
Most widely recommended in the late 90s. Now almost no nuts. Fannie- Not
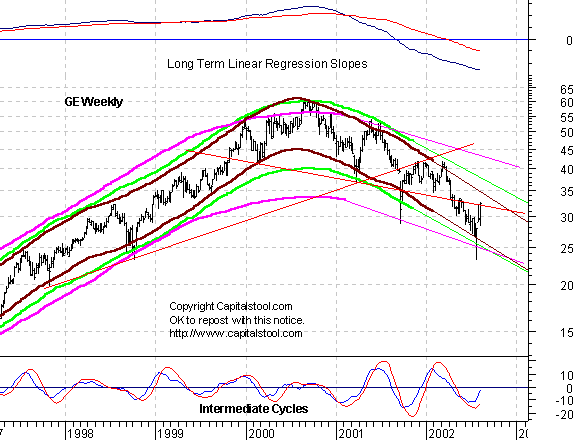
ready to give it up. General
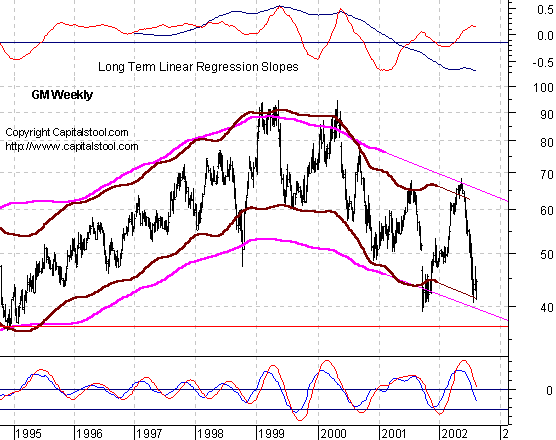
Custer takes too much Viagra. Will have heart attack later. General Cash
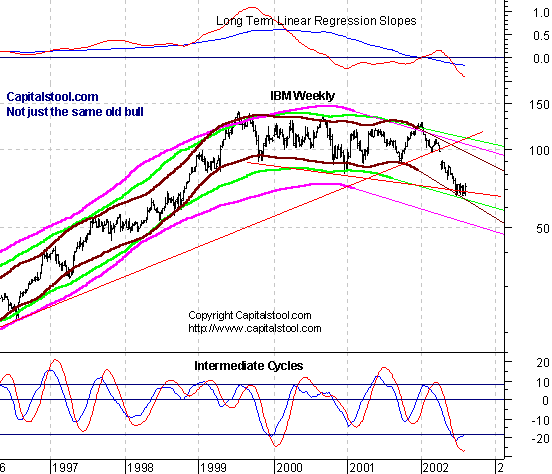
for Titles can't pass gas. Ate too much free credit. ItBM- If
turd floats up, will be flushed later. PiG hits
head on ceiling while walking tightrope, may lose balance. MMMmm?- Not
Campbell's Soup. Pot boiling over. Tastes bad. Mr. Bill is
shifty. From da judge he want's a gifty. May get through 50. After that
not too nifty. Wally
bounces weakly on the weekly. See you in Intraday Stool. Dr. Stepan N. Stool Share your thoughts on the Stool Pigeons Wire.
Renewals Welcome, and thank you for subscribing to the Anals of Stock Proctology. Your trial subscription will run for 90 days. At the end of that period your subscription will renew automatically, unless you cancel. If you wish to cancel your subscription use the button below. If you want to renew your subscription do nothing. Your subscription will renew and your credit card or Paypal bank account will be charged. If you want to renew, be sure your credit card information in your Paypal account is current. Paypal will not renew your subscription if the card has expired! Again, thanks for subscribing!
Explanation of Intraday Commentary-Build charts at http://www.livecharts.com. For custom time bars insert a comma after symbol and number of minutes, e.g. compx,90. This will give you a bar chart of the Nas with 90 minutes per bar. The one day cycle is usually most clear with 8 minute bars and 26/18 stochastics. It varies from day to day. Sometimes 6 minutes works best. Experiment to find the best fit for your trading style, and the market's dominant frequency at the time. The goal here is primarily to monitor the condition of the 8 and 13 day cycles. I typically use 90 minute bars with 26/18 stochastics for the 13 day cycle proxy on the indices during regular trading hours. Other cycles use 26/18 stochastics with the following: 8 days- 60 minute bars On the 24 hour futures charts, use a time per bar approximately 3 to 4 times the above number of minutes, to represent the cycles listed above. ABBREVIATIONS: cma: centered moving average |
||||||||||||||||||||||||||||||||||||||||||||||||||||||||||||||||||||||||||||||||||||||||||||||||||||||||||||||||||||||

![[Most Recent HUI from www.kitco.com]](http://www.weblinks247.com/indexes/idx24_hui_en_2.gif)
![[Most Recent XAU from www.kitco.com]](http://www.weblinks247.com/indexes/idx24_sp500_en_2.gif)
![[Most Recent Quotes from www.kitco.com]](http://kitconet.com/charts/metals/gold/t24_au_en_usoz_2.gif)