|
10 Minute Bar Charts 6/4/02 Dow Jokes Inflatables
Archives 12/30/01, 1/1/02, 1/2/02, 1/3/02, 1/4/02, 1/7/02, 1/8/02, 1/09/02, 1/10/02, 1/11/02, 1/14/02, 1/15/02, 1/16/02, 1/17/02, 1/18/02, 1/22/02, 1/23/02, 1/24/02, 1/25/02, 1/28/02, 1/29/02, 1/30/02, 1/31/02, 2/1/02, 2/4/02, 2/5/02, 2/06/02, 2/7/02, 2/9/02, 2/11/02, 2/12/02, 2/13/02, 2/14/02, 2/16/02, 2/19/02, 2/20/02, 2/21/02, 2/23/02, 2/25/02, 2/26/02, 2/27/02, 2/28/02, 3/1/02, 3/04/02, 3/05/02, 3/06/02, 3/7/02, 3/10/02,3/11/02, 3/12/02, 3/13/02, 3/14/02, 3/15/02, 3/18/02, 3/19/02, 3/20/02, 3/21/02, 3/22/02, 3/25/02, 3/26/02, 3/28/02, 3/30/02 4/1/02, 4/2/02, 4/3/02, 4/4/02, 4/6/02, 4/8/02, 4/9/02, 4/10/02, 4/11/02, 4/13/02, 4/15/02, 4/16/02, 4/17/02, 4/18/02, 4/20/02, 4/22/02, 4/23/02,4/24/02,4/25/02, 4/26/02, 4/27/02, 4/29/02, 4/30/02 5/01/02, 5/2/02, 5/4/02, 5/6/02, 5/07/02, 5/8/02, 5/09/02, 5/10/02, 5/13/02, 5/14/02, 5/15/02, 5/16/02, 5/17/02, 5/20/02, 5/21/02, 5/22/02, 5/23/02, 5/24/02, 5/28/02, 5/29/02, 5/30/02
|
The Anals of Stock ProctologyPublished 5 times
per week by the American Academy of Stock Proctology and PM Update 6/5/02 1:00PM The market should theoretically be in the 1 day cycle trough as this is written. This morning conformed fairly well to the cycle map. Doesn't mean the afternoon will. As a number of stoolies noted on the Intraday Stool message board, this market has the smell of death about it. Be that as it may, the cycles suggest another move up in the 1 day cycle, albeit a weak one. The longer 5-13 day cycles are in a swup, and that should continue for another day or two. The danger in this forecast lies in the possibility of the market going into crash mode. We should be on the lookout.
AM Update- 6/5/02 9:10 AM Fucutures were weakening, with a slight bounce before the NY open. The 5 hour and 1 day cycles were still rising at the close yesterday and are due for a peak this morning. Best guess is 10:30, based on a 3 hour wavelet high. Lows are due at 11:30 and 1 on the 5 hour and 1 day cycles. The 5, 8, and 13 day cycles appear to have bottomed yesterday. Looks like we're in a weak swup that could last a few days. The cmaps are derived from the indices as of yesterday's close. Note that the 5 day cmaps were already hit yesterday. It's actually too early for upside cmaps on this cycle, and in fact, there are still unmet downside cmaps slightly below yesterday's lows on the 5 day cycle. This is an ugly, muddy picture. That usually leads to sloppy trendless trading.
Bearish Exuberabance? An Oxymoron (6/4/02) Doc was a little concerned tonight while listening to Bearton Biggs being interviewed on crapvision by Run Insane and Sue Herass. Biggs has been a bear for a long time. Now he's looking for a "bottom" and a big rally. He's had a pretty good record on those kinds of calls in the past. But then he cited the statistics. And what did he cite? The gloom on the Street, and Dover Sole sentiment. He also talked about the similarities between this market and past bear market bottoms. Unfortunately, while Doc respects Bearton, he thinks Biggs is wrong on all counts. Sentiment, while certainly reflecting pessimism, is by no means extreme. Stoolies know that it is normal for sentiment to be pessimistic in bear markets. Furthermore, the extremes of pessimism increase as the bear market proceeds. The sentiment figures Biggs cited are not only not extreme by bear market standards, they are not even uniformly pessimistic. Investors Intelligence still has the majority of advisory services being bullish, and as Richard Bernstein told us on Monday, the Street's market strat-ego-ists are wildly bullish. Then today Mark Hulbert reported the following over on SeeBS.Markethype :
That's another example of an indicator that's only middlin'. Looking at the put call ratio which Biggs mentioned, we see a 17 day reading of .81. That may be high enough to signal a short term rally or it may not. This indicator has been trending higher for over two years, and the current reading is not extreme by standards of the last 9 months. Definitely not the kind of exrtreme you'd expect at a major low. Biggs also cited the rise in the VIX. At 27, the VIX is nowhere near the levels it can reach at a significant intermediate bottom. Again, a short term low, possibly, but nothing more. Finally, Biggs referred to the pattern of bear markets ending first with a panic selloff and then a low volume retest where deep, all pervasive, gloom and doom prevails, a few months later. Biggs says the same thing is occurring today. While that may be correct in some cases, 1974 comes to mind, it is not always so. And Doc knows of only one other case where the bear market has taken 9 months to retest the prior low. That was 1932-33. Roosevelt was inaugurated on March 4, in the pits of the depression. Fear and despair reigned.
Now that, ladies and gentlemen, is pessimism. While we may never approach the depths of despair reached in the Depression, if it's a major retest bottom you're looking for, this isn't it.
The Feed did $3.5 billion in overnight
repos, and a coupon pass of $542 million. As Doc predicted after last
week's huge pump job, the Feed continues to sop up the excess. $4 billion
overnight and $5.5 billion in 5 day repos were expiring. The net drain was
$5.2 billion. The Fast Feedometer, which is a day to day measure of
excess Feed, is back to a level that will not help the stock market. Al
has the Gang of 22 primary dealers on a starvation diet when it comes to
leftovers for stocks. The Gang continues to focus on Treasuries and
derivatives, where they can still make the easy money. The Slow Feedometer measures the
excess Feed over 17 days, which is half the 6-7 week trading cycle. As you
can see, it's basically flatlining. The market needs weeks of consistent
excess Feed in order to put on a bull show. Without the excess Feed,
without the support of the sheeple, without foreign buying, the corpses
will continue to cannabalize themselves, just as the internet corpses did
in the internet bubble. Selling stock and consuming the proceeds is the
name of the game. All the above notwithstanding, there are signs of a short cycle low being put in, with double bottoms and "positive divergences" on the charts. (There are always positive divergences. Half the time they mean something.) If ever the stage managers had an excuse to jam the shorts this is it. The action could be choppy to up for a couple of days. Doc wouldn't be inclined to short until he saw what the next bounce or two looked like. And he would not be inclined at the moment to chase anything that looks like a breakdown either. The short cycles need to go through an up phase, however brief and weak it might be, before the really big move down.
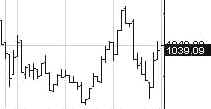
Portfolio Sphincters Index (SPX) and Sentiment The Sphincters Index bounced around also, closing in the middle of its range at 1039, down a point. The 17 day rate of change, which represents the 6-7 week cycle, and the 6-7 week cycle oscillator superimposed on the chart below (red line with purple smoother) are negative. The 10-13 week cycle oscillator (teal) is still topping out. There seems to be a need for more distribution, i.e. the market makers need to get you to give them your short positions at higher prices, before the ultimate breakdown. The 29 day rate of change is also still in a topping pattern. On the other hand, it looks like a positive divergence. Market makers will jump on this kind of momentum divergence to drive a squeeze. The VIX moved up again to end at 26.94. On the inverted scale chart, VIX has broken the level of the last short cycle low and has touched the lower inner band which has successfully signaled the last several short term rallies. Will the market rally again like it did in early May? Let's just say it should try to rally, but it won't be like the last one. The stool band is beginning to turn down, and cyclicality on the major trading cycle is turning more bearish. The blue channel lines are the extension of a linear
regression channel from the February and May 2001 highs. The 6 month cycle
oscillator is stalled in negative territory, but again, the positive
divergence may attract trading interest from players looking at indicators
with a similar basis. The trading
stoolicator is starting to turn down but is indecisive. There's no clear
signal. The short cycle oscillator is sitting on the trampoline with
the broken springs. The 10-13
week cycle oscillator is only starting to roll over to the downside and
there's no signal. This is also a clearly recognizable level formerly
known as support. (There's no such thing as support in a bear market.)
Until this level is broken, bears need to keep their bearish
"enthusiasm" under control. Be wary of shakeouts. The decline stopped dead at the 61.8% retracement
level. A retest of the breakdown level at 1050ish, i.e. a return to the
scene of the crime, is almost a given in these situations. The Cycle Conditions tables include cycle phase and a wild guess as to number of periods to the next turn, in days for the shortest cycles, weeks (W) or months (M) for the longer ones. This is a fluid exercise, in other words, the projections are likely to be wrong, but they force us to be vigilant for key turning points, and frequently work well enough to prevent costly misreadings. SPX Cycle Conditions as of 6/4/02
PTT - Periods Till Turn Nasgap Charts The Nasty had a short covering rally. Heck, shorts are probably the only market here any more. But as we all know, shorts are their own worst enema. And Mrs. Bear Market never lets us bears have too much fun for too long. The 6 month
cycle time series spread is still stalled, in a potentially bullish
configuration that will have the market makers frothing at the mouth to
trigger a Nasty squeeze, just so they can take your shorts from you. The 10-13 week cycle
oscillator and the trading stoolicator are very close to sell signals. But
unlike our beloved former Commander-in-chief, close is no cigar. The short
cycle oscillator is still in position to signal a little rally, and
Monday's action is beginning to smell like an orchestrated shakeout by
market makers, designed to get shorts to overcommit. The next act in this
play could be the squeeze. That 4 week double bottom is awfully ugly if
you're a bear. The
picture is pretty much the same in the Nads 100 except that the long term
channel is clearly down. Still there's that ugly double bottom, and all
those cycle lines suggesting support. The Bears
were driving toward a score at 1561, but they couldn't put it in. It's
fourth and ten and the kicker has a broken leg. Nasdaq Cycle Conditions as of 6/4/02
PTT
- Periods Till Turn This is it
ladies and germs, bottom or breakdown. We see an equal division of
indications going both ways. The break below 5% looks like a WHOPsaw. It
sucked in a lot of technical buyers. They may get stranded. This pattern
looks a great deal like the Jan-Feb lows. The odds are that in a couple of
weeks bond yields will head up again, and that the mild uptrend will
remain intact. Rotation.
The sphincters are rotating out of the recently popular cyclical, financials,
and consumer stocks. What will they eye? Why tech of course, where double
bottoms and positive divergences abound. This will be a disastrous
strategy, but it could make the tech groups inviting for a few days. The
SOX is a good illustration. The tested bottom
theory can also be seen in Software. This pattern is typical of many technology
groups and individual stocks. The 2000
Rusty small craps also have a perfect excuse to bounce, the meeting of
several cycle trend projection support lines. There are no signals yet, so
there's more work to be done in the 460-70 area. Again, assuming the
uptick materializes, it should be short and weak. Microprice
illustrates the tech double bottom theory. 50 is also a nice round number
that attracts buyers. All indications are that whatever the shape of the
bounce, it will be the last gasp of a dying bull. This is the final act of
a 10-13 week cycle sideways up phase that began in early May. GM
illustrates the rotation out of the cyclical/consumer/financial sector
that began a couple weeks ago. Everything points down, but we could see
some buying come in in the 57-58 area. Stoolie
Michelle sent in a request for the Maytag repairman. Thank you Michelle.
That was not only timely, but also consistent with today's theme, rotation
out of Wall Street's darlings. Look for a bounce from the 40 area, then
more distribution before the next downleg. Henceforth and forevermore, if you would like to request a "stocko", please post your request in Dear Dr. Stool. If you have not already registered for the message board, please do so. The only required info is user name and password which you choose yourself, and your email address, which you can keep private by selecting the keep private option. Uncle Buck's Illness A team of medical
specialists is working furiously to save buck. He doesn't have much of a
chance, but they could delay the inevitable. Golden Stool The golds
are getting nosebleeds up here. EEEEEverybody is looking for a correction.
The POG is on the mat today. Doc will sit through whatever pullback might
materialize. See you in Intraday Stool. Dr. Stepan N. Stool Let me know what you think on the Stool Pigeons Wire. Previous complete issue with all features Welcome To New Subscribers Welcome, and thank you for subscribing to the Anals of Stock Proctology. You may note some subtle differences in style now that this is no longer a free service. The perspective is still bearish, but it will have a more balanced approach than my message board ravings. You won't see me screaming "BUY" about anything except perhaps gold, but you will see stronger indications of areas and times when I think it might be a good idea to avoid being short. And I promise that I will lose my temper from time to time to keep you entertained! There's also a new feature, Doc's By Request Stock O' The Day. If you have a stock you're interested in, send an email to [email protected], naming the stock, and why you think Doc should look at it, in 25 words or less. 26 words, and you're disqualified! Those that look interesting, Doc will try to feature here within the next day or two. If you have suggestions about other features you'd like to see, send them along to [email protected]. Again, thanks for subscribing!
Explanation of Intraday Commentary-Build charts at http://www.livecharts.com. For custom time bars insert a comma after symbol and number of minutes, e.g. compx,90. This will give you a bar chart of the Nas with 90 minutes per bar. The one day cycle is usually most clear with 8 minute bars and 26/18 stochastics. It varies from day to day. Sometimes 6 minutes works best. Experiment to find the best fit for your trading style, and the market's dominant frequency at the time. The goal here is primarily to monitor the condition of the 8 and 13 day cycles. I typically use 90 minute bars with 26/18 stochastics for the 13 day cycle proxy on the indices during regular trading hours. Other cycles use 26/18 stochastics with the following: 8 days- 60 minute bars On the 24 hour futures charts, use a time per bar approximately 3 to 4 times the above number of minutes, to represent the cycles listed above. ABBREVIATIONS: cma: centered moving average |
|||||||||||||||||||||||||||||||||||||||||||||||||||||||||||||||||||||||||||||||||||||||||||||||||||||||||||||||
![[Most Recent XAU from www.kitco.com]](http://www.weblinks247.com/indexes/idx24_nasdaq_en_2.gif)
![[Most Recent XAU from www.kitco.com]](http://www.weblinks247.com/indexes/idx24_sp500_en_2.gif)
![[Most Recent Quotes from www.kitco.com]](http://kitconet.com/charts/metals/gold/t24_au_en_usoz_2.gif)
 The
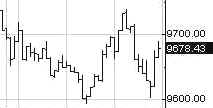
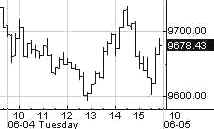
stage managers were definitely dancing up a storm today. The Dow had
no fewer than three 100 point swings and was on its way to a possible
fourth in closing down 21.
The
stage managers were definitely dancing up a storm today. The Dow had
no fewer than three 100 point swings and was on its way to a possible
fourth in closing down 21.