|
Archives 12/30/01, 1/1/02, 1/2/02, 1/3/02, 1/4/02, 1/7/02, 1/8/02, 1/09/02, 1/10/02, 1/11/02, 1/14/02, 1/15/02, 1/16/02, 1/17/02, 1/18/02, 1/22/02, 1/23/02, 1/24/02, 1/25/02, 1/28/02, 1/29/02, 1/30/02, 1/31/02, 2/1/02, 2/4/02, 2/5/02, 2/06/02, 2/7/02, 2/9/02, 2/11/02, 2/12/02, 2/13/02, 2/14/02, 2/16/02, 2/19/02, 2/20/02, 2/21/02, 2/23/02, 2/25/02, 2/26/02, 2/27/02, 2/28/02, 3/1/02, 3/04/02, 3/05/02, 3/06/02, 3/7/02, 3/10/02,3/11/02, 3/12/02, 3/13/02, 3/14/02, 3/15/02, 3/18/02, 3/19/02, 3/20/02, 3/21/02, 3/22/02, 3/25/02, 3/26/02, 3/28/02, 3/30/02 4/1/02, 4/2/02, 4/3/02, 4/4/02, 4/6/02, 4/8/02, 4/9/02, 4/10/02, 4/11/02, 4/13/02, 4/15/02, 4/16/02, 4/17/02, 4/18/02, 4/20/02, 4/22/02, 4/23/02,4/24/02,4/25/02, 4/26/02, 4/27/02, 4/29/02, 4/30/02 5/01/02, 5/2/02, 5/4/02, 5/6/02, 5/07/02, 5/8/02, 5/09/02, 5/10/02, 5/13/02, 5/14/02, 5/15/02, 5/16/02, 5/17/02, 5/20/02, 5/21/02, 5/22/02, 5/23/02, 5/24/02, 5/28/02, 5/29/02, 5/30/02 6/01/02, 6/3/02, 6/4/02, 6/5/02, 6/6/02, 6/7/02, 6/10/02, 6/11/02, 6/12/02, 6/13/02, 6/14/02, 6/17/02, 6/18/02, 6/19/02, 6/20/02, 6/22/02, 6/24/02, 6/25/02, 6/26/02, 6/27/02, 6/30/02 7/1/02, 7/4/02, 7/5/02, 7/11/02, 7/14/02, 7/15/02, 7/16/02, 7/17/02, 7/18/02, 7/19/02, 7/22/02, 7/23/02, 7/24/02, 7/25/02, 7/27/02, 7/29/02, 7/30/02 8/1/02, 8/3/02, 8/5/02, 8/6/02, 8/7/02, 8/8/02, 8/10/02, 8/12/02, 8/13/02, 8/14/02, 8/15/02, 8/16/02, 8/19/02, 8/20/02, 8/21/02, 8/22/02, 8/23/02, 8/26/02, 8/27/02, 8/28/02, 8/29/02, 8/30/02 9/3/02, 9/4/02, 9/5/02. 9/6/02, 9/9/02, 9/10/02, 9/11/02, 9/12/02, 9/13/02, 9/16/02, 9/17/02, 9/18/02, 9/19/02, 9/20/02, 9/23/02
|
The Anals of Stock ProctologyPublished weeknights by
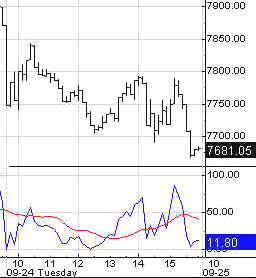
8:30PM Happy Acres, Florida Time The American Academy of Stock Proctology and Is your subscription up for renewal? If you want to renew, do nothing, unless your credit card has expired. Please be sure your credit card info is current. If your credit card has expired, you must enter the new expiration date in your Paypal account in order for your subscription to be processed. If you subscribed via Paypal, your subscription will be renewed for one year on the 90 day anniversary of your sign-up and your credit card will be charged. If you want to cancel, use the button at the bottom of the page. This applies only if you subscribed through Paypal. Mailed-in subscriptions are for 1 year. If you subscribed by prior contribution, I will send you a notice before your subscription expires. If you have any questions, see the subscription page and FAQ's. If you can't find the answer, email me. Update 9/25/02 1:15 PM Terms and methodology Up and down every two hours is enough to make a person seasick. Here at 1 PM they are testing the top of the range and the upside cmaps for the 5 day cycle. If they break out, the up phase of the 5, 8 and 13 day cycles will have an upward, as opposed to flat, slope. However, by some counts the tops of all those cycles should be today, and the Treasury note auction should put pressure on the stock market because the new money raised drains funds from the banks. Obviously all this up and down makes reading the cycles, well...., let's say impossible. But Doc's SWAG is that the 5 hour high is now forming and the longer cycle cmaps will not be broken to the upside. We'll know soon enough if that's wrong. If they do break, look for another 10-15 points up..
Update 9/25/02 11:00 AM Terms and methodology Cmaps for the 1 day cycle lows due by1 PM are Sphincters 817, Nasty 1180, and 100 Nads 842. Whether they get there or not, look for another pop off the low, until late PM, then down into the bell. Update 9/25/02 9:15 AM Terms and methodology The jam is on. Like clockwork, overnight, after every Fed meeting. Your free markets at work. The outcome will be the same as always. This is counter cyclical. It will sell off immediately after the open into a mid-day 1 day cycle low. Expect wild gyrations for few days. The 5, 8, and 13 day cycle up phases are bucking the tide. They won't make any upside progress, but will cause churning. Based on the fucutures, the early highs should be around 828-30 on the SPX and 858-65 on the NDX. That translates to 1195-1205 on the Nas. Doc will post a downside cmap as soon as possible after the peak. Keep this in mind. The $27 billion auction of 2 Year Treasury Notes comes this afternoon and it will raise $6.7 billion of new money. That will put severe pressure on the markets. Look for an enormous Feed this morning to greases the skids.
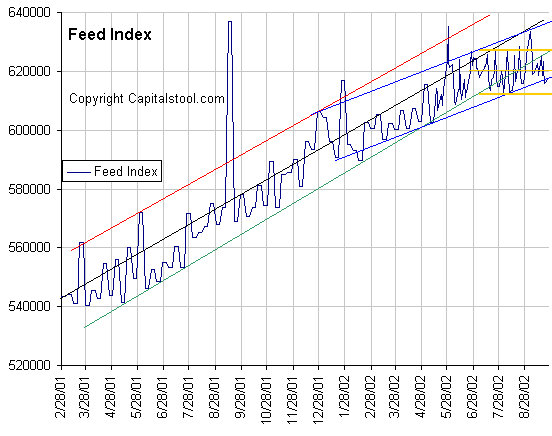
Lies, Lies, and More Lies (9/24/02) Doc was doing a little trolling for quotes and came across this winner over on CNN Moneylies. "An investor who has stayed in the market for at least 15 years has never lost money, according to research by Ibbotson Associates." The media is always printing lies from Ibbotson, the official dickhead mouthpiece of the mutual fund sales industry. Reporters never question this stuff, even though it is nothing more than a pack of patently absurd, bald faced lies. Ibbotson is one of the greatest criminal gangs in history. They're the ones responsible for the business of "long term stock returns are 11%," and similar nonsense. They get away with it because no one ever questions them. Lies, lies lies. Can anyone put a stop to it? No. But the market will. The market will. All in due course. In the meantime, so long as we continue to see AhOL Time Warner and Crapvision and SeeBS. Markethype and the Whore Street Journal and Incestuous Business Daily and all the other financial infomercial media outlets pumping out this kind of disgusting swill, you'll know the market is nowhere near the bottom. Doc was not surprised by today's action. He continues to believe the cycle and indicator configurations on the charts portend one of the most protracted periods of severe decline in stock market history. We are in the early stages of the third and final leg of the first bear cycle in a secular bear market. And the market is doing exactly what bear markets do at this stage. So sit back in your shorts, kick up your feet, grab a gold one, and enjoy. The Feed sat tight both on the rate front, and the Feed front. This is effectively another incremental tightening, as zero Feed is less than the apparent recent growth target of 8%. There are no expirations tomorrow. However, when the market sells off after a Fed meeting, Al's pattern has been to do a big Feed the next day and try to jam the crap out of it. Wednesday will be interesting, at least. The Total Feed remains on the 8% growth channel (blue). The distance below the 10% growth channel continues to increase. Doc speculated that maybe Al was saving up for an enormous Feed blast when the Dow broke the July-August lows. If there's no big Feed now, then when? And if there is a big Feed, will it have any impact? With the cycle picture as bad as it is, it's doubtful. But it should be good for a little pop. Very little. Three trends are evident on
the Feed Index. One is the 10% growth trend beginning in May of 2001. Feed
growth has recently been at or below the lower boundary of that trend. The
blue channel going back to last December suggests that Al may now be
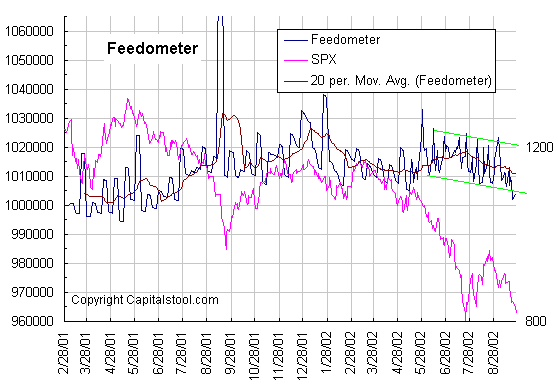
targeting an 8% growth rate. Then there's the golden box which says he's stopped growing Feed altogether over the last three months. The Feedometer stayed below its recent range. This is a double bottom in the Feedometer. Normally we'd expect a big Feed from this level. If they don't Feed now, the market collapse could accelerate. The
Feedometer theoretically
measures excess Feed available for bond or stock market jamming.
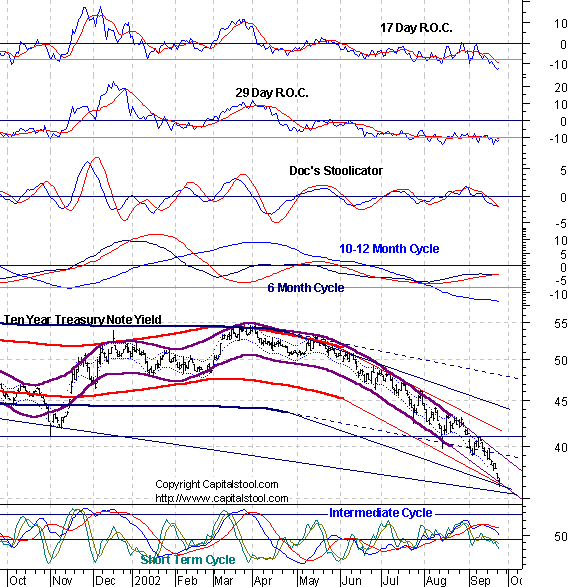
Long
Bong Hit - Cmaps on the 10 year yield are pointing anywhere from 3.30 to
3.60. They closed at 3.65 after hitting 3.59 Tuesday. Panics like this do
not end quietly. When it
turns, you'll know it. The little guys can cash out. It's the big guys
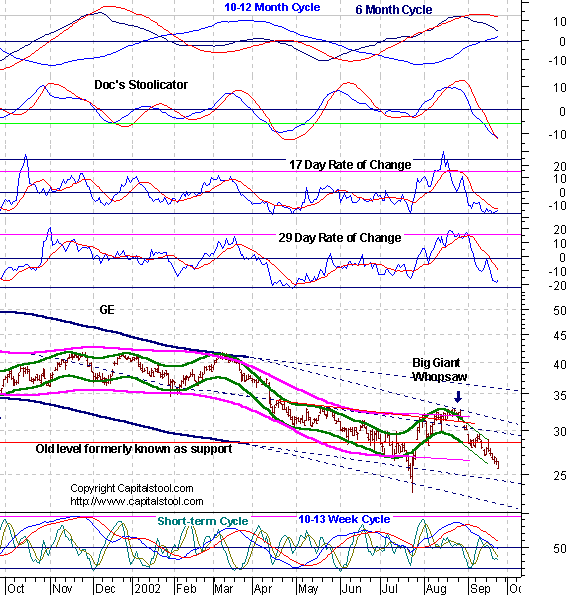
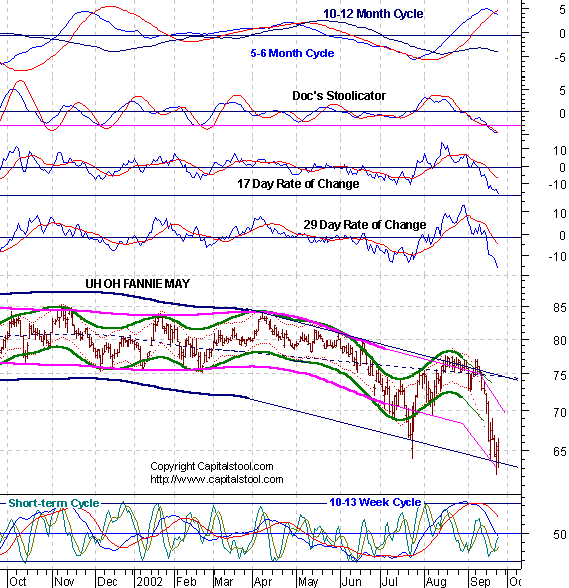
like Fat Ass (FNM), General Custer (GE), and General McClellan (GM) who
need to worry. They're stretching the limits of the channels and Short term
cmaps for cycles up to 6-7 weeks point to a low of 3.60 but the oscillators
show no sign of a turn yet.
All of Doc's
cycle charts
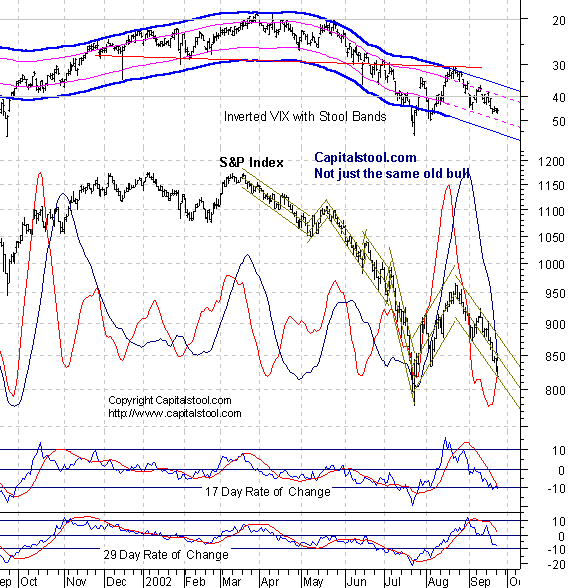
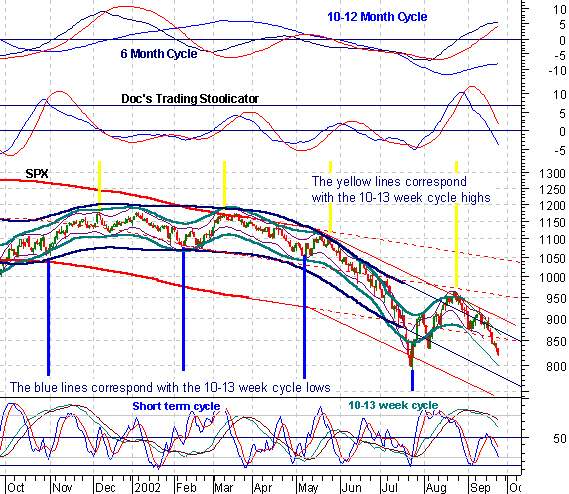
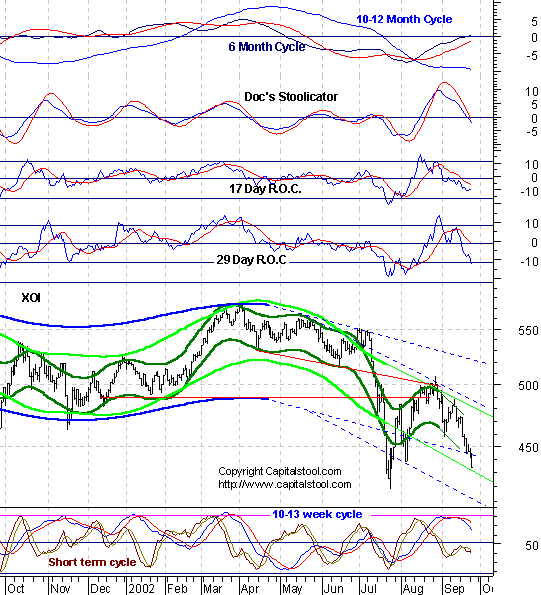
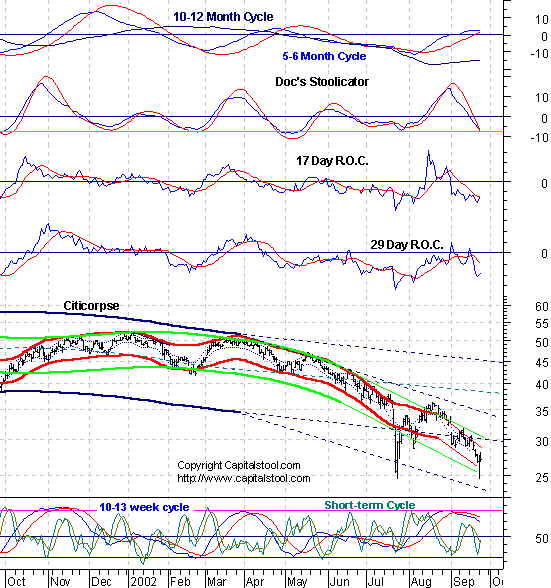
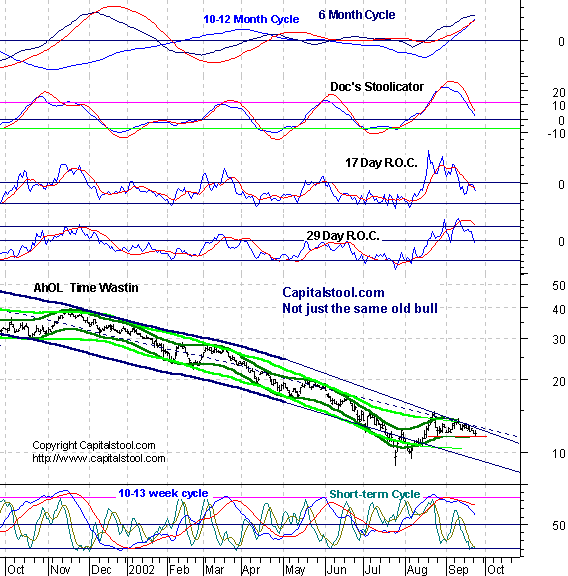
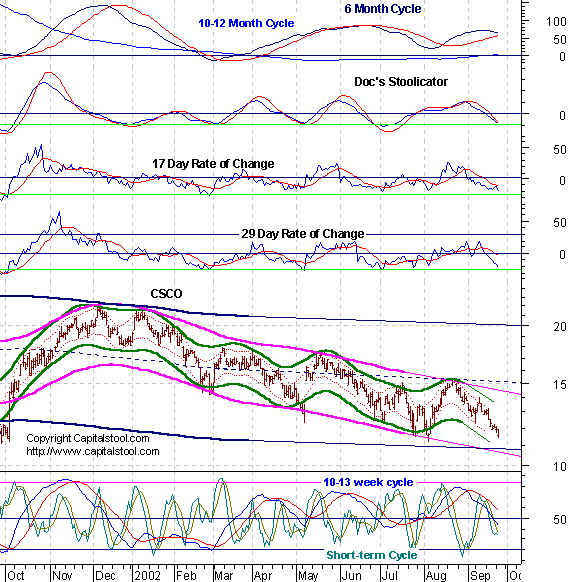
are powered by METASTOCK Portfolio Sphincters Index (SPX) and Sentiment The SPX dove toward the lower line of its linear regression channel from the August high. Both the 17 day and 29 day rates of change are still downtrending, suggesting sustained downside, but the 17 day rate of change is on the cusp of a signal for a brief reaction rally. It could also break down again. We can't anticipate because it could go either way. The trend is your friend. When the 10-13 week cycle wave is coming down hard, the 6-7 week cycle becomes a non issue in the big picture, but it is still capable of generating a brief spike to the upside lasting a couple of days. Whether a 6-7 week cycle low is in or not is irrelevant in the big picture. The superimposed 6-7 week cycle oscillator is still rising from the lowest level it has reached in this bear market. The indicator will continue to correct upward barring anything less than a total collapse in price. The rise represents a subtle, virtually unrecognizable positive change in momentum, which is, in fact, the cycle up phase. The crashing 10-13 week wave is overwhelming whatever buying this cycle cohort is doing. As the up phase goes on, the market's vulnerability to sharp drop will only increase. The 10-13 week cycle oscillator tends to mimic price action more closely. It is collapsing. It should be 2 to 5 weeks before a cycle low. It looks like this indicator will make a record low in this move. The VIX rose only
slightly to 45.38. It remains in the center of the inverted scale 6 month cycle Stool band.
There is actually less fear now than there was when the market was at the
same price level in July. A reading in
excess of 60 is likely before
the next 10-13 week cycle low. Where it will settle at the ultimate
market low is anybody's guess. Making the assumption that certain levels are extreme
does not work when markets are trending. Sentiment indicators are useless
when used that way. We can never know what "extreme" is
without actually charting the indicator just as we would a stock or index
price. When it goes through a channel, it's extreme. The 17 day rate of change is a proxy for the 6-7 week cycle. the 29 day rate of change is a proxy for the 10-13 week cycle. The dark blue overlaid line is the 10-13 week cycle oscillator, while the red line is the 6-7 week cycle oscillator. The short cycle oscillator, (chart below) continues down, in position to drop for several more days at the current rate. This indicator tends to hit the "bottom line" at 4 or 6 week intervals, mimicking those cycles. By that measure the next good low looks to be about a week away. The 10-13 week cycle
oscillator is accelerating down, but is still well above the 50% line,
room and time enough for a huge drop from here. The 6 month
cycle indicator still has not topped out, leaving us to wonder what kind
of disaster lies ahead when this indicator turns down. The same goes for
the 10-12 month cycle indicator. This looks like only the early stages of
possibly the greatest
extended collapse in history. The preliminary
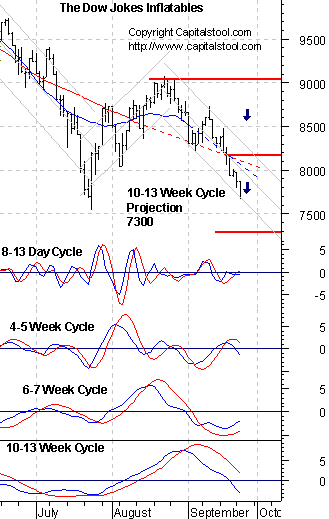
downside cmap is 650 for the 6 month cycle low due in early 2003.
Short cycle cmaps are now 770-810. The 10-13 week cycle cmap is 720. Look
for a weak rally off the test of the lows, then another leg down.
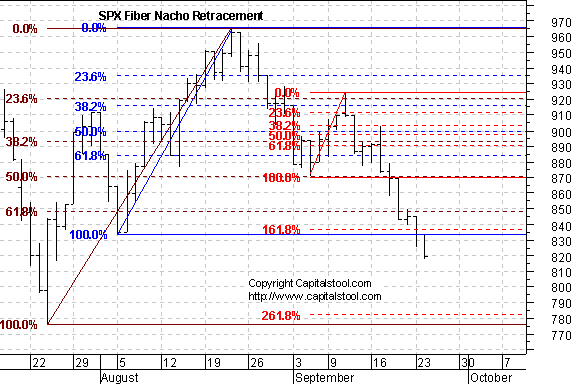
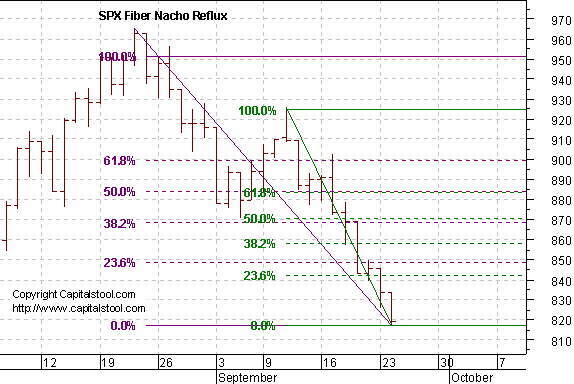
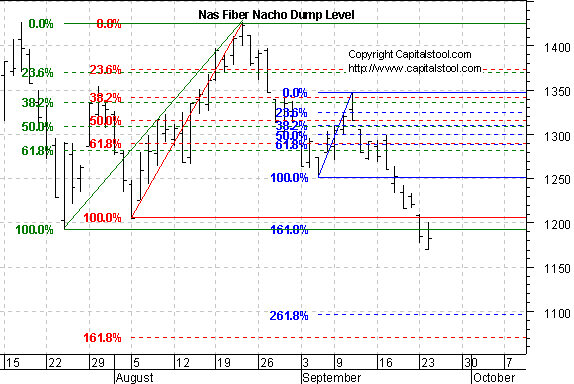
Fiber Nacho Dump- Support levels and downside targets.
Fiber Nacho Reflux- Resistance levels and upside targets The Cycle Conditions tables include cycle phase and a wild guess as to number of periods to the next turn, in days for the shortest cycles, weeks (W) or months (M) for the longer ones. This is a fluid exercise, in other words, the projections are likely to be wrong, but they force us to be vigilant for key turning points, and frequently work well enough to prevent costly misreadings. SPX Cycle Conditions as of 9/24/02
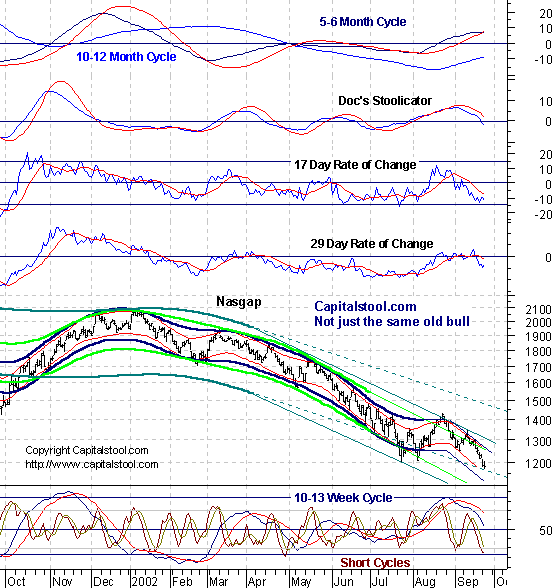
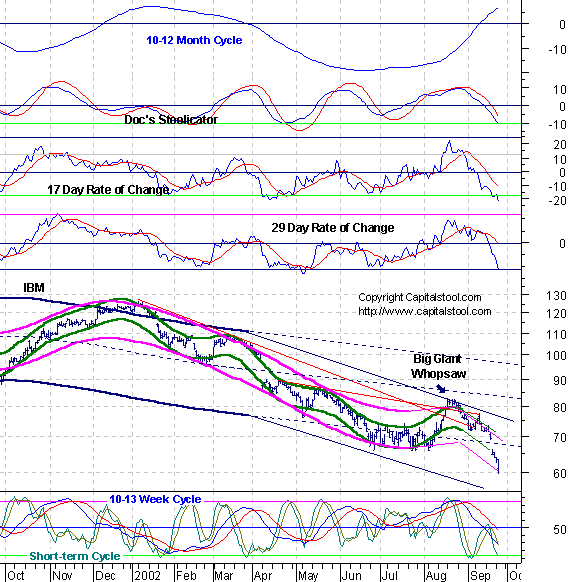
PTT - Periods Till Turn Nasgap Charts The Nas set another new bear market low but held up better than the rest of the market. Who was buying? Shorts being our own worst enema, we were, of course. The 17 and 29 day rates of change remain in downtrends. Short term lows are usually preceded by a small double bottom or positive divergence in mo. There's a tiny divergence in the 6-7 week oscillator. Nothing to get excited about yet, but if it continues for a few days, look for one of those 2 day wonder rallies. The 10-13 week cycle is in a down phase that should last 2-5 weeks, plenty of time for a lot more downside, even with an intervening bounce. The 6 month cycle indicator is topping out. It's late, and it portends that this downtrend will steepen before it hits a bottom months from now. For starters, the very preliminary indication for the January-February 6 month cycle low is 1000. It should drop more unless there's a big intervening rally. The 4 week cycle is heading down in gear with the 10-13 week cycle. The power of these combined waves is creating a rip current that pulls everything with it. Maybe it's more like a vacuum - a vacuum of buyers that sucks everything into it making money disappear in the process. The probability of a meaningful rally within less than two weeks is low. But the short cycle oscillator is in the bottoming zone, so a minor pop or holding action remains likely at some point within the next couple of days. It should be shortable. The long
term cycle channel has two possible paths. Doc chooses the lower one. The
most bullish case would be for things to bump along within the dotted line
channel for months. But if Doc is right, and this is a six month cycle
top, the Nasty is headed for a three digit number. The 10-13 week cycle projection is
now 980-1025. Doc expects at least one more 10-13 week wave after this
one, leading to a new low to
complete the 4 year cycle.
Fiber Nacho Dump- Support levels and downside targets.
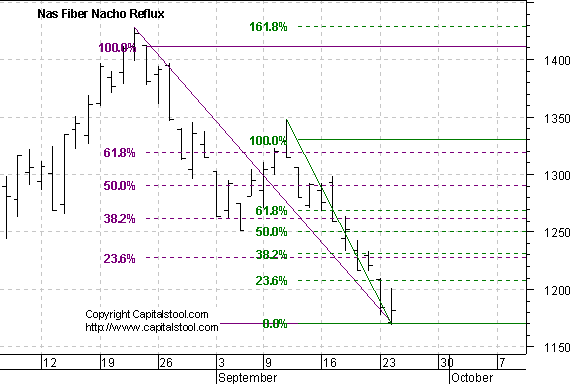
Fiber Nacho Reflux- Resistance levels and upside targets Nasdaq Cycle Conditions as of 9/24/02
PTT
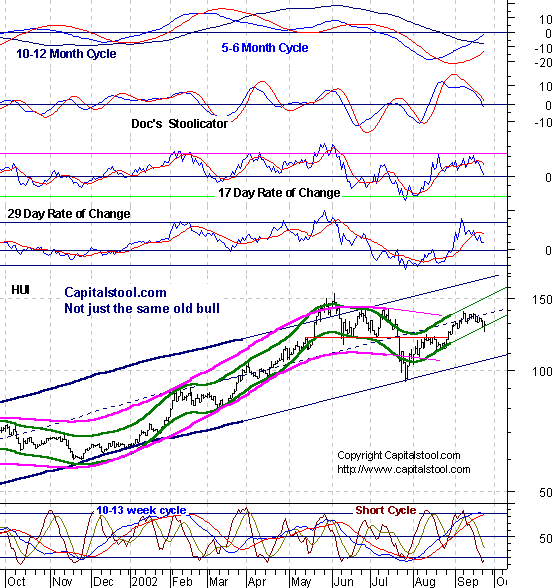
- Periods Till Turn AM Edition Features (Previous) These features are in morning edition, published around 9 AM ET US, or the Saturday Weak End Edition, published, uh, let's see, Saturday! Golden Stool HUI dropped to
its downside cmaps on an intraday basis, then rebounded strongly. The
uptrend channel remained intact. A 4 week cycle low is now due. Either
this cycle or the 6-7 week cycle have been the dominant short term cycle.
The short cycle oscillator is in the bottoming area and has begun to turn
up. Doc will look for a short term base to form, then a push to test the
highs. The gold price is already making that move. Uncle Buck's Illness
Buck is topping out the 6 month cycle up phase. The first move will be
back to the 105 area. Doc keeps wondering what he'll sell off against.
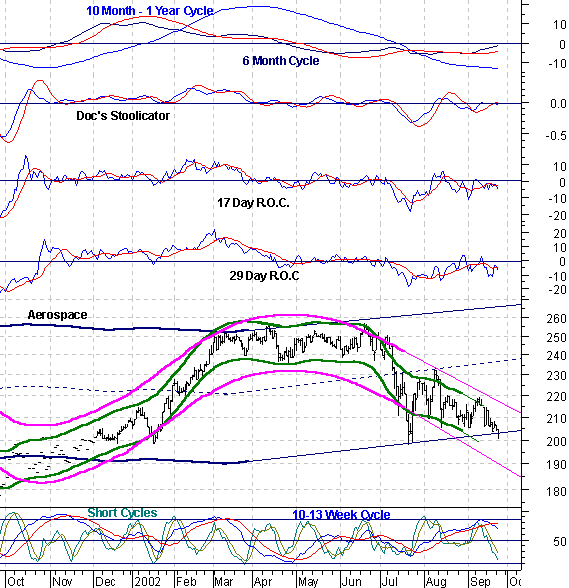
Consider the alternatives. They're all in the sick ward too. Aerospace- May
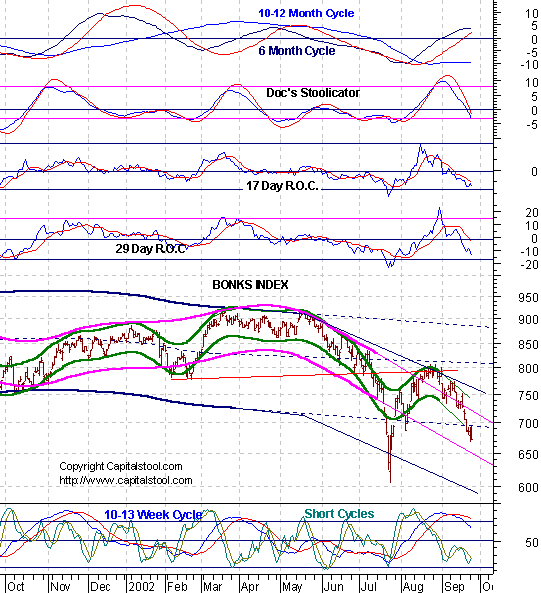
bounce on landing. Bonkers- May bounce a bit
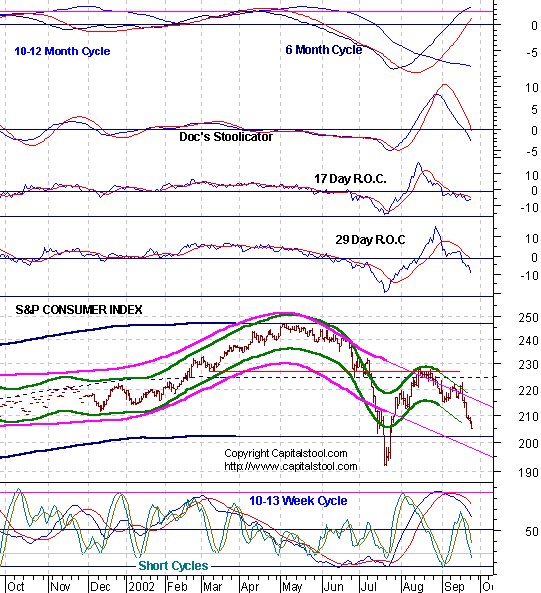
to complete 6 month cycle top. Consumer- 10-13 week cycle
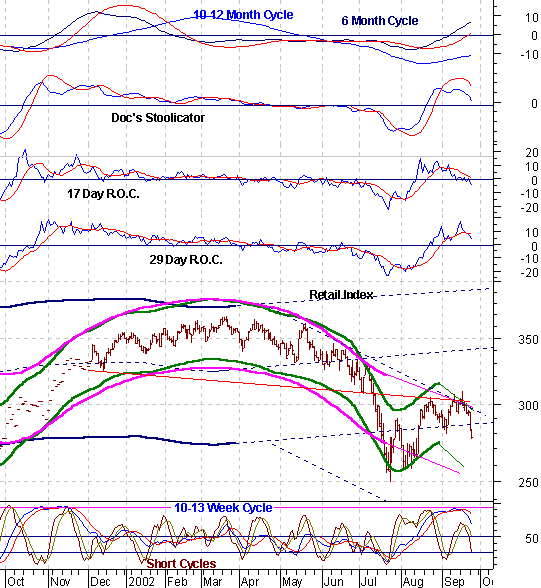
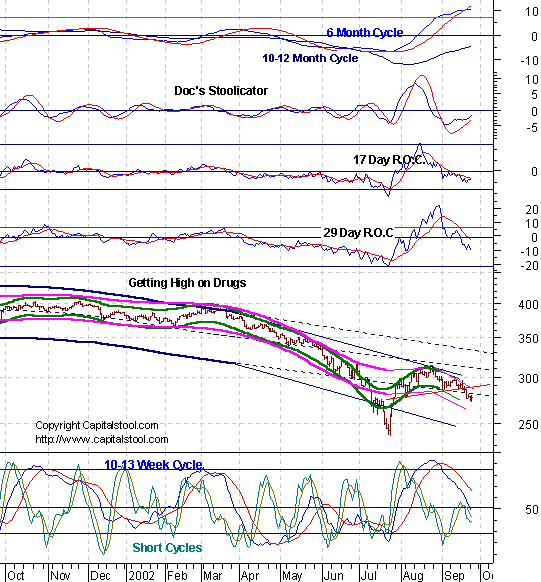
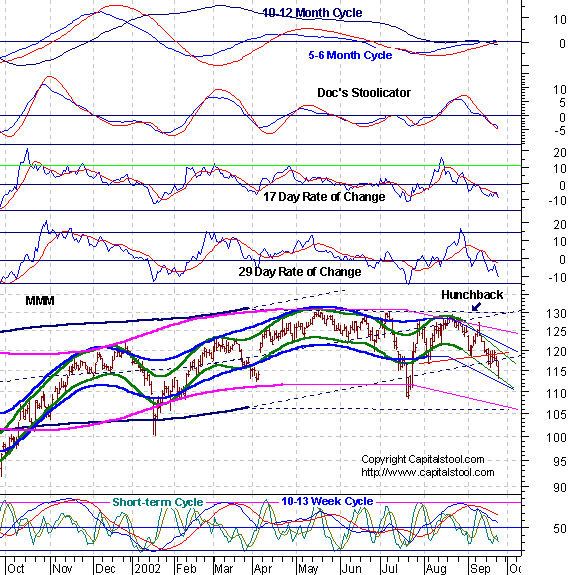
down phase has a way to go. Retail- Ditto Druggies- Hunchback may
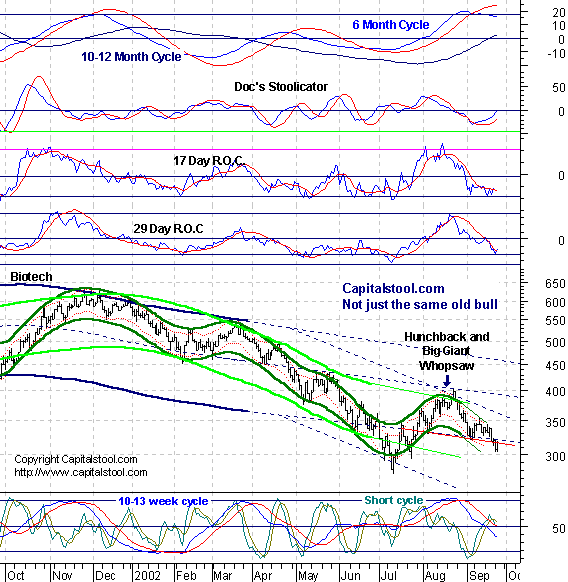
return to scene of crime before heading lower. Biodrech- Hunchback returns
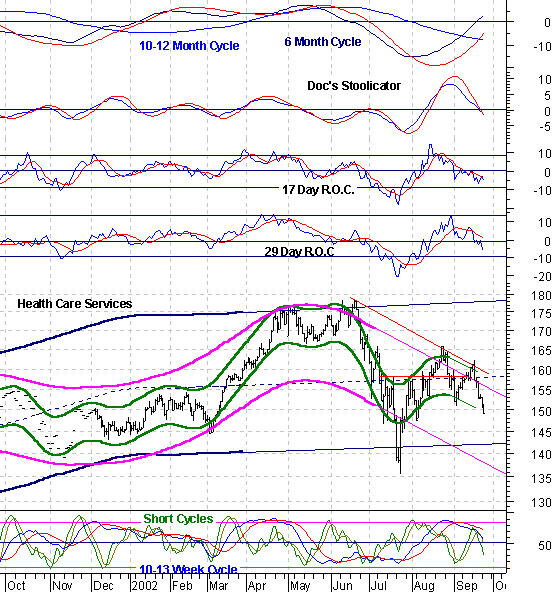
to scene of crime, will flee farther south. Preying on the Sick and
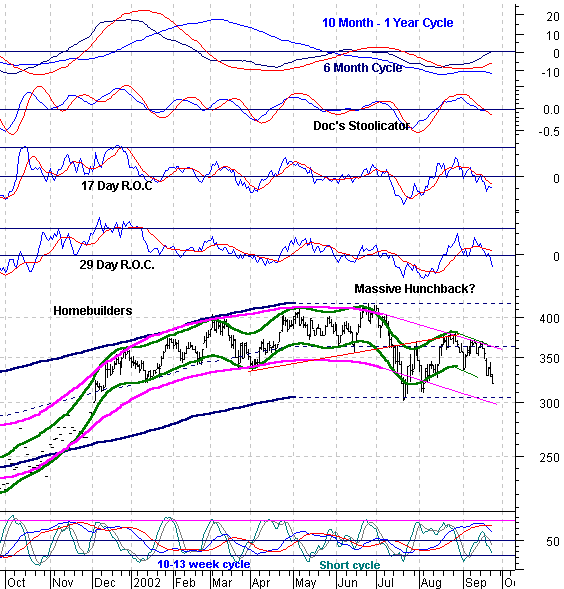
Helpless-Public hates HMO's. Get no sympathy from investors now either. Housing Bubble-
Forming massive top. Completes at 300, bounces then breaks down. Not Much Energy - No
demand. No safe haven. Transvestites- Not popular
with the public. Small Craps- May try to
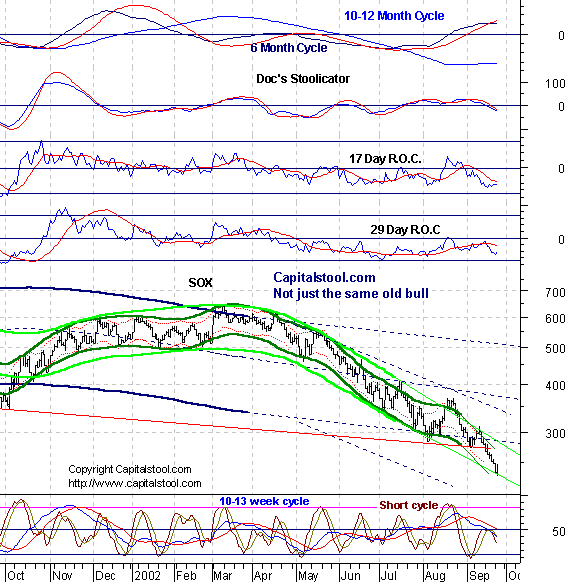
resurface before being flushed. Dirty SOX- No such thing as
support. Only inconsequential bounces on the way to oblivion. Soft Where- Weak bounce
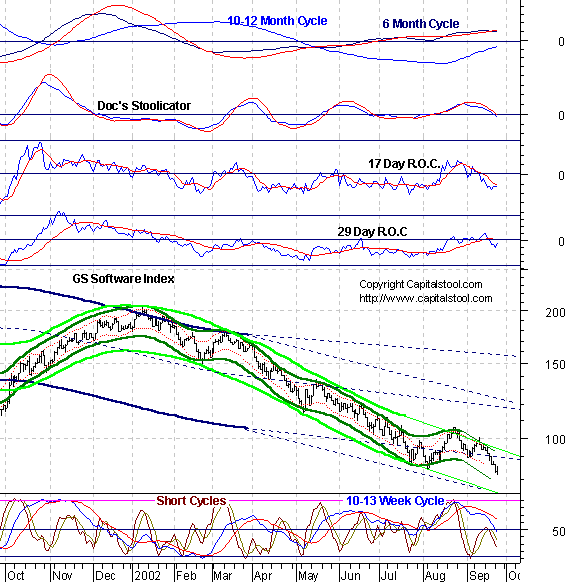
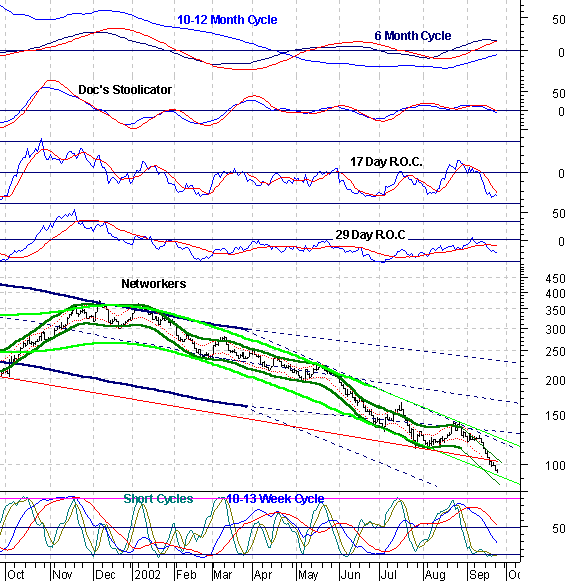
from double bottom, then break down. Nutworkers- Still in the
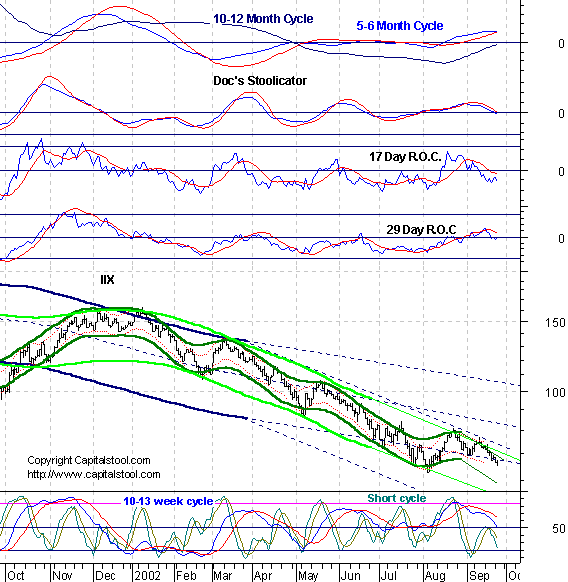
nutcracker. Internuts- Double bottom
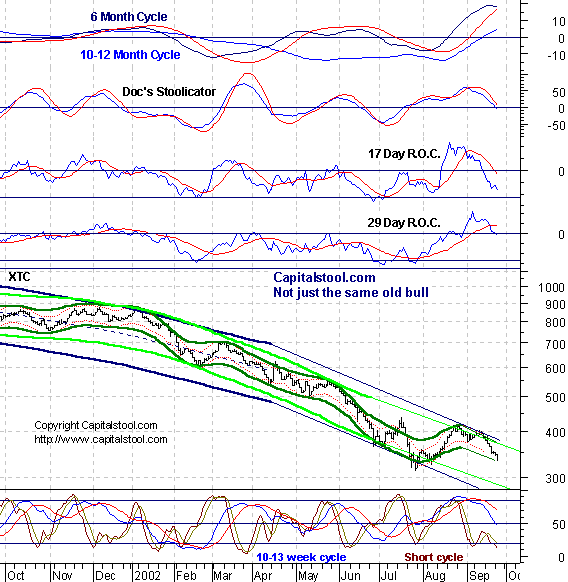
bounce then breakdown. Telecommies- Ditto Stoolwethers Citicorpse- Double bottom
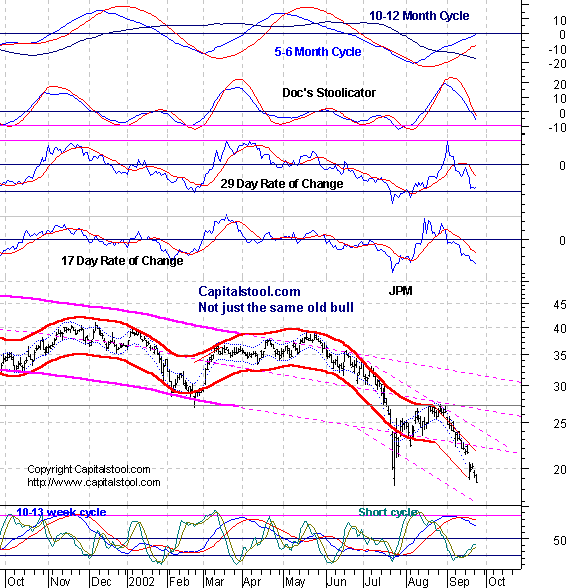
bounce, then lower the casket. JPM- Already dead. Do dead
people bounce? General Custer- Makes last
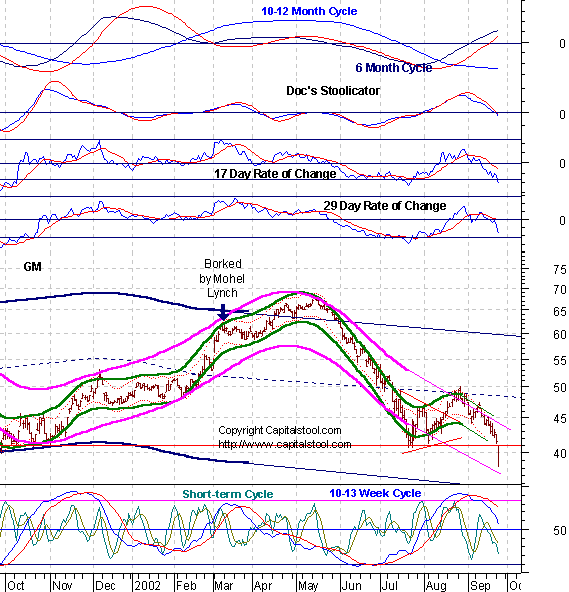
stand at 25. General McClellan- Finally
crosses Potomac. horses drowned. Dead bodies float to surface Soon. Fat Ass- Gets a little
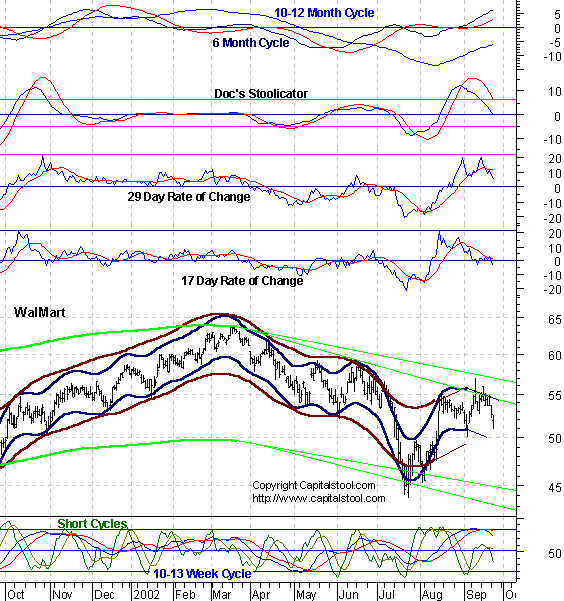
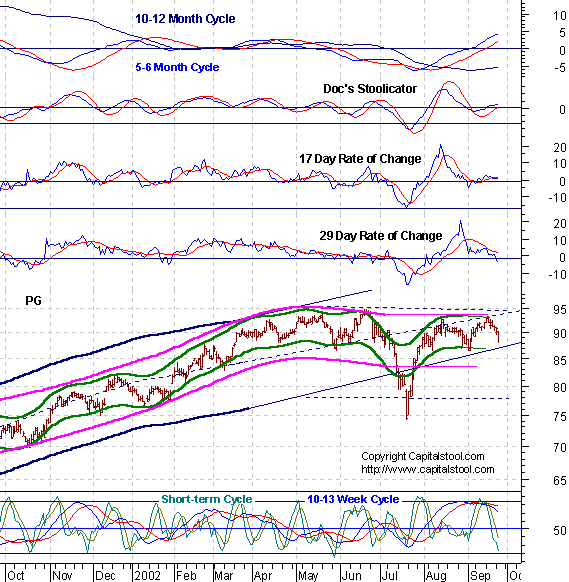
bounce, or else collapse. Or both. Wally- Building a top. Give
it time. PiG- Ditto Market Maker Mafia- Busted! AhOL- Big stinker floats
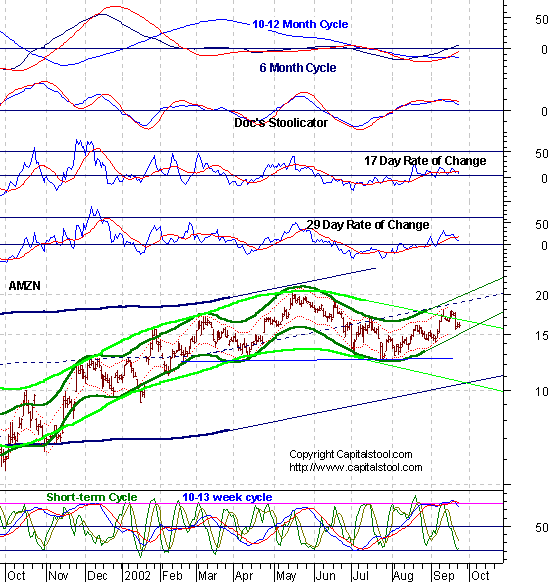
awhile longer. Amazin- Bears
biggest aggravator. (Audio) Mr. Bill - Another triangle
breakdown. Bill will return to scene of crime before fleeing south. Tell- More downside ahead,
but could return to scene of crime first. Crisco- Slides toward level
formerly known as support, but there's no such thing in a bear market. Farmer in the Dell- But not
for much longer. Barn door covered with poop.
See you in Intraday Stool. Dr. Stepan N. Stool Share your thoughts on the Stool Pigeons Wire.
Renewals Welcome, and thank you for subscribing to the Anals of Stock Proctology. Your trial subscription will run for 90 days. At the end of that period your subscription will renew automatically, unless you cancel. If you wish to cancel your subscription use the button below. If you want to renew your subscription do nothing. Your subscription will renew and your credit card or Paypal bank account will be charged. If you want to renew, be sure your credit card information in your Paypal account is current. Paypal will not renew your subscription if the card has expired! Again, thanks for subscribing!
Explanation of Intraday Commentary-Build charts at http://www.livecharts.com. For custom time bars insert a comma after symbol and number of minutes, e.g. compx,90. This will give you a bar chart of the Nas with 90 minutes per bar. The one day cycle is usually most clear with 8 minute bars and 26/18 stochastics. It varies from day to day. Sometimes 6 minutes works best. Experiment to find the best fit for your trading style, and the market's dominant frequency at the time. The goal here is primarily to monitor the condition of the 8 and 13 day cycles. I typically use 90 minute bars with 26/18 stochastics for the 13 day cycle proxy on the indices during regular trading hours. Other cycles use 26/18 stochastics with the following: 8 days- 60 minute bars On the 24 hour futures charts, use a time per bar approximately 3 to 4 times the above number of minutes, to represent the cycles listed above. ABBREVIATIONS: cma: centered moving average
|
|||||||||||||||||||||||||||||||||||||||||||||||||||||||||||||||||||||||||||||||||||||||||||||||||||||||||||||||||||||

![[Most Recent HUI from www.kitco.com]](http://www.weblinks247.com/indexes/idx24_hui_en_2.gif)
![[Most Recent XAU from www.kitco.com]](http://www.weblinks247.com/indexes/idx24_sp500_en_2.gif)
![[Most Recent Quotes from www.kitco.com]](http://kitconet.com/charts/metals/gold/t24_au_en_usoz_2.gif)