|
Archives 12/30/01, 1/1/02, 1/2/02, 1/3/02, 1/4/02, 1/7/02, 1/8/02, 1/09/02, 1/10/02, 1/11/02, 1/14/02, 1/15/02, 1/16/02, 1/17/02, 1/18/02, 1/22/02, 1/23/02, 1/24/02, 1/25/02, 1/28/02, 1/29/02, 1/30/02, 1/31/02, 2/1/02, 2/4/02, 2/5/02, 2/06/02, 2/7/02, 2/9/02, 2/11/02, 2/12/02, 2/13/02, 2/14/02, 2/16/02, 2/19/02, 2/20/02, 2/21/02, 2/23/02, 2/25/02, 2/26/02, 2/27/02, 2/28/02, 3/1/02, 3/04/02, 3/05/02, 3/06/02, 3/7/02, 3/10/02,3/11/02, 3/12/02, 3/13/02, 3/14/02, 3/15/02, 3/18/02, 3/19/02, 3/20/02, 3/21/02, 3/22/02, 3/25/02, 3/26/02, 3/28/02, 3/30/02 4/1/02, 4/2/02, 4/3/02, 4/4/02, 4/6/02, 4/8/02, 4/9/02, 4/10/02, 4/11/02, 4/13/02, 4/15/02, 4/16/02, 4/17/02, 4/18/02, 4/20/02, 4/22/02, 4/23/02,4/24/02,4/25/02, 4/26/02, 4/27/02, 4/29/02, 4/30/02 5/01/02, 5/2/02, 5/4/02, 5/6/02, 5/07/02, 5/8/02, 5/09/02, 5/10/02, 5/13/02, 5/14/02, 5/15/02, 5/16/02, 5/17/02, 5/20/02, 5/21/02, 5/22/02, 5/23/02, 5/24/02, 5/28/02, 5/29/02, 5/30/02 6/01/02, 6/3/02, 6/4/02, 6/5/02, 6/6/02, 6/7/02, 6/10/02, 6/11/02, 6/12/02, 6/13/02, 6/14/02, 6/17/02, 6/18/02, 6/19/02, 6/20/02, 6/22/02, 6/24/02, 6/25/02, 6/26/02, 6/27/02, 6/30/02 7/1/02, 7/4/02, 7/5/02, 7/11/02, 7/14/02, 7/15/02, 7/16/02, 7/17/02, 7/18/02, 7/19/02, 7/22/02, 7/23/02, 7/24/02, 7/25/02, 7/27/02, 7/29/02, 7/30/02 8/1/02, 8/3/02, 8/5/02, 8/6/02, 8/7/02, 8/8/02, 8/10/02, 8/12/02, 8/13/02, 8/14/02, 8/15/02, 8/16/02, 8/19/02, 8/20/02, 8/21/02, 8/22/02, 8/23/02, 8/26/02, 8/27/02, 8/28/02, 8/29/02, 8/30/02 9/3/02, 9/4/02, 9/5/02. 9/6/02, 9/9/02, 9/10/02, 9/11/02, 9/12/02, 9/13/02, 9/16/02, 9/17/02, 9/18/02, 9/19/02, 9/20/02, 9/23/02, 9/24/02, 9/25/02, 9/26/02, 9/27/02, 9/30/02 10/1/02, 10/2/02, 10/3/02, 10/4/02, 10/7/02, 10/8/02, 10/9/02, 10/10/02, 10/11/02, 10/14/02, 10/15/02, 10/16/02, 10/17/02, 10/18/02, 10/21/02, 10/22/02, 10/23/02, 10/24/02, 10/25/02, 10/28/02, 10/29/02, 10/30/02, 10/31/02 11/1/02, 11/4/02, 11/5/02, 11/6/02, 11/7/02, 11/8/02, 11/11/02, 11/12/02, 11/13/02, 11/14/02, 11/15/02, 11/18/02, 11/19/02, 11/20/02, 11/21/02, 11/22/02, 11/25/02, 11/26/02, 11/27/02, 11/29/02 12/2/02,
12/3/02, 12/4/02,
12/5/02 1/1/03, 1/2/03, 1/03/03, 1/6/03, 1/7/03, 1/8/03, 1/9/03, 1/10/03, 1/13/03, 1/14/03, 1/15/03, 1/16/03, 1/17/03, 1/21/03, 1/22/03, 1/23/03, 1/24/03, 1/27/03, 1/28/03, 1/29/03, 1/30/03, 1/31/03 2/3/03, 2/4/03, 2/5/03, 2/6/03, 2/7/03, 2/10/03, 2/11/03, 2/12/03, 2/13/03, 2/14/03, 2/18/03, 2/19/03
 Doc's view of the Street. |
The Anals of Stock ProctologyPublished weeknights by
8:30PM Happy Acres, Florida Time The American
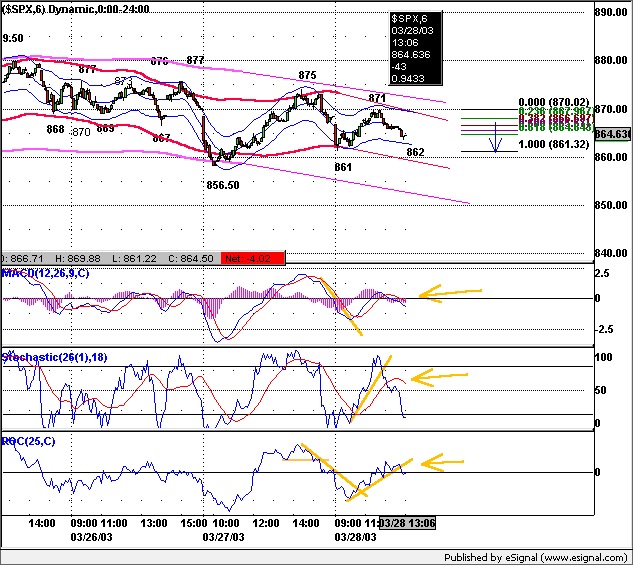
Academy of Stock Proctology and Is your subscription up for renewal? If you want to renew, do nothing, unless your credit card has expired. Please be sure your credit card info is current. If your credit card has expired, you must enter the new expiration date in your Paypal account in order for your subscription to be processed. If you subscribed via Paypal, your subscription will be renewed for one year on the 90 day anniversary of your sign-up and your credit card will be charged. If you want to cancel, use the button at the bottom of the page. This applies only if you subscribed through Paypal. Mailed-in subscriptions are for 1 year. If you subscribed by prior contribution, I will send you a notice before your subscription expires. If you have any questions, see the subscription page and FAQ's. If you can't find the answer, email me. Big Fine Print Doc does not make trading recommendations. This update reports time cycle estimates and centered moving average projections based on the Hurst cycle analysis method, and other techniques. This publication is for entertainment and educational purposes only. Doc assumes no responsibility for the accuracy or inaccuracy of the estimates and projections presented. The market may or may not meet the projections. Stoolies should thoroughly familiarize themselves with the methodology before trading based on this method. Those who do not have the time or inclination to develop a trading strategy based on testing and research should not trade. Trade at your own risk. Yadda yadda. How's your motha? More disclaimers at the bottom of the page. Intraday Updates 2/21/03 12:45 PM Today's market is noise driven, both from the refinery explosion and opex. The market was ready for a 3-5 day cycle low and we got it. Upside cmaps are still within the recent trading range. Cycle times are irrelevant doe to unwinding of options hedges, pinning prices at strike etc. Monday will be more of the same. The rally "feels" like the 6-7 week cycle blowoff. Possible 1 day cycle high now under way. Chart below. Get regular updates throughout the day in Stooltrading. 9:15 AM Fucutures were mostly flat overnight, closing the pre-market session around 838-839, which is their overnight upside cmap. Look for a brief, small pop into the 1 day cycle high retest soon after the opening. The 5 hour and 1 day cycle lows would be due around 12:30 and 2 PM. We all know about scam week, and that cycles often do not work this week in particular, so Doc will continue to focus on cmaps. Overall, not much change from how things looked last nigh. (See below) Intraday Turdsday - The market opened firm, making its high around 10 AM. That was expected. So was the drift down into 1 day cycle lows at 2:00 and 3:30. The SPX hit the cmap of 837 at the low, but didn't quite get to the 834 cmap. It should tomorrow. Although Doc got lucky on the cycle timing today, the intraday cycles remain murky because of scam week. Doc thinks the sideways move from 2 PM was a 5 hour cycle swup that topped out at 3:45. If the 5 hour wave persists, then the low will be around 12:30 Friday. However, there's a good chance of a 1 day cycle high again near the open. It won't last long or get far. Pre Market Update at 9:15 AM NY time. Get StoolieSignal Special offer here only! The cycle map below is en estimate of how the market might behave over the next few hours. Should the pattern be broken, the map should be redrawn to fit the actual. Cmaps and times shown are guidelines only. Cycles vary in wavelength and amplitude. Directional changes within an hour of the expected turn and a few points of the cmap should be respected. The indicators rule. Times and prices are the projected cycle highs and lows with cmaps. 5-8 Day Cycle______ 2-3 Day Cycle_______ 5 Hr-1 Day Cycle
Turdsday's
Markets A Very Special Day 2/20/03 Today is indeed a very special day, stoolies. It is one of the few days each year when we have a combined MoGauge Day and Fed Turdsday all wrapped up in one. Oh, the joy! Can you feel it? First, the MoGauge, that most special of leading indicators brought to you direct from the MoGauge Bankers Ass. of America, a finer group of upstanding citizens you couldn't meet. They make stock borkers look like Sunday school teachers. But that's beside the point. They do provide us with what may well be the most important data of all, next to the stock market itself, a veritable leading indicator of money supply and liquidity. The MoGauge is the weekly Mortgage Applications Index released by the MoGauge Bankers Ass. of America. Mortgage applications get funded about 4-8 weeks after the application is taken. When the GSE's hold those loans in their portfolios, they then turn into money through the magic of money market fund intermediation. Broad money supply grows, and that flows into the markets and economic activity. Likewise, when mortgage activity declines, money growth slows or even goes negative. In effect, the MoGauge has the potential of telling us to what degree money will be added to the system in a month or so. Big jumps in the MoGauge tend to be followed by big stock market rallies along with big jumps in money supply. When these bulges subside, the market follows a month or two later. Last week the overall data was flat, and still at a high level, certainly enough to keep things from falling apart just yet. There was a lot of volatility through December but since then, they have remained high and stable. Looking a little closer at a breakdown between new purchase applications and refi's, the picture is similar. Overall, both purchases and refi's remain in mild downtrends, while mortgage rates are at record lows. Demand is on the wane in spite of bargain basement money costs. If rates rise, refi demand will collapse. Given that refi's are 70-75% of the market, that's where push will come to shove. The refi boom has been the engine of financial market liquidity. Once it collapses, it will take all markets and the economy with it. The Fed knows this, and is choreographing a frenzied complex pas de deux with the markets to keep long term rates from rising.
MZM, a broad measure of money, was down in the week ended 2/10. M3, not shown, was up slightly. Growth in broad measures of money has slowed radically since late November, which was about one month after the peak in mortgage applications. No surprise there. They can't keep it pumped up unless they can force long term interest rates substantially lower. The bond market tidal wave of treasury and corporate supply, along with the weak dollar and capital flight, and that little matter of inflation fear, will not let them do that. Mortgage demand at current interest rate levels is shrinking. When rate starts to uptick, demand will collapse, sending broad money supply into a tailspin. The markets will seize up. This is the real issue facing the Fed. Everything else is a diversion.
Doc said last week that
the spike in M1 would be quickly unwound, because of Feed draining in
the week following February 3. Sure enough, M1 dropped like a stone the
following week. Checking accounts are back to zero growth over the past 15
months. This is the level at which business is done. No growth. Zip.
Zilch. They can't pump it up. Total bank credit rose in the week ended 2/5, but almost all of the increase was due to purchases of
securities. Gummit and corpse bond issuance was heavy that week.
Loans were up, but still flat over the last two months. Now that the
ABS market is having widely publicized problems, weaker credits are in big
trouble. This is just one of a myriad of things pressuring liquidity and
money growth. C&I loan remained moribund,
falling sharply again in the week ended February 5. A combination
of weak demand and tight credit. Commercial paper data is up to
the minute. It upticked but remains in a downtrend. The fading mortgage bubble is the last line of defense between here and oblivion. Once it begins to falter, as the Fed becomes increasingly impotent in manipulating long term interest rates lower, the game is over. Funny thing is, now that the
inflation issue has reached the public consciousness through the whopping
WPI increase, raw materials increases, may, with emphasis on
"may", be ready to be take a breather and consolidate of
awhile. It matters not. The public and bond traders will now have something else to worry about. Every bit of news will now be viewed with an eye toward its potential impact on inflation. Sooner or later, that's going to make the bond markets very nervous. The time when bond buyers can remain in denial is growing short. Doc's Pooper Scooper. Be a Johnny Applestool! Help spread the Stool! Feel free to repost snippets from the Anals on message boards around the web. Just give a link back! Many tanks - Doc The Feed drained $5 billion. They added $2.499 billion in semi-permanent money with a bill pass, $5 billion in 28 day repos and $10.25 billion in overnight repos. $9 billion in overnight repos, $9.5 billion in 7 and 8 day repos, and $4 billion in 28 day repos expired. The only expiration scheduled for Friday is the $10.25 billion in overnight repos. The unwinding of Snowzilla, that giant fire breathing Feed whose footsteps in the snow shook the markets Tuesday, continued Turdsday. Doc thought Snowzilla was related to the weather in the Northeast, and in New York in particular, not to some intention by the Fed to jam the markets. Bank transaction clearing operations and market making activities were severely curtailed by the storm. Doc expected that, that being the reason, the move would be completely unwound over the next couple of days. So far so good. Two
trends are evident on the Feed Index, which is the total Fed holdings of
loans and securities. One is the 10% growth trend beginning in May of
2001. The blue channel going back to last December suggests a 5% growth rate. Look at the 4 week moving
average (brown line) and compare it with the slope of the two larger
channels for an indication for whether the slope of short term growth is
slower or faster than the 2 longer term trends. The longer term in the Feedometer is down, suggesting that Al is less inclined to pump excess Feed into the system in order to jam the markets. This is one of the key reasons Doc does not think that Snowzilla had a more nefarious purpose. He should soon melt from our memories as just a bad day. One of your fellow stoolies also pointed out Wednesday in IDS, (sorry I forgot who, but in your heart you know you're right. ;-)) that when the Feedometer reaches the top of the gold channel, the stock market tends to doink. Could be because Al has used up all his bullets, and has to call in some chips. The
Feedometer theoretically measures excess Feed available for bond or stock
market jamming. Al selects a trend level he feels is needed to reflatulate
the economy. The Feedometer measures the difference between the apparent
trend target, and actual day to day Feeding (Fastow Feedometer), as well
as a four week moving average (Slowmo Feedometer). A break above the
orange trendline might indicate a more aggressive jamming policy. 10 Year Bond yields declined
again on news of weak cheesesteak, scrapple, and soft pretzel sales, in
Philly. (mmmmm.. scrapple) Short term and intermediate cmaps dropped to the 3.75-3.65 range, suggesting
that the December low will be retested before the expected major trend reversal. Oscillators and momentum indicators remain mixed suggesting
the market is not ready for a big move in either direction. Dow Inflatables- The
13 day cycle turned down. The 4-7 week cycles' composite indicator also
looks toppish, and the 10-13 week cycle indicator has held its ground for
the time being. This configuration has enormous bearish potential. Another down day breaking below 7800 in the next couple of days will
seal the verdict. Guilty. Down to the low 7000 range for a 10-13 week
cycle low next month. On the other hand, if they can hang around
8000, the 13 week cmap will rise. All of Doc's daily cycle charts
are powered by METASTOCK Portfolio Sphincters Index (SPX) and Sentiment Cycle Chart Short Term Cycles The short cycle oscillator downticked in the distribution (aka overbought) zone. This is the first sign of rigor mortis setting in. The 6-7 week cycle swup has 3-8 days to go. It may not last that long. Upside cmaps were hit. Unless this thing is Fronkenshteen, it's not coming back to life. The 6-7 week cycle oscillator on the chart below is still rising sharply as is the 17 day rate of change. They are signaling a swup that isn't quite over. It usually takes several days of distribution to reverse momentum indicators in this situation. A late downturn, particularly from around the zero line by the 17 day ROC would be extremely bearish. But as long as the indicators are up, it's wise to be a bit cautious. That means using reasonable stops to protect against surprises. 10-13 Week Cycle Roughly 3 to 6 weeks should remain in the 10-13 week cycle down phase. The cycle oscillators upticked but the 29 day ROC did not confirm. If all indicators for this cycle turn up then we need to reconsider this cycle's phase. More likely, the cycle indicators will bounce around at a low level while the market continues to downtrend. This is a judgment call involving looking not just at the indicators but the price chart as a whole. As Simple Guy might say, stand back from the monitor and look at the whole picture. The preliminary downside cmap for this cycle has fallen slightly to 795. There's still plenty of time for this to change. Sentiment VIX rose. (down on the inverted scale chart). In the context of the current cycle, the reading is neutral to bearish. Touching the inner channel line often indicates a short term top, or confirms a downtrend. The next significant intermediate cycle low should reach at least 50-60. A reading in the low 30's would be a renewal of the intermediate sell signal.
The 17 day rate of change is a proxy for the
6-7 week cycle. The 29 day rate of change is a proxy for the 10-13 week
cycle. The blue line overlaid on the price chart is the 10-13 week cycle
oscillator, while the red line is the 6-7 week cycle oscillator. The VIX
is a measure of implied options volatility reflecting relative fear or
complacency. It is plotted below on an inverse scale to better show the
relationship to the price chart. The "Stool Bands" may reflect
either 6 month or 10-12 month cycles. The Cycle Conditions tables include cycle phase and a wild guess as to number of periods to the next turn, in days for the shortest cycles, weeks (W) or months (M) for the longer ones. This is a fluid exercise, in other words, the projections are likely to be wrong, but they force us to be vigilant for key turning points, and frequently work well enough to prevent costly misreadings. SPX Cycle Conditions as of 2/20/03
PTT - Periods Till Turn Suctor Watch and Stoolwethers- Updated each morning between 8 AM and 9:00 AM NY time. Nasgap Charts The Nas is expected to behave more like the SPX with the continued de-weighting of tech. In the interest of publishing the Anals earlier in the evening Doc is presenting the charts and data without commentary, as it is largely redundant relative to the SPX commentary above. Cycle Chart Nasdaq Cycle Conditions as of 2/19/03
PTT
- Periods Till Turn Suctor Watch and Stoolwethers- Updated each morning between 8 AM and 9:00 AM NY time. Long Bong Hit - See top of page. Golden Stool 2/20/03 PM Gold rose for the
second day since the chain reaction margin wipeout hit its low.
Short cycle cmaps held at 340-345 on a closing basis. Long term upside cmaps have come down, now at only
375 - 385.
The 9 month cycle oscillator looks like a top but the down phase should be
sideways. Short cycle lows are due
this week, and the short cycle oscillator is in the bottoming zone. Doc
thinks accumulation will renew here, but that a trading range of 345-385 could
last for months, or longer.
Long Term HUI Dumpty rallied again. Short cycles have turned up but probably won't get far right away. The initial cmap is 143. The 4 month (or 13 week, take your pick) cycle looks like it has bottomed after hitting a downside cmap of 133. Both short cycle and the 13 week cycle oscillators are in the bottom/accumulation zone. HUI Cycle Conditions as of 2/20/03
Uncle Buck's Illness In spite of the best efforts of his central bank nurses, Uncle Buck would not stay up again on Turdsday. He barely reached short cycle upside cmaps at 101 and short cycles have now turned down. Buck may be topping out a 13 week cycle swup. Chart as of 2/20/03 close Uncle B and SPX (gray line on chart)
usually move together because Uncle Buck's index measures the flow of
capital into and out of US paper assets. The relative magnitude of the
moves varies and wide divergences are followed by convergence.
Central banks intervening to buy dollars are not
going to help stock prices, and cannot drive sustainable advances in the
dollar.
Longer term, Buck is going much lower. Get StoolieSignal Special offer here only! Suctor Watch and Stoolwethers- Now posted on separate page. Updated each morning between 8 AM and 9:00 AM NY time. See you in Intraday Stool. Dr. Stepan N. Stool Share your thoughts on the Stool Pigeons Wire.
Renewals Thank you for subscribing to the Anals of Stock Proctology. Your trial subscription will run for 90 days. At the end of that period your subscription will renew automatically, unless you cancel. If you wish to cancel your subscription use the button below. If you want to renew your subscription do nothing. Your subscription will renew and your credit card or Paypal bank account will be charged. If you want to renew, be sure your credit card information in your Paypal account is current. Paypal will not renew your subscription if the card has expired!
Explanation of Intraday Commentary-Build charts at http://www.livecharts.com. For custom time bars insert a comma after symbol and number of minutes, e.g. compx,90. This will give you a bar chart of the Nas with 90 minutes per bar. The one day cycle is usually most clear with 8 minute bars and 26/18 stochastics. It varies from day to day. Sometimes 6 minutes works best. Experiment to find the best fit for your trading style, and the market's dominant frequency at the time. The goal here is primarily to monitor the condition of the 8 and 13 day cycles. I typically use 90 minute bars with 26/18 stochastics for the 13 day cycle proxy on the indices during regular trading hours. Other cycles use 26/18 stochastics with the following: 8 days- 60 minute bars On the 24 hour futures charts, use a time per bar approximately 3 to 4 times the above number of minutes, to represent the cycles listed above. About centered moving average projections. ABBREVIATIONS: cma: centered moving average |


![[Most Recent HUI from www.kitco.com]](http://www.weblinks247.com/indexes/idx24_hui_en_2.gif)
![[Most Recent XAU from www.kitco.com]](http://www.weblinks247.com/indexes/idx24_sp500_en_2.gif)
![[Most Recent Quotes from www.kitco.com]](http://kitconet.com/charts/metals/gold/t24_au_en_usoz_2.gif)