|
Archives 12/30/01, 1/1/02, 1/2/02, 1/3/02, 1/4/02, 1/7/02, 1/8/02, 1/09/02, 1/10/02, 1/11/02, 1/14/02, 1/15/02, 1/16/02, 1/17/02, 1/18/02, 1/22/02, 1/23/02, 1/24/02, 1/25/02, 1/28/02, 1/29/02, 1/30/02, 1/31/02, 2/1/02, 2/4/02, 2/5/02, 2/06/02, 2/7/02, 2/9/02, 2/11/02, 2/12/02, 2/13/02, 2/14/02, 2/16/02, 2/19/02, 2/20/02, 2/21/02, 2/23/02, 2/25/02, 2/26/02, 2/27/02, 2/28/02, 3/1/02, 3/04/02, 3/05/02, 3/06/02, 3/7/02, 3/10/02,3/11/02, 3/12/02, 3/13/02, 3/14/02, 3/15/02, 3/18/02, 3/19/02, 3/20/02, 3/21/02, 3/22/02, 3/25/02, 3/26/02, 3/28/02, 3/30/02 4/1/02, 4/2/02, 4/3/02, 4/4/02, 4/6/02, 4/8/02, 4/9/02, 4/10/02, 4/11/02, 4/13/02, 4/15/02, 4/16/02, 4/17/02, 4/18/02, 4/20/02, 4/22/02, 4/23/02,4/24/02,4/25/02, 4/26/02, 4/27/02, 4/29/02, 4/30/02 5/01/02, 5/2/02, 5/4/02, 5/6/02, 5/07/02, 5/8/02, 5/09/02, 5/10/02, 5/13/02, 5/14/02, 5/15/02, 5/16/02, 5/17/02, 5/20/02, 5/21/02, 5/22/02, 5/23/02, 5/24/02, 5/28/02, 5/29/02, 5/30/02 6/01/02, 6/3/02, 6/4/02, 6/5/02, 6/6/02, 6/7/02, 6/10/02, 6/11/02, 6/12/02, 6/13/02, 6/14/02, 6/17/02, 6/18/02, 6/19/02, 6/20/02, 6/22/02, 6/24/02, 6/25/02, 6/26/02, 6/27/02, 6/30/02 7/1/02, 7/4/02, 7/5/02, 7/11/02, 7/14/02, 7/15/02, 7/16/02, 7/17/02, 7/18/02, 7/19/02, 7/22/02, 7/23/02, 7/24/02, 7/25/02, 7/27/02, 7/29/02, 7/30/02 8/1/02, 8/3/02, 8/5/02, 8/6/02, 8/7/02, 8/8/02, 8/10/02, 8/12/02, 8/13/02, 8/14/02, 8/15/02
|
The Anals of Stock ProctologyPublished weeknights by
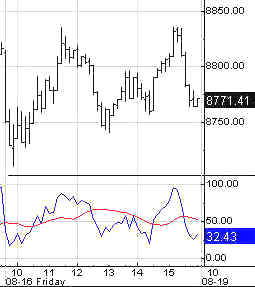
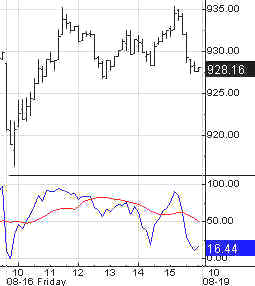
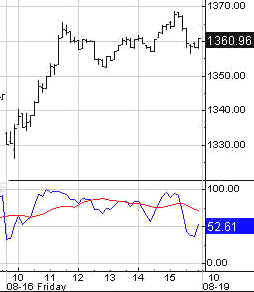
8:30PM Happy Acres, Florida Time The American Academy of Stock Proctology and Is your subscription up for renewal? If you want to renew, do nothing, unless your credit card has expired. Please be sure your credit card info is current. If your credit card has expired, you must enter the new expiration date in your Paypal account in order for your subscription to be processed. If you subscribed via Paypal, your subscription will be renewed for one year on the 90 day anniversary of your sign-up and your credit card will be charged. If you want to cancel, use the button at the bottom of the page. This applies only if you subscribed through Paypal. Mailed-in subscriptions are for 1 year. If you subscribed by prior contribution, I will send you a notice before your subscription expires. If you have any questions, see the subscription page and FAQ's. If you can't find the answer, email me. PM Update 8/19/02 12:45 PM Terms and methodology Sure doesn't look like this sucker's going to pull back. With the Nas breaking through the upper line of an ascending channel, and holding its gain, that is certainly not bearish. It is a sign of an accelerating uptrend. I hate to sound like a broken record, but until there are concrete signs of reversal, I would not want to be short this market. The SPX has yet to break the upper channel line. The two indexes are out of synch at the moment. The Nas needs to reverse, or the SPX needs to break 945 on the upside to get in gear. The 1 day cycle high was due at 11:30 and it appears to be under way. It's possible the down phase will show up as a consolidation, i.e. a sideways down phase, leading to another step up late today or early tomorrow. Could it be a deeper pullback? Anything more than 10 points on the SPX and 20 on the Nas at this point is wishful thinking.
AM Update 8/19/02 11:30 AM Terms and methodology The upside cmaps based on the 1 day cycle are Nas 1385, SPX 947 and NDX 1015. Revised 5 day cycle projections are Nas 1380-1395, SPX 940-960, and NDX 1020. AM Update 8/19/02 8:30 AM Terms and methodology The midnight ride of the fucutures boys is over. They are weakening as they head into the last 45 minutes of trading. Very tough to read the cycles from Friday's manipulations. It looks like the end of day falloff was the 1 day cycle low. However, the 5 hour and 1 day cycles may be juxtaposed. If the 1 day cycle and 3 hour wavelet governs, we'll see an up phase until about 11:30. If the 5 hour cycle governs, whatever strength there is will fizzle, and we'll see weakness until 12:30 or so. In either case, there is not enough movement to project highs and lows outside of Friday's PM ranges. The 5 and 8 day cycles appear to be top building, but there is no sign of a big pullback yet. Can't tell whether the down phase to come will result in a trading range or a drop, but with the 6-7 and 10-13 week cycles up, it's too early to count on a big pullback. Not ideal picture for short selling, that's for sure.
Weak End Anals (8/17/02) It was an exhausting week for stoolies and in general. Unfortunately, Doc doesn't see much change in the weeks immediately ahead. Here's a review of the daily and long term chart action for your your weak end relaxation. For print purposes set your printer on landscape orientation, and make sure you have plenty of ink! The Feed took no action Friday, taking back Thursday's $8.75 billion in overnight repos. Makes you wonder just what the hell Al's doing, doesn't it? There are no rollovers Monday. If that $8.75 billion was in response to the weak cheesesteak, soft pretzel, and scrapple data released by the Philly Fed on Thursday, you would think they would replace the moolah with something a little more permanent. But no, those Indian givers took back every penny of it. (Why do they call them Indian givers, when it was the European settlers that stole everything the Indians had? 'Cuz they got smart and built casinos to take it all back? Anyway...) It leads one to suspect that the money was meant specifically to prop up the markets and prevent a meltdown. When they saw there was no meltdown, they took it back. That's a question not an answer. Of course, we all know the Fed does not intervene in the stock market. The Feed Index, which is the total
of all the Fed's paper holdings, fell back below the lower line of the 10%
growth channel. Is Al just going back to 8% growth, or does he have
something more Draconian in mind. Looking at the last two months only, the
Feederales haven't grown the Feed at all. That's right stoolies, ZERO
growth. The Feedometer,
which theoretically measures excess Feed available for jamming the
market, dipped, maintaining the recent downtrend. They are taking
away the Gang's play money. Why would Al be draining if he didn't suspect
a burst of inflation in the pipeline? Why would he be draining if the
balance of the risks are toward economic weakness? Doc believes the intent
is to restrain the growth of broad money supply, which is exploding with
the reflatulation of the mortgage bubble. Or is it that the market is
doing better, the system is reliquefying, and the Fed is just taking back
some in preparation for the next crisis, when they will need to blast the
system again with piles of cash?
Portfolio Sphincters Index (SPX) and Sentiment
VIX dropped to 32.82. Normally, at a top, VIX stays
between the inner and outer Stool Band on the inverted scale for several weeks before the final
reversal. The entry into that track is the signal that top formation has
begun. The superimposed 6-7 and 10-13 week cycle oscillators, as well
as Rate of Change indicators, are rocketing higher, similar to their
behavior in October, an analogous period cyclically. The end of the rally
is drawing closer, but we're not quite there.
The short cycle oscillator remains at a high level, but is beginning to
roll over. It needs to drop below last week's low to signal a down phase.
Otherwise the bigger cycle up phases rule. The stoolicator and 10-13 week oscillator,
as well as the 6 month cycle oscillator
confirm the uptrend. Prices are near the top of the 10-13 week (teal) and
10-12 month (dark blue) cycle projection. If the rally dies here, the
slope of the up phase would be relatively flat, and we can safely consider
putting on short positions for a run down to the lower portion of the
channel. One the other hand, if the top blows out here, then the rally is
only half over. We'd be looking at at least 980, or, a worst case of 1040
in another month or two. As you can see from the yellow lines on the
chart, now would be a perfect time for the 10-13 week cycle high. But it
could come later, as much as 6 weeks later.
Fiber Nacho Upchuck Levels The 6 month cycle has turned
up. Prices have reached the centerline regression projection of the 4 year
cycle channel (green). When that happens, they either reverse and resume
the dominant trend, or they break through and test the upper line of the
18 month-2 year cycle (brown), around 980. The downtrending secular trend
(pink) would not even be called into question until an upside break of
1100. That's not in the cards any time soon. Those who have called a bear
market bottom, which is virtually everyone who appears on Crapvision, are
talking out of their backsides, as usual. The Cycle Conditions tables include cycle phase and a wild guess as to number of periods to the next turn, in days for the shortest cycles, weeks (W) or months (M) for the longer ones. This is a fluid exercise, in other words, the projections are likely to be wrong, but they force us to be vigilant for key turning points, and frequently work well enough to prevent costly misreadings. SPX Cycle Conditions as of 8/16/02
PTT - Periods Till Turn Nasgap Charts The 6 month cycle oscillator rose and the slower 10-12 month cycle oscillator appears to be flattening out of its downward trajectory. There's now enough data for the first very preliminary upside cmap for the 6 month cycle. The projected high is 1445 in about 2 months. The target is very preliminary, but it gives some idea of how high this may go in the event it's for real. These cycles are represented by the dark blue and light green channels on the price portion of the chart. The upturns in shorter oscillators continued, with the exception of the 29 day rate of change which remains paused. The long term trend of declining momentum peaks is broken, a sign that the 6 month killer wave has turned up. The slope of the phase is still not clear. It's positive, but we don't know how positive. If you're in puts (ptuey!!! ptuey!!!) your biggest problem may not be price but time. That preliminary target of 1445 night be reached in two weeks, or six weeks. Or the market could stay range bound around 1350 for two months. Not likely.
The 10-13 week and short cycle oscillators rose again. They used to say
don't fight the tape. To Doc that means honor the indicators. They haven't
said "sell" yet.
Fiber Nacho Reflux Levels: Busy busy. The woodchuck eats.
On the long term chart, the Nasty bounced off the lower secular trend
channel projection (pink), and is hugging the center line of the 4 year
cycle projection (green). The issue of the 4 year cycle low needs to
be in the back of our minds. Keep an eye on those long term cycle
indicators. They remain bearish. Nasdaq Cycle Conditions as of 8/16/02
PTT
- Periods Till Turn Golden Stool The 4 week
and 13 day cycles are in sideways down phases. Launch preparations
are underway but there will be more base building, for at least a week. HUI's long
term chart remains constructive, with the intermediate cycle oscillator on
the launch pad as the countdown to liftoff proceeds. Whether the coming
move can blow out the top of the secular trend channel is unknowable at
this point. Likewise it
may take months before the gold price can take out the 330 area. This
trend could consolidate for months, even a year or more. Gold bugs will
need to be patient. AM Edition Features (Previous) These features are in morning edition, published around 9 AM ET US, or the Saturday Weak End Edition, published, uh, let's see, Saturday! Doc still likes the action here for a long term bottom, as the long term cmap of 4% was hit, the long term lower channel line was busted, and there was a helluva Whopsaw. (New stoolies- a Whopsaw is a whipsaw only bigger. It's when the market shows major breakout, sucks everybody in, then reverses and strands the suckers.) The variant on the chart below is one of Dr. Stool's rare chart patterns. It is called the Hanging Chad formation. This formation is so rare, and so powerful, that it has the ability to change the outcome of a national election.
Alas, it's not yet clear on
the long term chart that this is a reversal. The intermediate cycle
oscillator is hinting at it, but more of a turn is needed. Uncle Buck's Illness Uncle Buck is nearing a
short cycle low, while beginning to top out the up phase of the
intermediate cycle. Looks like a down-up sequence to finish it off, then a
bigger down to follow in a few weeks. The longer term looks range
bound, with the chart showing that the 6 month cycle is bottoming. Buck
may settle into a 104-109 trading range for many months. There's nothing
for the dollar to collapse against. The rest of the world's major
currencies aren't much better off. The financials
have tremendous volatility in an unstable financial system, but in spite
of the biggest spreads and lowest interest rates in history, the secular
trend is down. Extreme cyclical irregularity makes this sector risky and
unpredictable for trading purposes. The 800 area is the confluence of
numerous lines of resistance. The intermediate cycle oscillator is in bottom
area. It can recover, while the index moves sideways. The bubble
du jour (home building) looks toppy on a long term basis, but intermediate
wants to turn up. The
intermediate up phase in the consumer index hits heavy overhead supply
here and should pull back before attacking 530-540. Drugs-
intermediate upturn runs into heavy supply. Energy has intermediate bottom but should congest around the trend's center line.
Retail also
in intermediate low, but has big resistance at 300-310. SOX are
bouncing off secular trend support lines. Still has some believers. The up
phase could play out as a trading range from 300 to 400 that lasts the
better part of a year, or it could die after a short spike toward
the center line of the trend. There's another alternative. The "up
phase" doesn't turn up, in absolute terms. See the charts below. Soft Where
is an example of an up phase that doesn't go up. Massive overhead supply
in a sector in a death plunge. Software is a commodity, and like air, the
supply is unlimited, and for the most part, free. No matter
how efficient and big they are, the nutworkers are running on a
treadmill-- down. This is another example of intermediate up cycles which
don't turn up, the secular trend is so powerful. The small
craps get a small intermediate term bounce, but have big overhead supply
to contend with. The General
returns to the scene of the crime. Should form congestion area around
center line of major cycle (green). If it breaks that, it will run to 35. IBM should
also run into trouble at the center line of the trend, but would run to 85
if broken. Mr. Bill has
actually been in a sideways up phase for 3 months with a peak due any
time. The 51-53 area should be impenetrable. Wally
bounced off intermediate low and could ultimately run to high 50s. See you in Intraday Stool. Dr. Stepan N. Stool Share your thoughts on the Stool Pigeons Wire.
Renewals Welcome, and thank you for subscribing to the Anals of Stock Proctology. Your trial subscription will run for 90 days. At the end of that period your subscription will renew automatically, unless you cancel. If you wish to cancel your subscription use the button below. If you want to renew your subscription do nothing. Your subscription will renew and your credit card or Paypal bank account will be charged. If you want to renew, be sure your credit card information in your Paypal account is current. Paypal will not renew your subscription if the card has expired! Again, thanks for subscribing!
Explanation of Intraday Commentary-Build charts at http://www.livecharts.com. For custom time bars insert a comma after symbol and number of minutes, e.g. compx,90. This will give you a bar chart of the Nas with 90 minutes per bar. The one day cycle is usually most clear with 8 minute bars and 26/18 stochastics. It varies from day to day. Sometimes 6 minutes works best. Experiment to find the best fit for your trading style, and the market's dominant frequency at the time. The goal here is primarily to monitor the condition of the 8 and 13 day cycles. I typically use 90 minute bars with 26/18 stochastics for the 13 day cycle proxy on the indices during regular trading hours. Other cycles use 26/18 stochastics with the following: 8 days- 60 minute bars On the 24 hour futures charts, use a time per bar approximately 3 to 4 times the above number of minutes, to represent the cycles listed above. ABBREVIATIONS: cma: centered moving average |
||||||||||||||||||||||||||||||||||||||||||||||||||||||||||||||||||||||||||||||||||||||||||||||||||||||||||||||||||||||

![[Most Recent HUI from www.kitco.com]](http://www.weblinks247.com/indexes/idx24_hui_en_2.gif)
![[Most Recent XAU from www.kitco.com]](http://www.weblinks247.com/indexes/idx24_sp500_en_2.gif)
![[Most Recent Quotes from www.kitco.com]](http://kitconet.com/charts/metals/gold/t24_au_en_usoz_2.gif)