|
10 Minute Bar Charts 6/17/02 Dow Jokes Inflatables
Archives 12/30/01, 1/1/02, 1/2/02, 1/3/02, 1/4/02, 1/7/02, 1/8/02, 1/09/02, 1/10/02, 1/11/02, 1/14/02, 1/15/02, 1/16/02, 1/17/02, 1/18/02, 1/22/02, 1/23/02, 1/24/02, 1/25/02, 1/28/02, 1/29/02, 1/30/02, 1/31/02, 2/1/02, 2/4/02, 2/5/02, 2/06/02, 2/7/02, 2/9/02, 2/11/02, 2/12/02, 2/13/02, 2/14/02, 2/16/02, 2/19/02, 2/20/02, 2/21/02, 2/23/02, 2/25/02, 2/26/02, 2/27/02, 2/28/02, 3/1/02, 3/04/02, 3/05/02, 3/06/02, 3/7/02, 3/10/02,3/11/02, 3/12/02, 3/13/02, 3/14/02, 3/15/02, 3/18/02, 3/19/02, 3/20/02, 3/21/02, 3/22/02, 3/25/02, 3/26/02, 3/28/02, 3/30/02 4/1/02, 4/2/02, 4/3/02, 4/4/02, 4/6/02, 4/8/02, 4/9/02, 4/10/02, 4/11/02, 4/13/02, 4/15/02, 4/16/02, 4/17/02, 4/18/02, 4/20/02, 4/22/02, 4/23/02,4/24/02,4/25/02, 4/26/02, 4/27/02, 4/29/02, 4/30/02 5/01/02, 5/2/02, 5/4/02, 5/6/02, 5/07/02, 5/8/02, 5/09/02, 5/10/02, 5/13/02, 5/14/02, 5/15/02, 5/16/02, 5/17/02, 5/20/02, 5/21/02, 5/22/02, 5/23/02, 5/24/02, 5/28/02, 5/29/02, 5/30/02 6/01/02, 6/3/02, 6/4/02, 6/5/02, 6/6/02, 6/7/02, 6/10/02, 6/11/02, 6/12/02, 6/13/02, 6/14/02, 6/17/02
|
The Anals of Stock ProctologyPublished 5 times
per week by the American Academy of Stock Proctology and PM Update 6/19/02 1 PM Terms and methodology Today has conformed fairly well to the initial map, meeting or exceeding the 1 day cmaps, and falling just shy or meeting the 3 days. The 3 day low is due today, but the 5 day has just rolled over, and the 8 day is in the process. Looks like we saw the "one more rally." But there could be one more "one more". The next few days should be mostly down though.Although 3 day cycle lows camps have been hit, the 5 day cycle lows are looking lower. The intraday cycles are now in a 3 hour "cyclette" loop, which rendered the 12 Noon projection moot. This would be easy and we'd all be zillionaires if cycles didn't morph. The next 3 hour low is due imminently. The 1 day cycle appears to be in a sideways up phase, in spite of this last selloff. Look for another bounce of the 3 hour low, with a final high around 3-3:30. In short, lots of churning as the market makers struggle to peg the market and unwind positions. Doc does not make trading recommendations. This update reports intraday time cycle estimates and centered moving average projections based on the Hurst cycle analysis method. Doc assumes no responsibility for the accuracy or inaccuracy of these estimates and projections. The market may or may not meet these projections. New stoolies should thoroughly familiarize themselves with the methodology before trading based on this method. There is no free lunch. Those who do not have the time or inclination to develop a trading strategy based on testing and research should not trade. Trade at your own risk.
AM Update 6/19/02 9 AM Terms and methodology When the fucutures "act out" as they have over night, Doc bases the centered moving average projections on the fucutures action. This is always risky, because there are those occasions where the NY market does not follow, although, more often it does. So here goes. A short cycle low is due on the open. A 5 hour cycle low is due at noon. The shape of what happens in between is anybody's guess. This is opex week The 3 day cycle low is also due this morning, so once the panic is washed out, the PM could see some stabilization. The AM weakness should be sufficient to confirm a downturn in the 8 day cycle. Keep an eye out for that on the 60 minute bars with a 26/18 stochastics. Next update around 1 PM barring a catastrophe..
Manic Capitulation (6/18/02) Not much to say after a quiet day like this. Options market makers in the process of unwinding positions managed to get the market pinned to a tight trading range, an act we've seen before in expirations week. Short term upside centered moving average projections came down as a result. The up phases in the 4 week and 6-7 week cycles look like garden variety sideways consolidations as a result, and prices look like they are near the upper end of the range. Triple witching weeks are not the best for trading, that's for sure. Trading is either too wild, or too quiet. Go away until Friday at noon! Working at home today, I had the rare pleasure of being able to listen to Crapvision in the background all day. I came to the conclusion that without a doubt Bob PissAnt is the most irritating Wall Street cheerleader out there. (See Dow Jokes) Then there's Tom Abbott Costello. Tom was good enough to report on what Comstock Partners (fellow bears) had to say about the difference between this market and the 1974 bottom (PE ratios and sentiment). But every time he gave the report he ended by reminding the sheeple that ,"Of course Comstock is always bearish!" To which I screamed back, "ABBOTT! Why the disclaimer?" Can you imagine if they said that, "Of course she's always bullish," every time they reported on Abby, or Buttplugia. Never happen. So the bears get the disclaimer, the bulls don't. Finally the crapitulation word comes up during interviews throughout the day. They are completely misusing the term, equating it with the September 21 selling panic low, and expecting a magic market levitation to follow. The poodits dutifully answer that yes we had capitulation, or in a few cases, no we didn't. Meanwhile Maria, who is suddenly fascinated with liquidity, has been asking how much cash the poodit has. Not surprisingly, the answer is always 5%, which in essence is fully invested. They have to keep some cash on hand to meet normal redemptions. So this naturally needs to the question, how can we have seen "capitulation" if all the mental institutions are still fully invested. Fact is capitulation is when these turkeys are heavy with cash. When they are fully invested, that's the opposite of capitulation. It's mania. The Feed
added $3 billion in overnight repos, resulting in a net drain of $6.25
billion. $4 billion of yesterday's $7 billion repo were left on the
table, as well as Friday's $2.25 billion in 4 day repos. That brings the
total Feed (Fed securities holdings) back to the low side of its trend
channel. It seems Al knew that good news was coming (big jump in housing
starts, low inflation) so he took some off the table. He has again put
himself in position to jam if need be. The Fast Feedometer, which
attempts to measure the amount of excess Feed available for jamming the
stock market, pulled back. The Slow Feedometer continues to
trend
up, but another drain will begin to turn it lower. Stocks will turn down
sharply if that happens. If the Feed is anything less than aggressive
stocks will be liquidated.
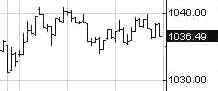
Portfolio Sphincters Index (SPX) and Sentiment The Sphincters Index ended with a 1 point gain at 1036. The 17 day rate of change, which represents the 6-7 week cycle, and the 6-7 week oscillator superimposed on the price chart, rose and are now very close to buy signals. We should expect the up phase to manifest as a trading range. The 10-13 week cycle oscillator (navy) upticked. The timing isn't right for a bottom in that cycle. It should still be heading down, suppressing the 6-7 week cycle up phase. The 29 day rate of change also upticked but is still in a flat pattern. A flat pattern in negative territory indicates a stable downtrend. If it breaks above the zero line however, it could be a big problem for the bear case. The VIX fell to 27.33. On the inverted scale chart, VIX has rebounded from the lower band. The lower band penetration appears to coincide with a 6-7 week cycle low, but it doesn't look like the extreme fear that tends to persist for several days at a 10-12 month cycle low. The current position is neutral. It looks more like a consolidation than a reversal. The blue channel lines are the extension of a linear
regression channel from the February and May 2001 highs. The 6 month cycle
oscillator is now very close to a signal. The time isn't quite right, but
we don't have the luxury of deciding those things. Time targets are
guideposts, that's all. If the indicator turns, it has to be respected.
The same applies if it turns down again. But it also applies if it remains
in a flat trend at this level. That would indicate trending. A simple
crossover may catch a turning point, but unless the lines actually turn
up, the trend will not reverse. The trading
stoolicator still supports the assumption that the key trading cycles have
not turned. They remain down. The short cycle oscillator is approaching
top territory. The 10-13 week cycle oscillator upticked, but
the trend is still down. The price action is still confined within the cycle channel
projection, and it could overrun to 1050 without disturbing the
trend. Fiber Nacho reflux will set in at 1045, and if
it gets past that, 1056. The Cycle Conditions tables include cycle phase and a wild guess as to number of periods to the next turn, in days for the shortest cycles, weeks (W) or months (M) for the longer ones. This is a fluid exercise, in other words, the projections are likely to be wrong, but they force us to be vigilant for key turning points, and frequently work well enough to prevent costly misreadings. SPX Cycle Conditions as of 6/18/02
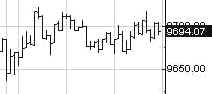
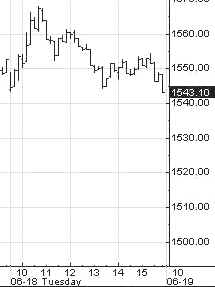
PTT - Periods Till Turn Nasgap Charts The Nas,
sloughed off 10, to close at 1546. The 6 month
cycle time series is still drifting down. The 10-13 week cycle
oscillator and the trading stoolicator upticked, but remain in negative
configurations. The
Nascrap 100 stalled in the center of its downtrend
channels. There's a resistance problem here. There are
dual fiber nacho refluxes at 1564. Stopped the rally cold. If by
some miracle it gets through that, 1600 presents an even greater obstacle. Nasdaq Cycle Conditions as of 6/18/02
PTT
- Periods Till Turn AM Edition Features (Previous) Bond yields appear to be
basing for their next move up. But there's a big "but." The
oscillators have to turn up, and while they look like they want to none
have, and yields could still spike lower, especially if the stock market
melts down. Day to day situation here. Could be an "infection
point". The chip sector
had its problems overnight on the AMD warning. The short cycle sideways up
phase topped yesterday. The light green channel is the 10-12 month cycle.
If the sector melts down today, the projection for that cycle is probably
following the slope of the 5-6 month wave (dark green). In spite of
ORCL' s "good news", the 10-13 week cycle oscillator indicates
the software sector is topping out, not bottoming. This pattern
crops up in most tech groups. Is the energy
sector a place where asset bulls can safely play? It's beginning to
look like a good place to look over the next couple days. Basing action in
the 525-540 area would be bullish. This is really a nice chart setup if
you want to be bullish, but the buy signals aren't there yet on key
cycles. Oh, Mr.
Bill, Mr. Bill! Are you topping out? Today should tell the tale.
GE's pop on
Wednesday brought it to the upper band of downtrending cycle channels. Stoolie Pee
Doc wanted Doc to take a look at QCOM and EMLX. EMLX looks real
interesting. The 5-6 month cycle has been in a sideways up phase for
3 months. When it breaks the uptrend line, it could fall a long way. Henceforth and forevermore, if you would like to request a "stock o'der", please post your request in Dear Dr. Stool. If you have not already registered for the message board, please do so. The only required info is user name and password which you choose yourself, and your email address, which you can keep private by selecting the keep private option. Doc looks forward to featuring your ideas. We've had some good ones! Uncle Buck's Illness Uncle B expired yesterday.
He's being lowered into the ground. At 7 AM he was at 109.66. Note that
the decline is occurring as the 10-13 week cycle is in an up phase. This slide
can only accelerate. 108-109 looks like support. It will soon be
resistance. With foreign money fleeing the US capital markets, the stock
market is in big trouble. Golden Stool The gold
stocks' decline has been arrested, but the 10-13 week cycle is still in a
sideways down phase. I know it didn't feel sideways last week. That's a
wide trading band! Several weeks, even months of backing and filling are
likely before an upside breakout. See you in Intraday Stool. Dr. Stepan N. Stool Let me know what you think on the Stool Pigeons Wire. Previous complete issue with all features Welcome To New Subscribers Welcome, and thank you for subscribing to the Anals of Stock Proctology. You may note some subtle differences in style now that this is no longer a free service. The perspective is still bearish, but it will have a more balanced approach than my message board ravings. You won't see me screaming "BUY" about anything except perhaps gold, but you will see stronger indications of areas and times when I think it might be a good idea to avoid being short. And I promise that I will lose my temper from time to time to keep you entertained! There's also a new feature, Doc's By Request Stock O' The Day. If you have a stock you're interested in, send an email to [email protected], naming the stock, and why you think Doc should look at it, in 25 words or less. 26 words, and you're disqualified! Those that look interesting, Doc will try to feature here within the next day or two. If you have suggestions about other features you'd like to see, send them along to [email protected]. Again, thanks for subscribing!
Explanation of Intraday Commentary-Build charts at http://www.livecharts.com. For custom time bars insert a comma after symbol and number of minutes, e.g. compx,90. This will give you a bar chart of the Nas with 90 minutes per bar. The one day cycle is usually most clear with 8 minute bars and 26/18 stochastics. It varies from day to day. Sometimes 6 minutes works best. Experiment to find the best fit for your trading style, and the market's dominant frequency at the time. The goal here is primarily to monitor the condition of the 8 and 13 day cycles. I typically use 90 minute bars with 26/18 stochastics for the 13 day cycle proxy on the indices during regular trading hours. Other cycles use 26/18 stochastics with the following: 8 days- 60 minute bars On the 24 hour futures charts, use a time per bar approximately 3 to 4 times the above number of minutes, to represent the cycles listed above. ABBREVIATIONS: cma: centered moving average |
|||||||||||||||||||||||||||||||||||||||||||||||||||||||||||||||||||||||||||||||||||||||||||||||||||||||||||||||
![[Most Recent XAU from www.kitco.com]](http://www.weblinks247.com/indexes/idx24_nasdaq_en_2.gif)
![[Most Recent XAU from www.kitco.com]](http://www.weblinks247.com/indexes/idx24_sp500_en_2.gif)
![[Most Recent Quotes from www.kitco.com]](http://kitconet.com/charts/metals/gold/t24_au_en_usoz_2.gif)
 The
stage managers * supported the Dow to make things look good, holding an 18
point gain at the bell. Henchman Bob PissAnt reminded the Crapvision
audience repeatedly what a great thing it was that the Dow was holding its
gains. In response to the strong housing starts news, Pissonit
crowed that the housing bears have been wrong for months. Stoolie
SupplySider remarked, "Bears are held to a higher standard. The Abby
Joseph Cohens and Joe Battipaglias of the world can be wrong for three
straight years and still be considered "experts" on market
forecasting."
The
stage managers * supported the Dow to make things look good, holding an 18
point gain at the bell. Henchman Bob PissAnt reminded the Crapvision
audience repeatedly what a great thing it was that the Dow was holding its
gains. In response to the strong housing starts news, Pissonit
crowed that the housing bears have been wrong for months. Stoolie
SupplySider remarked, "Bears are held to a higher standard. The Abby
Joseph Cohens and Joe Battipaglias of the world can be wrong for three
straight years and still be considered "experts" on market
forecasting."