|
Archives 12/30/01, 1/1/02, 1/2/02, 1/3/02, 1/4/02, 1/7/02, 1/8/02, 1/09/02, 1/10/02, 1/11/02, 1/14/02, 1/15/02, 1/16/02, 1/17/02, 1/18/02, 1/22/02, 1/23/02, 1/24/02, 1/25/02, 1/28/02, 1/29/02, 1/30/02, 1/31/02, 2/1/02, 2/4/02, 2/5/02, 2/06/02, 2/7/02, 2/9/02, 2/11/02, 2/12/02, 2/13/02, 2/14/02, 2/16/02, 2/19/02, 2/20/02, 2/21/02, 2/23/02, 2/25/02, 2/26/02, 2/27/02, 2/28/02, 3/1/02, 3/04/02, 3/05/02, 3/06/02, 3/7/02, 3/10/02,3/11/02, 3/12/02, 3/13/02, 3/14/02, 3/15/02, 3/18/02, 3/19/02, 3/20/02, 3/21/02, 3/22/02, 3/25/02, 3/26/02, 3/28/02, 3/30/02 4/1/02, 4/2/02, 4/3/02, 4/4/02, 4/6/02, 4/8/02, 4/9/02, 4/10/02, 4/11/02, 4/13/02, 4/15/02, 4/16/02, 4/17/02, 4/18/02, 4/20/02, 4/22/02, 4/23/02,4/24/02,4/25/02, 4/26/02, 4/27/02, 4/29/02, 4/30/02 5/01/02, 5/2/02, 5/4/02, 5/6/02, 5/07/02, 5/8/02, 5/09/02, 5/10/02, 5/13/02, 5/14/02, 5/15/02, 5/16/02, 5/17/02, 5/20/02, 5/21/02, 5/22/02, 5/23/02, 5/24/02, 5/28/02, 5/29/02, 5/30/02 6/01/02, 6/3/02, 6/4/02, 6/5/02, 6/6/02, 6/7/02, 6/10/02, 6/11/02, 6/12/02, 6/13/02, 6/14/02, 6/17/02, 6/18/02, 6/19/02, 6/20/02, 6/22/02, 6/24/02, 6/25/02, 6/26/02, 6/27/02, 6/30/02 7/1/02, 7/4/02, 7/5/02, 7/11/02, 7/14/02, 7/15/02, 7/16/02, 7/17/02, 7/18/02, 7/19/02, 7/22/02, 7/23/02, 7/24/02, 7/25/02, 7/27/02, 7/29/02, 7/30/02 8/1/02, 8/3/02, 8/5/02, 8/6/02, 8/7/02, 8/8/02, 8/10/02, 8/12/02, 8/13/02, 8/14/02, 8/15/02, 8/16/02, 8/19/02, 8/20/02, 8/21/02, 8/22/02, 8/23/02, 8/26/02, 8/27/02, 8/28/02, 8/29/02, 8/30/02 9/3/02, 9/4/02, 9/5/02. 9/6/02, 9/9/02, 9/10/02, 9/11/02, 9/12/02, 9/13/02, 9/16/02, 9/17/02, 9/18/02, 9/19/02, 9/20/02, 9/23/02, 9/24/02, 9/25/02, 9/26/02, 9/27/02, 9/30/02 10/1/02, 10/2/02, 10/3/02, 10/4/02, 10/7/02, 10/8/02, 10/9/02, 10/10/02, 10/11/02, 10/14/02, 10/15/02, 10/16/02, 10/17/02, 10/18/02, 10/21/02, 10/22/02, 10/23/02, 10/24/02, 10/25/02, 10/28/02, 10/29/02, 10/30/02, 10/31/02 11/1/02, 11/4/02, 11/5/02, 11/6/02, 11/7/02, 11/8/02, 11/11/02, 11/12/02, 11/13/02, 11/14/02, 11/15/02, 11/18/02, 11/19/02, 11/20/02, 11/21/02, 11/22/02, 11/25/02, 11/26/02, 11/27/02, 11/29/02
 Doc's view of the Street. |
The Anals of Stock ProctologyPublished weeknights by
8:30PM Happy Acres, Florida Time The American
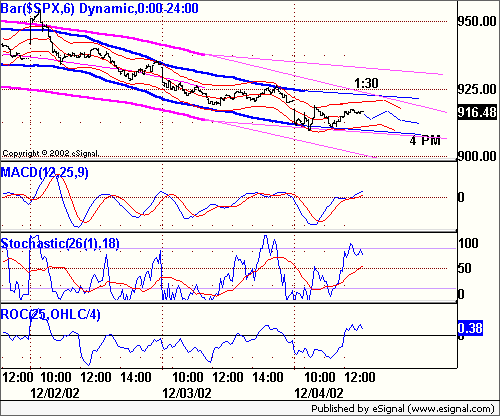
Academy of Stock Proctology and Is your subscription up for renewal? If you want to renew, do nothing, unless your credit card has expired. Please be sure your credit card info is current. If your credit card has expired, you must enter the new expiration date in your Paypal account in order for your subscription to be processed. If you subscribed via Paypal, your subscription will be renewed for one year on the 90 day anniversary of your sign-up and your credit card will be charged. If you want to cancel, use the button at the bottom of the page. This applies only if you subscribed through Paypal. Mailed-in subscriptions are for 1 year. If you subscribed by prior contribution, I will send you a notice before your subscription expires. If you have any questions, see the subscription page and FAQ's. If you can't find the answer, email me. Doc does not make trading recommendations. This update reports time cycle estimates and centered moving average projections based on the Hurst cycle analysis method. This publication is for entertainment and educational purposes only. Doc assumes no responsibility for the accuracy or inaccuracy of the estimates and projections presented. The market may or may not meet the projections. Stoolies should thoroughly familiarize themselves with the methodology before trading based on this method. Those who do not have the time or inclination to develop a trading strategy based on testing and research should not trade. Trade at your own risk. Yadda yadda. How's your motha? Be a Johnny Applestool! Help spread the Stool! Feel free to repost snippets from the Anals on message boards around the web. Just give a link back! Many tanks - Doc PM Update 12/4/02 1:00 PM The current 5 hour 1 day cycle up phase is due for highs at 1:30 and 3 PM, give or take an hour. The upside cmap is 918-920. This looks like a 3-5 day cycle up phase that should be a swup. The 3 and 5 day ozzies are turning up, and the downside cmaps for those waves have been met. Caution is in order for the next few hours at least, although not much is likely to happen on the upside. The 5th day in a row of Feed draining should keep the lid on. For now this is how it looks for the remainder of today. The low volatility makes it impossible to know the parameters of the 5-8 day cycle track. I drew two possibilities. Either way it's a swup. 5-8 Day Cycle______ 2-3 Day Cycle_______ 5 Hr-1 Day Cycle
Pre Market Update 12/4/02 9:15 AM ET Last night I mentioned that the dip this morning could be as low as 910. Well! Based on the fucutures the downside cmap for the AM low is 914. The revised cycle map looks like this. 5-8 Day Cycle______ 2-3 Day Cycle_______ 5 Hr-1 Day Cycle
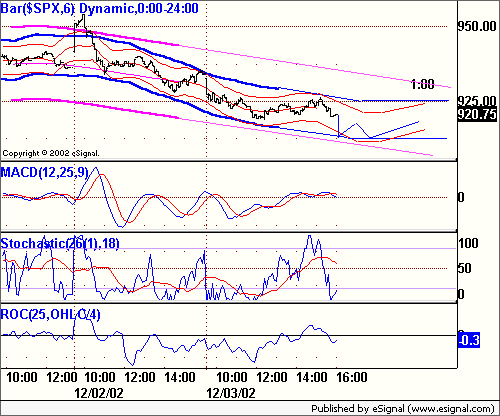
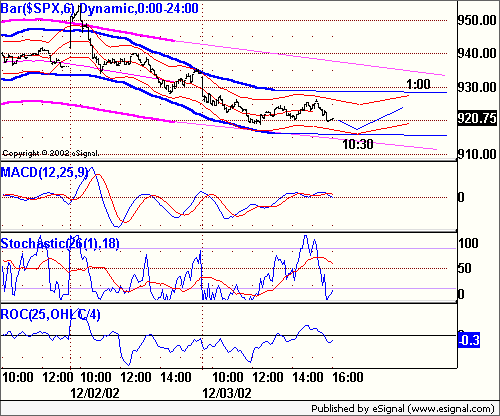
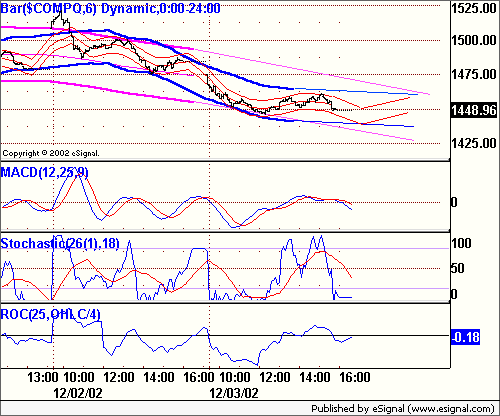
Tuesday's Markets (12/3/02)
Intraday - Coming off a 5 hour cycle high on Monday's, it was straight down from the open, followed by a slow drift into the 5 hour low around 12:30. The price and time were consistent with yesterday's cycle map. The up phase that followed lasted until 3 PM, about an hour longer than forecast, but within the framework of the cycle map. The dip in the last hour did not carry as low as the projections, suggesting a possible 3-5 day cycle low. On that basis, tomorrow could be a swup, after a 5 hour cycle low in the first hour. The cmap for the low is 919. At the outside, they could dip to 910. Doc is looking for something that looks like the projections below. Check back for the pre-market update at 9:15 NY time. 5-8 Day Cycle______ 2-3 Day Cycle_______ 5 Hr-1 Day Cycle
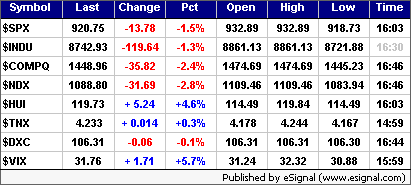
Mohel Lynch Gets Tips from Doc? (12/3/02) Now it's time to watch, wait, and be vigilant. Many of you got your short positions out Tuesday. That seems most timely, although the few who picked off Monday's opening frenzy will probably look like geniuses in a couple of weeks. Still, we shouldn't get carried away. The topping process is not over. There will be bounces. It's even possible that this 10-13 week cycle down phase will be part of a larger top in which these highs get retested, perhaps in February. For the next 2-5 weeks, the bias should be to the downside, but it will be fought tooth and nail by the forces of bull. Doc's long time favorite market strategoist is Mohel Lynch's (Oy do we got tips for you!) Richard Bernstein (Bernie for short). Here's what one of the highest paid, and the best, Wack Street strategoists had to say today in a note to his clients.
OK, so you heard the same thing here last week. Is someone at Mohel surreptitiously reading the Anals? Is Mohel's Dick Bernie actually taking tips from Doc? Don't answer that. The stage managers pulled their
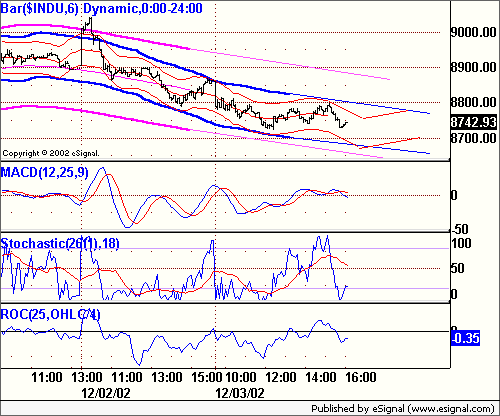
bids a little after taking the Inflatables through multiple cycle cmaps on
Monday. It's a little early for downside cmaps. 8700 is an important level
that could generate some short covering. The uptrend may be finished but
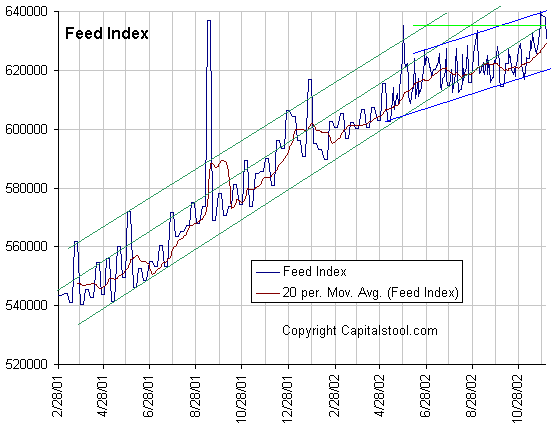
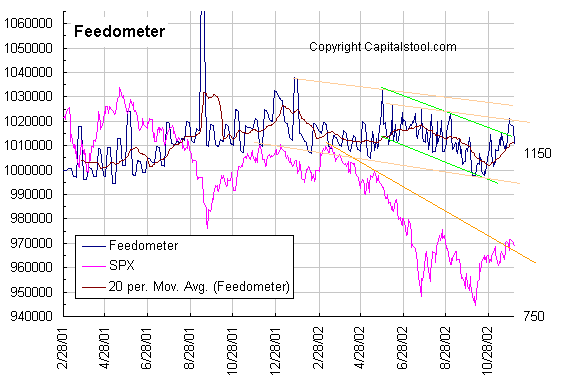
top formation is going to take a few more days. The Feed did only $2.25 billion in overnight repos, and added a $653 million coupon pass, resulting in a net drain of $7.35 billion. Doc mentioned yesterday that when the Total Feed reaches the top of the apparent growth target channel, Al plays Injun giver and takes some back. Voila! Normally, he'll let it drop all the way back to the lower portion of the channel before renewed major pumping. There are no expirations Wednesday other than Tuesday's overnight repos. Three
trends are evident on the Feed Index, which is the total Fed holdings of
loans and securities. One is the 10% growth trend beginning in May of
2001. Feed growth has recently been below the lower boundary of that
trend. The blue channel going back to last December suggests that Al may
now be targeting an 8% growth rate. Then there's the golden box which says
he's stopped growing Feed altogether over the last six months. The short term trend of excess Feed for the markets is still positive, but if the Fast Feedometer drops below the slow Feedometer, that will put a hurtin' on them. The
Feedometer theoretically
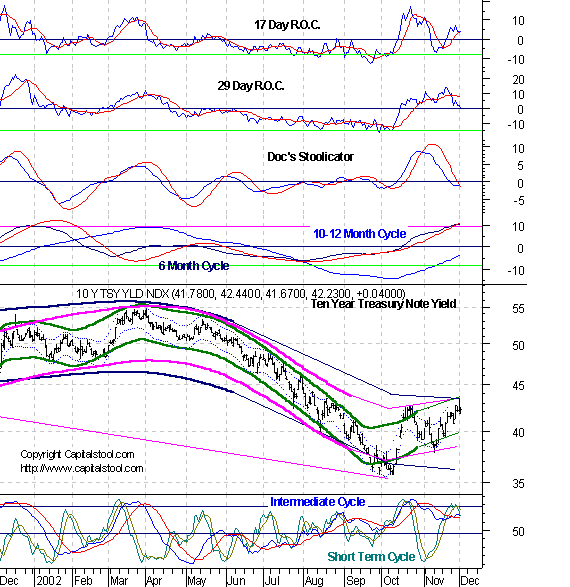
measures excess Feed available for bond or stock market jamming. Bond yields
rose slightly. A couple of the cycle indicators look toppy. Doc thinks
there's a good chance of a pullback here as stocks get sold and bonds get
bought for awhile. The inversion of this relationship is still a long way
off san will probably need a yield well above 4.5%. All of Doc's
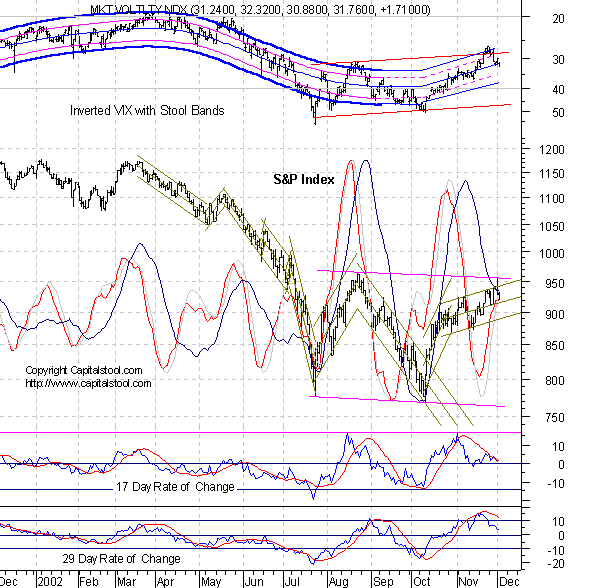
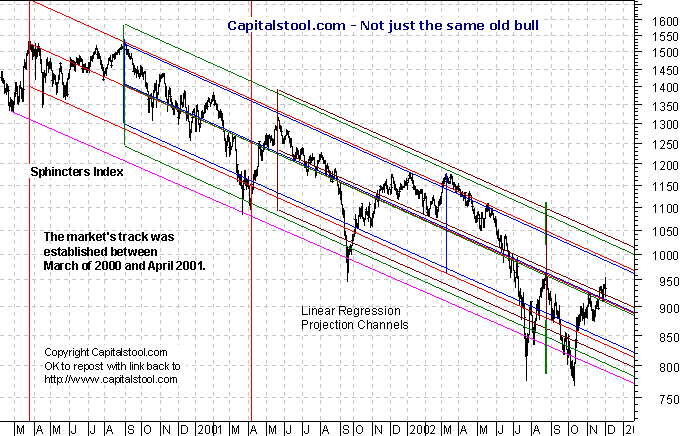
daily cycle charts are powered by METASTOCK Portfolio Sphincters Index (SPX) and Sentiment Sentiment and Momentum Indicators
The 17 day rate of change is a proxy for the
6-7 week cycle. the 29 day rate of change is a proxy for the 10-13 week
cycle. The dark blue overlaid line is the 10-13 week cycle
oscillator, while the red line is the 6-7 week cycle oscillator. The VIX
is a measure of implied options volatility reflecting relative fear or
complacency. It is plotted below on an inverse scale to better show the
relationship to the price chart. The "Stool Bands may reflect either
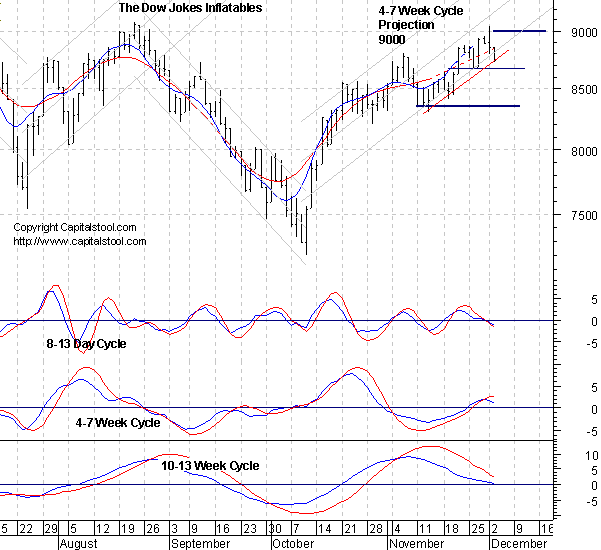
6 month or 10-12 month cycles. Short Term Cycles The counts on the shortest waves are still unclear. They are headed down, but could be near a low. The 4-7 week cycle is now on the right side of its top, and should break down within a couple of days. Upside cmaps were hit and finally held on all of the shortest waves. The 17 day ROC is on the razor's edge of a strong sell signal. A drop below the zero line usually signals downward acceleration. 10-13 Week Cycle The 10-13 week cycle oscillator began to accelerate down. The 29 day ROC remains in a plateau just above its November low point. It would be good to see another downtick in that indicator to really get things rolling. The action on Tuesday may have been the beginning of a downward acceleration, although a holding action for a day or two at this point would be normal. The 10-13 week cycle low is due between December 19 and January 9. VIX On the inverted scale Stool Band chart, VIX dropped below the center channel line. Last week's blowout above the blue channel line was an indication of an overcooked, overconfident market, and a probable intermediate cycle top. Cycle Chart Here's one of Doc's favorite charts. After punching through multiple long term regression projections, the rally stalled and dropped back to the uppermost of the central regression projections. It's going to be interesting to see how the market behaves around these lines in the days ahead. Will they act as support? Probably, albeit temporarily. But the upside mo has been broken, and it's unlikely that prices will reach the top of the channel this time around. There's a scenario where they may do so in February, but it would be in the context of a retest of the high.
The Cycle Conditions tables include cycle phase and a wild guess as to number of periods to the next turn, in days for the shortest cycles, weeks (W) or months (M) for the longer ones. This is a fluid exercise, in other words, the projections are likely to be wrong, but they force us to be vigilant for key turning points, and frequently work well enough to prevent costly misreadings. SPX Cycle Conditions as of 12/3/02
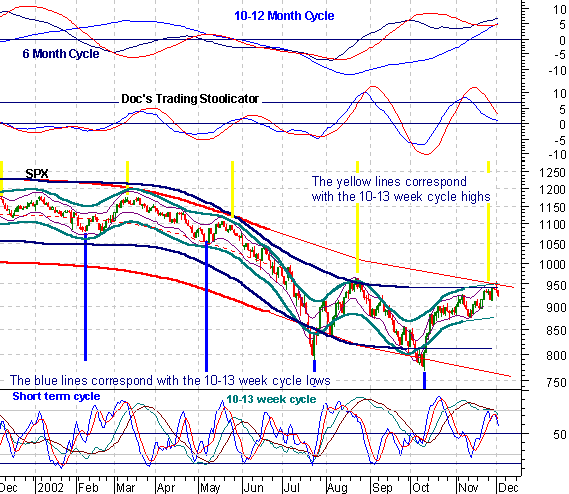
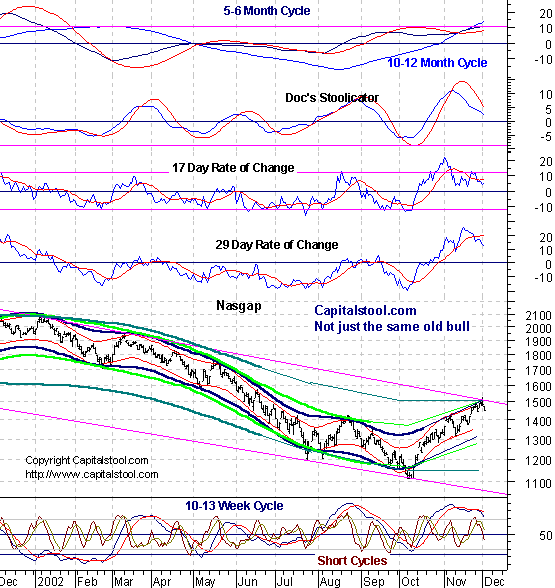
PTT - Periods Till Turn Nasgap Charts Cycle Chart Short Term Cycles Upside cmaps were all met and short cycles have turned down. The counts are unclear, and another bounce could come within a day or two. The 4-7 week cycle is in a top phase that's finally beginning to roll over. Doc still wants to see the 17 day ROC break that shelf. That would be the signal the dam had broken. 10-13 Week Cycle The 10-13 week cycle indicator turned more sharply lower after the cmap was hit. After being on a sell signal for 3 weeks, it's time for downside acceleration. Confirmation would come from the 29 day ROC dropping below its November low point. The 10-13 week cycle low is due from December 19 through January 14. IT will take at least several days before we have a downside cmap for this cycle. Nasdaq Cycle Conditions as of 12/3/02
PTT
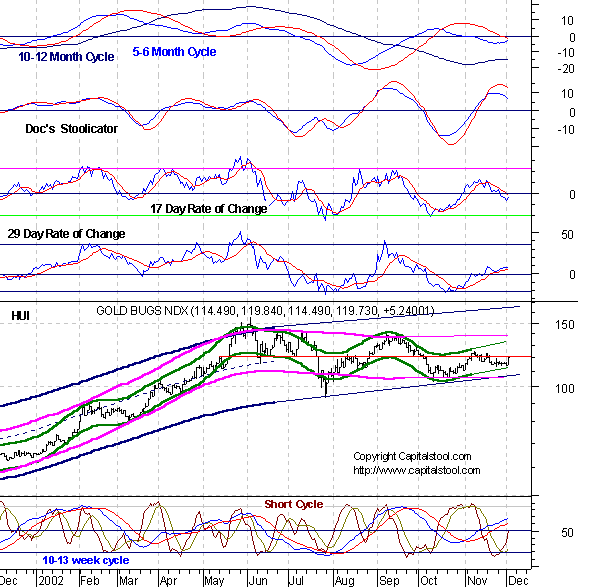
- Periods Till Turn Long Bong Hit - See top of page. AM Edition Features (Previous) These features are in morning edition, published between 7:30-8 AM ET US, or the Saturday Weak End Edition, published, uh, let's see, Saturday! Golden Stool The 13 day
cycle cmap is 121-122, but it's too soon to conclude that yesterday's
move, while nice signals something bigger is under way. This still looks
like a 10-13 week cycle up phase with a cmap of 124 due in a week or so.
The big upside breakout is still looking to be a couple months out at
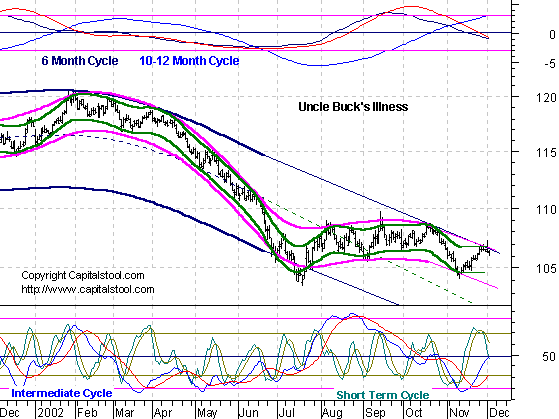
least. Uncle Buck's Illness Uncle B is
sitting at 106 this morning, perched precariously along the top of a major
cycle channel. Can he push the boundaries of that channel higher as the
intermediate cycle up phase progresses, or is this the final stand in that
cycle? Stay tuned for the next episode of Uncle Buck's Illness. Suctor Watch and Stoolwethers- Now posted on separate page. Updated each morning between 8 AM and 9:30 AM NY time. See you in Intraday Stool. Dr. Stepan N. Stool Share your thoughts on the Stool Pigeons Wire.
Renewals Welcome, and thank you for subscribing to the Anals of Stock Proctology. Your trial subscription will run for 90 days. At the end of that period your subscription will renew automatically, unless you cancel. If you wish to cancel your subscription use the button below. If you want to renew your subscription do nothing. Your subscription will renew and your credit card or Paypal bank account will be charged. If you want to renew, be sure your credit card information in your Paypal account is current. Paypal will not renew your subscription if the card has expired! Again, thanks for subscribing!
Explanation of Intraday Commentary-Build charts at http://www.livecharts.com. For custom time bars insert a comma after symbol and number of minutes, e.g. compx,90. This will give you a bar chart of the Nas with 90 minutes per bar. The one day cycle is usually most clear with 8 minute bars and 26/18 stochastics. It varies from day to day. Sometimes 6 minutes works best. Experiment to find the best fit for your trading style, and the market's dominant frequency at the time. The goal here is primarily to monitor the condition of the 8 and 13 day cycles. I typically use 90 minute bars with 26/18 stochastics for the 13 day cycle proxy on the indices during regular trading hours. Other cycles use 26/18 stochastics with the following: 8 days- 60 minute bars On the 24 hour futures charts, use a time per bar approximately 3 to 4 times the above number of minutes, to represent the cycles listed above. ABBREVIATIONS: cma: centered moving average
|

![[Most Recent HUI from www.kitco.com]](http://www.weblinks247.com/indexes/idx24_hui_en_2.gif)
![[Most Recent XAU from www.kitco.com]](http://www.weblinks247.com/indexes/idx24_sp500_en_2.gif)
![[Most Recent Quotes from www.kitco.com]](http://kitconet.com/charts/metals/gold/t24_au_en_usoz_2.gif)