|
Archives 12/30/01, 1/1/02, 1/2/02, 1/3/02, 1/4/02, 1/7/02, 1/8/02, 1/09/02, 1/10/02, 1/11/02, 1/14/02, 1/15/02, 1/16/02, 1/17/02, 1/18/02, 1/22/02, 1/23/02, 1/24/02, 1/25/02, 1/28/02, 1/29/02, 1/30/02, 1/31/02, 2/1/02, 2/4/02, 2/5/02, 2/06/02, 2/7/02, 2/9/02, 2/11/02, 2/12/02, 2/13/02, 2/14/02, 2/16/02, 2/19/02, 2/20/02, 2/21/02, 2/23/02, 2/25/02, 2/26/02, 2/27/02, 2/28/02, 3/1/02, 3/04/02, 3/05/02, 3/06/02, 3/7/02, 3/10/02,3/11/02, 3/12/02, 3/13/02, 3/14/02, 3/15/02, 3/18/02, 3/19/02, 3/20/02, 3/21/02, 3/22/02, 3/25/02, 3/26/02, 3/28/02, 3/30/02 4/1/02, 4/2/02, 4/3/02, 4/4/02, 4/6/02, 4/8/02, 4/9/02, 4/10/02, 4/11/02, 4/13/02, 4/15/02, 4/16/02, 4/17/02, 4/18/02, 4/20/02, 4/22/02, 4/23/02,4/24/02,4/25/02, 4/26/02, 4/27/02, 4/29/02, 4/30/02 5/01/02, 5/2/02, 5/4/02, 5/6/02, 5/07/02, 5/8/02, 5/09/02, 5/10/02, 5/13/02, 5/14/02, 5/15/02, 5/16/02, 5/17/02, 5/20/02, 5/21/02, 5/22/02, 5/23/02, 5/24/02, 5/28/02, 5/29/02, 5/30/02 6/01/02, 6/3/02, 6/4/02, 6/5/02, 6/6/02, 6/7/02, 6/10/02, 6/11/02, 6/12/02, 6/13/02, 6/14/02, 6/17/02, 6/18/02, 6/19/02, 6/20/02, 6/22/02, 6/24/02, 6/25/02, 6/26/02, 6/27/02, 6/30/02 7/1/02, 7/4/02, 7/5/02, 7/11/02, 7/14/02, 7/15/02, 7/16/02, 7/17/02, 7/18/02, 7/19/02, 7/22/02, 7/23/02, 7/24/02, 7/25/02, 7/27/02, 7/29/02, 7/30/02 8/1/02, 8/3/02, 8/5/02, 8/6/02, 8/7/02, 8/8/02, 8/10/02, 8/12/02, 8/13/02, 8/14/02, 8/15/02, 8/16/02, 8/19/02, 8/20/02, 8/21/02, 8/22/02, 8/23/02, 8/26/02, 8/27/02, 8/28/02, 8/29/02, 8/30/02 9/3/02, 9/4/02, 9/5/02. 9/6/02, 9/9/02, 9/10/02, 9/11/02, 9/12/02, 9/13/02, 9/16/02, 9/17/02, 9/18/02, 9/19/02, 9/20/02, 9/23/02, 9/24/02, 9/25/02, 9/26/02, 9/27/02, 9/30/02
|
The Anals of Stock ProctologyPublished weeknights by
8:30PM Happy Acres, Florida Time The American Academy of Stock Proctology and Is your subscription up for renewal? If you want to renew, do nothing, unless your credit card has expired. Please be sure your credit card info is current. If your credit card has expired, you must enter the new expiration date in your Paypal account in order for your subscription to be processed. If you subscribed via Paypal, your subscription will be renewed for one year on the 90 day anniversary of your sign-up and your credit card will be charged. If you want to cancel, use the button at the bottom of the page. This applies only if you subscribed through Paypal. Mailed-in subscriptions are for 1 year. If you subscribed by prior contribution, I will send you a notice before your subscription expires. If you have any questions, see the subscription page and FAQ's. If you can't find the answer, email me. Update 10/4/02 12:15 PM Terms and methodology A bottoming process in the 1 day cycle is under way as of noon. Revised downside cmaps posted at 10 AM were hit. Looking for no more than a weak swup in the afternoon which should end between 2 and 3 PM. Upside is expected to be minimal, if any. Market should be in full retreat toward 5 day cmaps by the end of day.
Update 10/4/02 10:00 AM Terms and methodology Rut ro. Scenario 1 it is! Downside 1 day cycle cmaps are SPX 808, Nasty 1145, and 100 Nads 824.11:30 now looks like a 5 hour cycle low, instead of 3 hour wave high. Wouldn't put too much faith in any timings, given the nervousness. 5 day cmaps are also going to be significantly lower. Will update at mid day. Update 10/4/02 9:15 AM Terms and methodology Big jump in the fucutures on the unemployment data confusion. Last night Doc wrote, "If they are still cycling at 3 hours, that might have been the low, at the bell, which could lead to another little bounce in the AM. But if the 1 day cycle resynched at that low, then we will see relentless selling into mid day tomorrow." Doc voted for scenario 2, but we're going to get scenario 1. Let's look for a pop to 828-30 on the SPX, 846-50 on the 100 Nads, and 1178 to 1185 on the Nasgap. Expect lots of churning around, with a high right after the open, a pullback then another push that lasts until 11:30. If the morning plays out this way, it changes the outlook for the next few days as well. Instead of a big drop, the market looks more likely to churn in a narrow range, still with a mild downward bias. This is likely to be extremely tough to trade. There's a good chance that the SPX and 100 Nads will finally meet.
Doc does not make trading recommendations. This update reports intraday time cycle estimates and centered moving average projections based on the Hurst cycle analysis method. Doc assumes no responsibility for the accuracy or inaccuracy of these estimates and projections. The market may or may not meet these projections. New stoolies should thoroughly familiarize themselves with the methodology before trading based on this method. There is no free lunch. Those who do not have the time or inclination to develop a trading strategy based on testing and research should not trade. Trade at your own risk. Tick Tick (10/3/02) Only time for limited commentary tonight, so here we go! (Sorry, this is unproofed and unedited.) The Feed drained $6.25 billion. The massive drain resulted from the fact that Al did not roll over the $ 3 billion in 28 day repos, nor the $2.5 billion in 2 day repos. They added $3 billion in overnight repos, only partially replacing yesterdays $3.75 billion. The only expirations coming up Friday are the $3.75 billion in overnight repos. The Feed Index is in danger of falling out of bed. Look for the big one Friday morning. They have to know the market will collapse without it. Three trends are evident on
the Feed Index. One is the 10% growth trend beginning in May of 2001. Feed
growth has recently been at or below the lower boundary of that trend. The
blue channel going back to last December suggests that Al may now be
targeting an 8% growth rate. Then there's the golden box which says he's stopped growing Feed altogether over the last three months. The fast Feedometer fell below it's recent range. The downtrend in Feeding is accelerating. Their modus operandi of late has been to add as little as necessary to stop a meltdown, but after the fact. I t will be interesting to see if they ride to the rescue Friday, or wait until crisis is upon us. The
Feedometer theoretically
measures excess Feed available for bond or stock market jamming. 10 Year Bond yields were down a hair at 3.68. The 10-13 week cycle cmap remains 3.60, which has already been hit. The 10-12 month cycle cmap is 3.50, which is also a long term resistance level. A low is not confirmed yet, but the conditions look right. The intermediate cycle oscillator is ever so close to indicating an upturn. That would be extremely bearish for the bond market, and would signal the closing of the refi window which has been keeping the financial system on life support.
Refis were up big again last week, but purchases were
again flat. The total mortgage app index blew out to another new high. Instead of the expected explosion
in broad money supply, growth was moderating as of September 23. The
system is leaking badly, partly from the stock market, and where
else? Slowing growth in the adjusted monetary base is related to the slowing Feed.
Flat M1 is an indicator of the
weak economy. The commercial paper market
remains a shambles and is getting worse. Likewise commercial lending. Even total bank credit has
moderated a bit. The bottom line is that the mortgage market is the sole generator of money and credit growth, and it is at a very dangerous infartion point. The stock market becomes a source of desperately funds from both the corporate, financial, and household sectors, under the circumstance. We are staring at the potential for a tidal wave of liquidation. Financial and Economic Indicators Last week (September 26) Suctor Watch and Stoolwethers- Now posted on separate page. Updated each morning between 8 AM and 9:30 AM NY time.
All of Doc's
cycle charts
are powered by METASTOCK Portfolio Sphincters Index (SPX) and Sentiment Long Term (10/2/02) The six month cycle oscillator started flashing a sell signal. This cycle is topping out a sideways up phase as it moves across the 18-month 2 year cycle channel. The weakness of the up phase and the amount of time left in the cycle suggest devastating losses through January. Given the 4 year cycle low in October 1998, over the next few months we need to be on the lookout for conditions indicating a four year cycle low, which would be followed by a ferocious rally finally convincing everyone the bear market is over. We also need to be aware that we may have already seen it. The up and down phase of the 1920's bubble lasted more than 6 years, with an interim low after the crash in November of 1929, a little more than 3 years after the onset of the bubble. The September 2001 low was at a similar point relative to the 1998 low. Think of the bubble wave like a tsunami. It is bigger and lasts longer than the typical 4 year cycle. They'll be wrong. Sentiment and Momentum
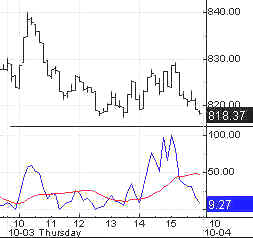
Indicators Short Term Cycles The index stayed bolted to the center of the downtrend channel. The 8 and 13 day cycles started down. The tentative cmap is 760-790 over the next few days. The unpredictable sideways up phase of the 6-7 week cycle also appears to have ended, with a downturn due within 4 days. The 4 week cycle is in a sideways up phase, at best. The power of the descent of the 10-13 week wave will probably suppress it. 10-13 Week Cycle The 10-13 week cycle indicator fell to a new bear market low. It could bottom any time over the next three weeks. Some indicators look Dover Sole, but the final phase of the decline is usually the sharpest. Because of this uncertainty, the cmap range of 700 to 760 is unusually broad. A sharp down day Friday would aim the cmap at the low end of the range or lower. The cycle indicators have not flashed a turn signal. Until hey do, the downtrend has the potential to steepen. VIX The VIX rose to 44.96, back in the middle of the inverted scale 6 month cycle Stool Band. This indicator, like the market, is trending, near neither a high nor a low. Cycle Chart
Fiber Nacho Dump- Support levels and downside targets.
Fiber Nacho Reflux- Resistance levels and upside targets The Cycle Conditions tables include cycle phase and a wild guess as to number of periods to the next turn, in days for the shortest cycles, weeks (W) or months (M) for the longer ones. This is a fluid exercise, in other words, the projections are likely to be wrong, but they force us to be vigilant for key turning points, and frequently work well enough to prevent costly misreadings. SPX Cycle Conditions as of 10/3/02
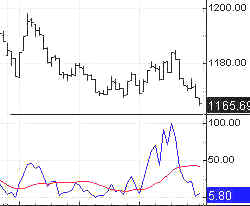
PTT - Periods Till Turn Nasgap Charts Long Term (9/30/02) Confirmation of the 6 month cycle sell signal will come when the smoother line (red), which is a time series of the indicator line (navy), begins to flatten. Late signals are usually a sign of a much bigger move to come. They happen when one phase of a cycle is much shorter than typical, under the influence of larger downtrending waves. The down phase of this cycle should last into next year and carry well below 1000. Then we could see a big rally of the 4 year cycle low, which might bring the Nasty all the way back up to the level of the breakdown currently in progress. In the long term, we are looking at a situation like Germany's Neuermarkt, which shut down last week. The handful of large companies which remain will have no choice but to move to the NYSE. The 100 Nads will be reduced to 10. Cycle Chart Short Term Cycles The Nasty looks ready to do a big bottom dropping. The 8 day and 13 day cycles topped out. The preliminary downside cmap is 1100-1140 over the next few days. The 4 week cycle is in a sideways up phase, a non-issue given the strength of the 10-13 week cycle down phase. The 6-7 week cycle is finishing its sideways up phase. Short cycles are not going to give the Nas any help as it fights the plummeting 10-13 week cycle. 10-13 Week Cycle The 10-13 week cycle is in its weakest zone. The cycle indicators remain in sharp downtrends. The cmap is now 1000 to 1050, due any time over the next three weeks.
Fiber Nacho Dump- Support levels and downside targets.
Fiber Nacho Reflux- Resistance levels and upside targets Nasdaq Cycle Conditions as of 10/3/02
PTT
- Periods Till Turn AM Edition Features (Previous) These features are in morning edition, published around 9 AM ET US, or the Saturday Weak End Edition, published, uh, let's see, Saturday! Long Bong Hit - See top of page. Golden Stool- Published daily by 7:30 AM NY time The down phase
of the 6-7 week cycle should end within a week. The cmap is 118. The 13
day cycle cmap points to 116. If those levels do not hold, there's a chance
the HUI could drop to it's long term channel line around 105 before this
down phase ends. This is part of a long consolidation process that
should continue well into 2003. Uncle Buck's Illness- Published daily by 7:30 AM NY time]
Buck is in his last short cycle up phase before breaking down to test the
lows. Suctor Watch and Stoolwethers- Now posted on separate page. Updated each morning between 8 AM and 9:30 AM NY time. See you in Intraday Stool. Dr. Stepan N. Stool Share your thoughts on the Stool Pigeons Wire.
Renewals Welcome, and thank you for subscribing to the Anals of Stock Proctology. Your trial subscription will run for 90 days. At the end of that period your subscription will renew automatically, unless you cancel. If you wish to cancel your subscription use the button below. If you want to renew your subscription do nothing. Your subscription will renew and your credit card or Paypal bank account will be charged. If you want to renew, be sure your credit card information in your Paypal account is current. Paypal will not renew your subscription if the card has expired! Again, thanks for subscribing!
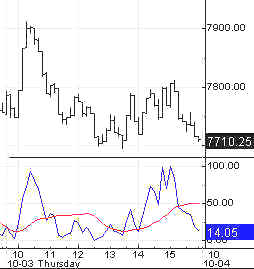
Explanation of Intraday Commentary-Build charts at http://www.livecharts.com. For custom time bars insert a comma after symbol and number of minutes, e.g. compx,90. This will give you a bar chart of the Nas with 90 minutes per bar. The one day cycle is usually most clear with 8 minute bars and 26/18 stochastics. It varies from day to day. Sometimes 6 minutes works best. Experiment to find the best fit for your trading style, and the market's dominant frequency at the time. The goal here is primarily to monitor the condition of the 8 and 13 day cycles. I typically use 90 minute bars with 26/18 stochastics for the 13 day cycle proxy on the indices during regular trading hours. Other cycles use 26/18 stochastics with the following: 8 days- 60 minute bars On the 24 hour futures charts, use a time per bar approximately 3 to 4 times the above number of minutes, to represent the cycles listed above. ABBREVIATIONS: cma: centered moving average
|
|||||||||||||||||||||||||||||||||||||||||||||||||||||||||||||||||||||||||||||||||||||||||||||||||||||||||||||||||||

![[Most Recent HUI from www.kitco.com]](http://www.weblinks247.com/indexes/idx24_hui_en_2.gif)
![[Most Recent XAU from www.kitco.com]](http://www.weblinks247.com/indexes/idx24_sp500_en_2.gif)
![[Most Recent Quotes from www.kitco.com]](http://kitconet.com/charts/metals/gold/t24_au_en_usoz_2.gif)