|
Archives 12/30/01, 1/1/02, 1/2/02, 1/3/02, 1/4/02, 1/7/02, 1/8/02, 1/09/02, 1/10/02, 1/11/02, 1/14/02, 1/15/02, 1/16/02, 1/17/02, 1/18/02, 1/22/02, 1/23/02, 1/24/02, 1/25/02, 1/28/02, 1/29/02, 1/30/02, 1/31/02, 2/1/02, 2/4/02, 2/5/02, 2/06/02, 2/7/02, 2/9/02, 2/11/02, 2/12/02, 2/13/02, 2/14/02, 2/16/02, 2/19/02, 2/20/02, 2/21/02, 2/23/02, 2/25/02, 2/26/02, 2/27/02, 2/28/02, 3/1/02, 3/04/02, 3/05/02, 3/06/02, 3/7/02, 3/10/02,3/11/02, 3/12/02, 3/13/02, 3/14/02, 3/15/02, 3/18/02, 3/19/02, 3/20/02, 3/21/02, 3/22/02, 3/25/02, 3/26/02, 3/28/02, 3/30/02 4/1/02, 4/2/02, 4/3/02, 4/4/02, 4/6/02, 4/8/02, 4/9/02, 4/10/02, 4/11/02, 4/13/02, 4/15/02, 4/16/02, 4/17/02, 4/18/02, 4/20/02, 4/22/02, 4/23/02,4/24/02,4/25/02, 4/26/02, 4/27/02, 4/29/02, 4/30/02 5/01/02, 5/2/02, 5/4/02, 5/6/02, 5/07/02, 5/8/02, 5/09/02, 5/10/02, 5/13/02, 5/14/02, 5/15/02, 5/16/02, 5/17/02, 5/20/02, 5/21/02, 5/22/02, 5/23/02, 5/24/02, 5/28/02, 5/29/02, 5/30/02 6/01/02, 6/3/02, 6/4/02, 6/5/02, 6/6/02, 6/7/02, 6/10/02, 6/11/02, 6/12/02, 6/13/02, 6/14/02, 6/17/02, 6/18/02, 6/19/02, 6/20/02, 6/22/02, 6/24/02, 6/25/02, 6/26/02, 6/27/02, 6/30/02 7/1/02, 7/4/02, 7/5/02, 7/11/02, 7/14/02, 7/15/02, 7/16/02, 7/17/02, 7/18/02, 7/19/02, 7/22/02, 7/23/02, 7/24/02, 7/25/02, 7/27/02, 7/29/02, 7/30/02 8/1/02, 8/3/02, 8/5/02, 8/6/02, 8/7/02, 8/8/02, 8/10/02, 8/12/02, 8/13/02, 8/14/02, 8/15/02, 8/16/02, 8/19/02, 8/20/02, 8/21/02, 8/22/02, 8/23/02, 8/26/02, 8/27/02, 8/28/02, 8/29/02, 8/30/02 9/3/02, 9/4/02, 9/5/02. 9/6/02, 9/9/02, 9/10/02, 9/11/02, 9/12/02, 9/13/02, 9/16/02, 9/17/02, 9/18/02, 9/19/02, 9/20/02, 9/23/02, 9/24/02, 9/25/02, 9/26/02, 9/27/02, 9/30/02
|
The Anals of Stock ProctologyPublished weeknights by
8:30PM Happy Acres, Florida Time The American Academy of Stock Proctology and Is your subscription up for renewal? If you want to renew, do nothing, unless your credit card has expired. Please be sure your credit card info is current. If your credit card has expired, you must enter the new expiration date in your Paypal account in order for your subscription to be processed. If you subscribed via Paypal, your subscription will be renewed for one year on the 90 day anniversary of your sign-up and your credit card will be charged. If you want to cancel, use the button at the bottom of the page. This applies only if you subscribed through Paypal. Mailed-in subscriptions are for 1 year. If you subscribed by prior contribution, I will send you a notice before your subscription expires. If you have any questions, see the subscription page and FAQ's. If you can't find the answer, email me. Update 10/7/02 12:30 PM Terms and methodology The 5 hour cycle lows due this afternoon look like they will correspond with the 8 day cycle lows posted in the table below. There's a good chance that the 8 day lows due Wednesday will be significantly lower, tentatively SPX 750, Nas 1100, and 100 Nads 775. Looks like the market is just going to waffle slowly lower, with nothing dramatic either way. Update 10/7/02 12:30 PM Terms and methodology The didn't quite give up the ghost this morning. Only the Nas hit it's 1 day cycle cmap. The 5 day low may be in, but the 8 day cycle is still down, and unless the recovery picks up a bit of steam, the 5 day cycle up phase probably won't amount to anything. So Doc will focus on the 8 day low, which would be due Wednesday-Thursday. It looks like the market will just ease lower gradually. First they'll try to poke their heads up a few times this afternoon, but not too much higher than current levels. Allow those upside cmaps to stretch a point or two.
Update 10/7/02 9:15 AM Terms and methodology Not much change from the outlook after Friday's action.
Nothing in the futures this morning that would change that outlook. The 1 day cycle low projections are a bit anticipatory. Doc may have to cancel them if the market does not start down soon after the open. Doc expects lows around mid-day. After that we need to be looking for signs of the enema of the shorts. The fucutures closed in an up phase. Doc expects some waffling for the first half hour or so.
Doc does not make trading recommendations. This update reports intraday time cycle estimates and centered moving average projections based on the Hurst cycle analysis method. Doc assumes no responsibility for the accuracy or inaccuracy of these estimates and projections. The market may or may not meet these projections. New stoolies should thoroughly familiarize themselves with the methodology before trading based on this method. There is no free lunch. Those who do not have the time or inclination to develop a trading strategy based on testing and research should not trade. Trade at your own risk.
Weak End Anals (10/6/02) Doc has been behind the eight ball this weekend, as he's been visiting Dad in the hospital. Dad sends his thanks to all you stoolies who have sent your prayers and good wishes. You have helped to brighten his spirits, and he's feeling pretty good! Whatever you are doing, it's working. Keep it up! Doc and his family say, as always, many many tanks and dungs a lot. And now without further adoodoo, here's all the news that no one else see fit to print. The Feed drained $3 billion by not rolling over Thursday's overnight repos. The massive draining last week is extraordinary because Feed was already growing slowly, while the market has been weak. This action supports what Doc has been saying for months. The Feed has cut the market loose to fend for itself. While no doubt Sir Printsalot will step in, in the event of a market collapse, he has bigger fish to fry at the moment. One can only guess what the strategy is. Is it possible, as suggested by stoolie jrcsoft, that the Feed is supplying less because the banking system is demanding less? Doesn't seem so to Doc, because the bid to cover ratio is still sky high. Post your theories on the Stool Pigeons Wire. The Feed Index broke the 8% growth channel, and is again in the lower half of the no-growth channel. Doc said Thursday, "They have to know the market will collapse without [Feed]." After Friday's horrendous performance, it would be shocking not to see a giant Feed on Monday. The Fed has scheduled an emergence meeting Monday morning. Doc heard the hors d'oeuvres will be JPM cow chips. If they come with the big one, watch for an upturn after 2 PM, especially if the cmaps are hit. Three trends are evident on
the Feed Index. One is the 10% growth trend beginning in May of 2001. Feed
growth has recently been at or below the lower boundary of that trend. The
blue channel going back to last December suggests that Al may now be
targeting an 8% growth rate. Then there's the golden box which says he's stopped growing Feed altogether over the last three months. The fast Feedometer continued its collapse. The downtrend is accelerating. Their modus operandi of late has been to add as little as necessary to stop a market meltdown, after it starts, then to take it back as soon as the market stabilizes. If the overnight futures are weak, Doc would be shocked if we didn't see an enormous Feed. Then again, with the emergency meeting not scheduled until after the normal hours of open market ops, perhaps they will wait until Tuesday. The
Feedometer theoretically
measures excess Feed available for bond or stock market jamming. 10 Year Bond yields were unch 3.68
and prices are now at the top of the channel which has contained the trend
for months. The 10-13 week cycle cmap
remains 3.60, which has already been hit. The 10-12 month cycle cmap is 3.50, which is
also a long term resistance level. The intermediate cycle oscillator is close
to indicating an upturn. That would be extremely bearish for the bond market, and would signal
the closing of the refi window which has been keeping the financial system
on life support. We don't want to jump the gun though. Conflicting
signals remain. The trend is the trend until it isn't. The long term chart indicates that
a final dip to 3.50 is still a possibility before this parabolic blowoff
of a 20 year bull market ends. Financial and Economic Indicators October 3 Suctor Watch and Stoolwethers- Now posted on separate page. Updated each morning between 8 AM and 9:30 AM NY time.
All of Doc's
cycle charts
are powered by METASTOCK Portfolio Sphincters Index (SPX) and Sentiment Long Term
(10/6/02) The six month cycle oscillator has not yet confirmed a downturn. This cycle is topping out a sideways up phase as it moves across the 2 year cycle channel. The weakness of the up phase and the amount of time left in the cycle suggest devastating losses through January. However, the descending lower trendline should be able to generate a 10-13 week cycle upturn within the next few weeks. Swing traders will want to cover at that point and look for re-entry after a rally. The 4 year cycle can be anywhere from 3 to 5 years in duration. The 1920's bubble wave lasted more than 6 years from initial launch to final bottom, with an interim low after the crash in November of 1929, a little more than 3 years after the onset of the bubble. The September 2001 low was at a similar point relative to the 1998 low. Think of the bubble wave like a tsunami. It is far bigger, longer lasting and far more destructive than the typical 4 year cycle. The 4 year cycle is barely an eddy in the tsunami wave. Given the 4 year cycle low in October 1998, certainly we need to be on the lookout for conditions indicating a four year cycle low. We also need to be aware that we may have already seen the low September 2001. (Hey the bulls were right! For 3 months.) Evidence of a 12 year cycle suggests that the final bear market low may not be seen until 2007. The long term linear
regression analysis suggests the market may be weakening. For the first
time, a major rally was unable to surpass the central regression line. The
subsequent selloff has fallen below regression channel projections
constructed between various sets of highs and lows. We'll find out in the
next few weeks if the market is establishing a sharper angle of descent. Sentiment and Momentum
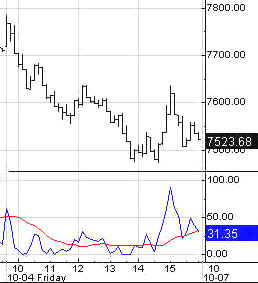
Indicators Short Term Cycles The SPX fell into the lower half of the downtrend channel on Friday. The tentative cmap is 745 on the 13 day cycle low due late this week. The lower channel boundary is 780. Touching or penetrating that should trigger a short rally or consolidation. The weak and unpredictable sideways up phase of the 6-7 week cycle appears to have ended. It's not going to give the bulls any help for a few weeks. The 4 week cycle is also a non-issue. 10-13 Week Cycle The 10-13 week cycle indicator again fell to a new bear market low. It could bottom any time over the next 13 days. Some indicators look Dover Sole, but the final phase of the decline is usually the sharpest. Because of this uncertainty, the cmap range of 680 to 760 is unusually broad. The cycle indicators have not flashed a turn signal. The flasher is on in the trading stoolicator. However, a full-fledged buy signal is only confirmed when both lines turn higher. Until they do, the downtrend has the potential to steepen into a V shaped low. VIX The VIX rose to 46.28, just below the center of the inverted scale 6 month cycle Stool Band. This indicator, like the market, is trending, near neither a high nor a low, and it does not yet indicate a the kind of fear extreme that would lead to a significant reversal.. Cycle Chart
Fiber Nacho Dump- Support levels and downside targets.
Fiber Nacho Reflux- Resistance levels and upside targets The Cycle Conditions tables include cycle phase and a wild guess as to number of periods to the next turn, in days for the shortest cycles, weeks (W) or months (M) for the longer ones. This is a fluid exercise, in other words, the projections are likely to be wrong, but they force us to be vigilant for key turning points, and frequently work well enough to prevent costly misreadings. SPX Cycle Conditions as of 10/4/02
PTT - Periods Till Turn Nasgap Charts Long Term (10/6/02) Confirmation of the 6 month
cycle sell signal will come when the smoother line (red), which is a time
series of the indicator line (navy), stops rising. Late signals are
usually a sign of a much bigger move to come. They happen when one phase
of a cycle is much shorter than typical, under the influence of
larger downtrending waves. The down phase of this cycle should last into
next year and carry well below 1000. The 2 year cycle trough is not due
until mid year, although the price low could come several months early or
late. This is a monthly chart with long term CMAPS. Measured on a percentage basis the projected low for the 4 year cycle is 1000. On a whole number basis, it's -500. That's negative 500. ( That's where the seller says, hey, I'll pay you 500 bucks to just tow it away.) The 8 year cycle projection is purely hypothetical and probably overly optimistic. Doc expects most companies on the Nasdaq to disappear. The ones that are left, probably only Mircroprice, and Farmer in the Dell, will have to go over to the NYSE.
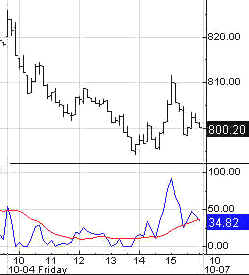
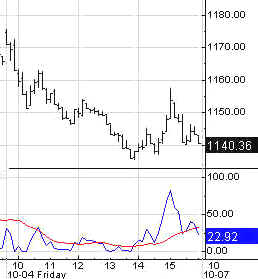
Cycle Chart Short Term Cycles The Nasty remains in an orderly downtrend. With no signs of panic yet, it's hard to see any pretext for a real bottom. The 13 day cycle has a few days to run and a downside cmap of 1080. The 4 week cycle is a non-issue given the strength of the 10-13 week cycle down phase. The 6-7 week cycle is once again kaputski as well. Short cycles are not going to give the Nas any help as the 10-13 week cycle slashes and burns its way into the abyss. 10-13 Week Cycle The 10-13 week cycle is in its weakest zone. The early warning signal from the stoolicator puts us on alert, but until it turns up, the trend remains unaffected. The cycle indicators remain in sharp downtrends. The cmap is now 1000 to 1050, due within the next 13 days.
Fiber Nacho Dump- Support levels and downside targets.
Fiber Nacho Reflux- Resistance levels and upside targets Nasdaq Cycle Conditions as of 10/4/02
PTT
- Periods Till Turn AM Edition Features (Previous) These features are in morning edition, published around 9 AM ET US, or the Saturday Weak End Edition, published, uh, let's see, Saturday! Long Bong Hit - See top of page. Golden Stool- Published daily by 7:30 AM NY time Gold
stocks continue their consolidation. This phase could last another 2 months or
more, depending on how prices act at the lower 3 year cycle channel line
(green). Doc would expect to see another strong rally at that
point. The short
cycle cmaps are 118-120. If this level does not hold, then a dip to 106 is
possible. If it holds here, we'll see another reaction rally, but probably
not a test of the highs on this trip. Doc also
expects the price of gold to enter a long period of consolidation. The 6
month cycle indicator is in a top zone. Any pullbacks should hold above
the305-310 area. Uncle Buck's Illness- Published daily by 7:30 AM NY time]
The sideways up phase in the 6 month cycle (green) suggests that Uncle
Buck is eventually going to fall out of bed. But Doc keeps asking, against
what? All the currencies are in their death beds. What will the dollar be
sold against?
The daily chart reflects the impact of multiple cycle juxtaposition.
Friday's action was the pop foreshadowed by the upturn in the short cycle
oscillator. This should be the last rally in the 6 month cycle top phase,
but it looks like it will be awhile before the 10-12 month cycle peaks.
The 13 week cycle is still heading down. Buck will stay rangebound until
the 10-12 month cycle rolls over, probably within 3 months. Suctor Watch and Stoolwethers- Now posted on separate page. Updated each morning between 8 AM and 9:30 AM NY time. See you in Intraday Stool. Dr. Stepan N. Stool Share your thoughts on the Stool Pigeons Wire.
Renewals Welcome, and thank you for subscribing to the Anals of Stock Proctology. Your trial subscription will run for 90 days. At the end of that period your subscription will renew automatically, unless you cancel. If you wish to cancel your subscription use the button below. If you want to renew your subscription do nothing. Your subscription will renew and your credit card or Paypal bank account will be charged. If you want to renew, be sure your credit card information in your Paypal account is current. Paypal will not renew your subscription if the card has expired! Again, thanks for subscribing!
Explanation of Intraday Commentary-Build charts at http://www.livecharts.com. For custom time bars insert a comma after symbol and number of minutes, e.g. compx,90. This will give you a bar chart of the Nas with 90 minutes per bar. The one day cycle is usually most clear with 8 minute bars and 26/18 stochastics. It varies from day to day. Sometimes 6 minutes works best. Experiment to find the best fit for your trading style, and the market's dominant frequency at the time. The goal here is primarily to monitor the condition of the 8 and 13 day cycles. I typically use 90 minute bars with 26/18 stochastics for the 13 day cycle proxy on the indices during regular trading hours. Other cycles use 26/18 stochastics with the following: 8 days- 60 minute bars On the 24 hour futures charts, use a time per bar approximately 3 to 4 times the above number of minutes, to represent the cycles listed above. ABBREVIATIONS: cma: centered moving average
|
|||||||||||||||||||||||||||||||||||||||||||||||||||||||||||||||||||||||||||||||||||||||||||||||||||||||||||||||||||

![[Most Recent HUI from www.kitco.com]](http://www.weblinks247.com/indexes/idx24_hui_en_2.gif)
![[Most Recent XAU from www.kitco.com]](http://www.weblinks247.com/indexes/idx24_sp500_en_2.gif)
![[Most Recent Quotes from www.kitco.com]](http://kitconet.com/charts/metals/gold/t24_au_en_usoz_2.gif)