|
10 Minute Bar Charts 6/11/02 Dow Jokes Inflatables
Archives 12/30/01, 1/1/02, 1/2/02, 1/3/02, 1/4/02, 1/7/02, 1/8/02, 1/09/02, 1/10/02, 1/11/02, 1/14/02, 1/15/02, 1/16/02, 1/17/02, 1/18/02, 1/22/02, 1/23/02, 1/24/02, 1/25/02, 1/28/02, 1/29/02, 1/30/02, 1/31/02, 2/1/02, 2/4/02, 2/5/02, 2/06/02, 2/7/02, 2/9/02, 2/11/02, 2/12/02, 2/13/02, 2/14/02, 2/16/02, 2/19/02, 2/20/02, 2/21/02, 2/23/02, 2/25/02, 2/26/02, 2/27/02, 2/28/02, 3/1/02, 3/04/02, 3/05/02, 3/06/02, 3/7/02, 3/10/02,3/11/02, 3/12/02, 3/13/02, 3/14/02, 3/15/02, 3/18/02, 3/19/02, 3/20/02, 3/21/02, 3/22/02, 3/25/02, 3/26/02, 3/28/02, 3/30/02 4/1/02, 4/2/02, 4/3/02, 4/4/02, 4/6/02, 4/8/02, 4/9/02, 4/10/02, 4/11/02, 4/13/02, 4/15/02, 4/16/02, 4/17/02, 4/18/02, 4/20/02, 4/22/02, 4/23/02,4/24/02,4/25/02, 4/26/02, 4/27/02, 4/29/02, 4/30/02 5/01/02, 5/2/02, 5/4/02, 5/6/02, 5/07/02, 5/8/02, 5/09/02, 5/10/02, 5/13/02, 5/14/02, 5/15/02, 5/16/02, 5/17/02, 5/20/02, 5/21/02, 5/22/02, 5/23/02, 5/24/02, 5/28/02, 5/29/02, 5/30/02 6/01/02, 6/3/02, 6/4/02, 6/5/02, 6/6/02, 6/7/02, 6/10/02
|
The Anals of Stock ProctologyPublished 5 times
per week by the American Academy of Stock Proctology and PM Update 6/12/02 12:20 PM Terms and methodology Updating a little early today as the bottom has dropped out and all the downside cmaps were broken. The downslope is now too sharp to enable upside projections on the shortest cycles. The lows hit a few minutes ago were consistent with the concurrent downside cmaps. This looks like no more than a 3 hour cyclette low. The 3 hour cyclette is due to peak between 1 and 2 PM. The 1 day cycle should be down for the remainder of the PM.
AM Update 6/12/02 8:45 AM Terms and methodology Fucutures have remained flat, slightly above the NY close. Oops, they just started dipped again. The 1 day cycle low should have been yesterday at the close but look for an aftershock this morning, any time before 11 AM. The problem is that a 1 day cycle high is also due at 11 AM. So is the cyclicality positive or negative this morning? Don't know, but we do have centered moving average projections for the lows, and guesses as to the likely time for cycle highs. A second 1 day cycle high is due around 1-2PM.
The Bull Paradox (6/11/02) Think back to 6 months ago, December-January, the top of the post 911 rally. Everything that's happening in the market now was foreordained at that point, carved in stone. It would have been impossible for things to transpire differently from the way they have. Why is that? Because by January, the entire Alice in Wonderland World of Wall Street had gone stark raving bullish. Outside of Doc and a few of his fellow crazies, and of course you stoolies, there were NO BEARS. Doc was even on the verge of that first floor window ledge next to his compuker. That's how bad it was. And that's why the outcome was foreordained. Because if everybody has already bought, there's no one left to buy. Prices can only go one way. Which is why it's so important to follow all the financial infomercials, Crapolavision, SeeBS. Markethype, Barrens, The Whine Street Journal. You gotta watch Lou Gubrious, and listen to Maria, and all the rest, and especially all the poodits and anlcysts that The Street trots out to hawk its wares. Because when they're all singin' in unison, you know it's wrong. Dead wrong. Rule Number 1 of Stock Proctology: When The Street reaches a unanimous consensus, it is, by definition, wrong. Because it's impossible for the market to continue in the direction of the consensus once it's reached. They've all placed their bets and the cash is spent. In spite of what some poodits think, liquidity is the only thing that matters. For the last three months, there's been none. And until they decide to actively liquidate, until we see a crescendo of selling leading to a climactic liquidity building panic, there won't be. The Feed
took no action today after yesterday's $7.5
billion in 3 day repos. They are well below their trend growth for Total
Feed, so with the stock markets falling apart today, and the bond market
rallying, there's room for them to drop a really big load. At this
point it may not do any good. They were pumping like mad last
summer, and it didn't do one iota of good. The Gang of 22 primary dealers
will step aside until they see that all selling has been washed out. This
is not a gang of altruists we are talking about, although one may guess
that Al has the levers to make them do his bidding when necessary. Since
March it seems that he has not had the desire to stop this meltdown. Doc
doesn't pretend to know what Al's motivation is, (whatever it is, it's
wrong) but at some point in this collapse we are going to see a truly
gargantuan Feed. We'll just have to decide on the basis of the market
action at that time whether we need to respect it and step out of our
short positions. For the time being, the Fed's lack of aggressiveness is clearly
hurting the market. The lagging Slow Feedometer is
flattening after a minor hump. The hump was totally a result of the giant
Feed the week before the Treasury's 2 Year Note Auction, designed to
grease the skids for the auction. Once the issue was absorbed, Al, the
Indian giver, took the $28 billion in excess Feed back. That entire hump
was absorbed by the Treasury sale. Nothing was left over for stocks. Last
year, Al began Feeding the market steadily at the end of June. That went
for 10 weeks and then jumped sharply after 9/11. None of it was sufficient
to turn the market. The selling pressure, or more precisely, the lack of
real investment demand, was simply too great to overcome. Similar conditions
exist today. The market's downward momentum is beginning to take on a life
of its own.
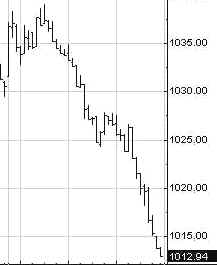
Portfolio Sphincters Index (SPX) and Sentiment The Sphincters Index fell 17, or 26 from the high of the day. Another two days, and I can't wait to hear what the "slow stealth" bull market crowd has to say. Not that it matters, they'll still draw their obscene 7 figure paychecks from the obscene management fees they pick out of your pocket. The 17 day rate of change, which represents the 6-7 week cycle, and the 6-7 week oscillator superimposed on the price chart, fell. The 10-13 week cycle oscillator (teal) dropped for the second day. This is a lagging, confirming indicator, but it's real early in this mess. If the cycle runs it's full term, which is at least another 6 weeks, the losses are going to be mind bending. The centered moving average projections are only pointing to the mid 900 area. If that's right, the cycles will end early. If they go full term, the bottom will be much lower. The 29 day rate of change is still flat in a negative pattern indicating trending. This will go on until there's acceleration and a selling crescendo. Don't call it capitulation. A selling climax is not capitulation. The VIX rose to 27.46. On the inverted scale chart, VIX remains near the center of the declining Stool Band. The market is now moving from mild concern to deep concern, in its ultimate journey to fear and finally, outright panic. With a downtrending Stool Band, what was "extreme" enough in the last couple of cycles to indicate a turning point will no longer be. The big low won't come until the VIX is well above 35, and breaks the lower Stool Band in its final panic stage. The blue channel lines are the extension of a linear
regression channel from the February and May 2001 highs. The 6 month cycle
oscillator is inching lower. The trading
stoolicator has just begun to turn down. The late signal is a confirmation
that this trend has a long way to go. The short cycle oscillator corrected
upward and stalled in negative territory. The 10-13
week cycle oscillator is heading down. The market is heading for a
test of the September low. There's enough time in this 10-13 week wave
for a brief bounce off the low, then another big selloff which will almost
certainly break the lower long term channel band before the selling is
exhausted. The SPX dropped back to an exact double 161.8%
fibo retracement level. Below that, nothing but air. The Cycle Conditions tables include cycle phase and a wild guess as to number of periods to the next turn, in days for the shortest cycles, weeks (W) or months (M) for the longer ones. This is a fluid exercise, in other words, the projections are likely to be wrong, but they force us to be vigilant for key turning points, and frequently work well enough to prevent costly misreadings. SPX Cycle Conditions as of 6/11/02
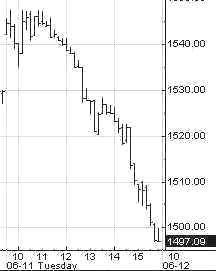
PTT - Periods Till Turn Nasgap Charts The Nasty took a 33 1/2 point dump, or 50 points almost straight down from the AM high. The 6 month cycle time series spread is still stalled. Flat below zero is negative, representing a trending market. The 10-13 week cycle oscillator and the trading stoolicator just flashed sell signals a couple of days ago. It's early in this trend. The short
cycle oscillator actually corrected off the low, and barely turned lower.
It is hard to imagine a more bearish looking picture. The
Nascrap 100 broke the September closing low. Remember all the worries
about the rebalancing of the index at the beginning of the year. They can
juggle the books all they want. The bear will get his due. One conventional
measuring technique is to measure from the top to the bottom of a
formation. That distance supposedly will be the amount the market falls
from the baseline. 1700 minus 1100 is, let's see, 1,2,...600, right.
Subtract that from 1100 and what do you get? Well, maybe, maybe not. Let's
just say, it's gong lower. There are
no serious fib levels between here and the September lows, although the
1425 level should be a temporary rest area. Like on the turnpike.
Stop for 10 minutes, and then head off in the same direction. Nasdaq Cycle Conditions as of 6/11/02
PTT
- Periods Till Turn The 10 year fell below 5%.
Most signs point lower, but it's by no means a slam dunk. The indicators
are all in position to reverse at any time. As long as the stock market
stays weak, bonds will be strong and yields will decline. The dirty
SOX is accelerating to the downside as it heads for the 350 area. Continuing
the theme of the Street must be wrong by definition, let's look at some of
the groups the analcysts and poodits universally loved as recently as a
few weeks ago. First, energy. Universal bullishness in March. What
happened? Top. Drugs- universal bullishness throughout 2000 and 2001, right up through March. The longer they stay bullish, the bigger the top and the worse the drop.
Consumer
stocks. Was there anybody on the Street who didn't LOVE this group right
through this week. Jimmy Jones Crammer's on the radio everyday telling
people to buy what they see in the supermarket. Might as well be Jonestown
KoolAid. General
Custer keeps making last stands. The 29 day rate of change, representing
the 10-13 week cycle is beginning to roll over. That suggests that this is
a top, not a bottom. This is an 18 dollar stock. Is Fannie
finally ready to give it up, or will it bounce again at 75. Somebody call
Channelingstocks.com. Doc thinks the stock will break down this time.
Momentum is clearly getting worse on all the indicators. Stoolie
Keith sent in a request for KO-pectate. Keith said something about price
to sales. Of course, Doc doesn't know from funny mentals, but here's the
chart. If this were a bull market, this would be a nice chart.
Everything's relative. Short term, I'd be inclined to cover when the short
term ozzies begin to turn up. For now I'd look for 52-51. Henceforth and forevermore, if you would like to request a "stocko", please post your request in Dear Dr. Stool. If you have not already registered for the message board, please do so. The only required info is user name and password which you choose yourself, and your email address, which you can keep private by selecting the keep private option. Doc looks forward to featuring your ideas. We've had some good ones! Uncle Buck's Illness
They gave buck a transfusion this morning. He's back on the heart lung
machine in room 111. But his days are numbered, and the family is once
again gathered by the bedside. Golden Stool Yesterday Doc
reported that the 4 week centered moving average projection was 116 on the
HUI. It got there yesterday and turned on a dime. The short cycle ozzies
are all still negative. See you in Intraday Stool. Dr. Stepan N. Stool Let me know what you think on the Stool Pigeons Wire. Previous complete issue with all features Welcome To New Subscribers Welcome, and thank you for subscribing to the Anals of Stock Proctology. You may note some subtle differences in style now that this is no longer a free service. The perspective is still bearish, but it will have a more balanced approach than my message board ravings. You won't see me screaming "BUY" about anything except perhaps gold, but you will see stronger indications of areas and times when I think it might be a good idea to avoid being short. And I promise that I will lose my temper from time to time to keep you entertained! There's also a new feature, Doc's By Request Stock O' The Day. If you have a stock you're interested in, send an email to [email protected], naming the stock, and why you think Doc should look at it, in 25 words or less. 26 words, and you're disqualified! Those that look interesting, Doc will try to feature here within the next day or two. If you have suggestions about other features you'd like to see, send them along to [email protected]. Again, thanks for subscribing!
Explanation of Intraday Commentary-Build charts at http://www.livecharts.com. For custom time bars insert a comma after symbol and number of minutes, e.g. compx,90. This will give you a bar chart of the Nas with 90 minutes per bar. The one day cycle is usually most clear with 8 minute bars and 26/18 stochastics. It varies from day to day. Sometimes 6 minutes works best. Experiment to find the best fit for your trading style, and the market's dominant frequency at the time. The goal here is primarily to monitor the condition of the 8 and 13 day cycles. I typically use 90 minute bars with 26/18 stochastics for the 13 day cycle proxy on the indices during regular trading hours. Other cycles use 26/18 stochastics with the following: 8 days- 60 minute bars On the 24 hour futures charts, use a time per bar approximately 3 to 4 times the above number of minutes, to represent the cycles listed above. ABBREVIATIONS: cma: centered moving average |
|||||||||||||||||||||||||||||||||||||||||||||||||||||||||||||||||||||||||||||||||||||||||||||||||||||||||||||||
![[Most Recent XAU from www.kitco.com]](http://www.weblinks247.com/indexes/idx24_nasdaq_en_2.gif)
![[Most Recent XAU from www.kitco.com]](http://www.weblinks247.com/indexes/idx24_sp500_en_2.gif)
![[Most Recent Quotes from www.kitco.com]](http://kitconet.com/charts/metals/gold/t24_au_en_usoz_2.gif)
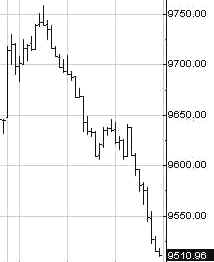
 The
stage managers were masterful again today, taking the market up early to
establish short positions, and stepping aside the rest of the day. They
know what's coming. The Dow fell 240 points from the AM high to close at
9510. There's more where that came from. The centered moving average
projection for the 10-13 week cycle is now down to 9050. These projections
change from day to day. But it's clear that a lot of damage is yet to be
done.
The
stage managers were masterful again today, taking the market up early to
establish short positions, and stepping aside the rest of the day. They
know what's coming. The Dow fell 240 points from the AM high to close at
9510. There's more where that came from. The centered moving average
projection for the 10-13 week cycle is now down to 9050. These projections
change from day to day. But it's clear that a lot of damage is yet to be
done.