|
Archives 12/30/01, 1/1/02, 1/2/02, 1/3/02, 1/4/02, 1/7/02, 1/8/02, 1/09/02, 1/10/02, 1/11/02, 1/14/02, 1/15/02, 1/16/02, 1/17/02, 1/18/02, 1/22/02, 1/23/02, 1/24/02, 1/25/02, 1/28/02, 1/29/02, 1/30/02, 1/31/02, 2/1/02, 2/4/02, 2/5/02, 2/06/02, 2/7/02, 2/9/02, 2/11/02, 2/12/02, 2/13/02, 2/14/02, 2/16/02, 2/19/02, 2/20/02, 2/21/02, 2/23/02, 2/25/02, 2/26/02, 2/27/02, 2/28/02, 3/1/02, 3/04/02, 3/05/02, 3/06/02, 3/7/02, 3/10/02,3/11/02, 3/12/02, 3/13/02, 3/14/02, 3/15/02, 3/18/02, 3/19/02, 3/20/02, 3/21/02, 3/22/02, 3/25/02, 3/26/02, 3/28/02, 3/30/02 4/1/02, 4/2/02, 4/3/02, 4/4/02, 4/6/02, 4/8/02, 4/9/02, 4/10/02, 4/11/02, 4/13/02, 4/15/02, 4/16/02, 4/17/02, 4/18/02, 4/20/02, 4/22/02, 4/23/02,4/24/02,4/25/02, 4/26/02, 4/27/02, 4/29/02, 4/30/02 5/01/02, 5/2/02, 5/4/02, 5/6/02, 5/07/02, 5/8/02, 5/09/02, 5/10/02, 5/13/02, 5/14/02, 5/15/02, 5/16/02, 5/17/02, 5/20/02, 5/21/02, 5/22/02, 5/23/02, 5/24/02, 5/28/02, 5/29/02, 5/30/02 6/01/02, 6/3/02, 6/4/02, 6/5/02, 6/6/02, 6/7/02, 6/10/02, 6/11/02, 6/12/02, 6/13/02, 6/14/02, 6/17/02, 6/18/02, 6/19/02, 6/20/02, 6/22/02, 6/24/02, 6/25/02, 6/26/02, 6/27/02, 6/30/02 7/1/02, 7/4/02, 7/5/02, 7/11/02, 7/14/02, 7/15/02, 7/16/02, 7/17/02, 7/18/02, 7/19/02, 7/22/02, 7/23/02, 7/24/02, 7/25/02, 7/27/02, 7/29/02, 7/30/02 8/1/02, 8/3/02, 8/5/02, 8/6/02, 8/7/02, 8/8/02, 8/10/02, 8/12/02, 8/13/02, 8/14/02, 8/15/02, 8/16/02, 8/19/02
|
The Anals of Stock ProctologyPublished weeknights by
8:30PM Happy Acres, Florida Time The American Academy of Stock Proctology and Is your subscription up for renewal? If you want to renew, do nothing, unless your credit card has expired. Please be sure your credit card info is current. If your credit card has expired, you must enter the new expiration date in your Paypal account in order for your subscription to be processed. If you subscribed via Paypal, your subscription will be renewed for one year on the 90 day anniversary of your sign-up and your credit card will be charged. If you want to cancel, use the button at the bottom of the page. This applies only if you subscribed through Paypal. Mailed-in subscriptions are for 1 year. If you subscribed by prior contribution, I will send you a notice before your subscription expires. If you have any questions, see the subscription page and FAQ's. If you can't find the answer, email me. Late note 12:30PM: Add 3-6 points to the 1 day cmaps. Should be ok. PM Update 8/21/02 12:25PM Terms and methodology The choppy market may be due to juxtaposed phases in the 5 and 8 day cycles, with the 5 wanting to go up and the 8 wanting to go down. In the bigger picture, the engine is sputtering. Top building involves lots and lots of churning. The bias is still to the upside from residual momentum, stragglers chasing the move. Cycle recognition problems are compounded by the fact that the dominant waves appear to be two days and three hours, an unusual combo. The 2 day cycle high appears to be due between 1 and 4 PM. A 3 hour cycle high is due at 12:45. That may coincide with a 5 hour cycle high due around 1 PM. But the 1 day cycle looks opposite. Overall it's a real mess. Chop chop. Doc will be looking for the upside to poop out over the next hour, then more chop for the rest of today. It's getting more interesting from the standpoint of shorting, but the safest play is to wait for a lower high. There doesn't appear to be much downside yet. Doc does not make trading recommendations. This update reports intraday time cycle estimates and centered moving average projections based on the Hurst cycle analysis method. Doc assumes no responsibility for the accuracy or inaccuracy of these estimates and projections. The market may or may not meet these projections. New stoolies should thoroughly familiarize themselves with the methodology before trading based on this method. There is no free lunch. Those who do not have the time or inclination to develop a trading strategy based on testing and research should not trade. Trade at your own risk.
AM Update 8/21/02 9:00AM Terms and methodology Fucutures are on a roll this AM following the obligatory 3 AM jam. But the 1 day cycle ozzies on the all sessions futures charts are toppy and beginning to roll over. Weakness should set in after the opening pop. Early highs look like max of 947 on the SPX, 1028 on the NDX, and 1390 on the Nas. Those would be negated if the futures continue to fall into the 9:15 AM close. Once the early pop is exhausted, ideally prices will drift lower into mid-day with the targets posted below. Current configurations lack clarity however. Doc will update when and if he can get a better handle and post a notice on I.D. Stool. Otherwise, look for the next update around 12:45. Doc does not make trading recommendations. This update reports intraday time cycle estimates and centered moving average projections based on the Hurst cycle analysis method. Doc assumes no responsibility for the accuracy or inaccuracy of these estimates and projections. The market may or may not meet these projections. New stoolies should thoroughly familiarize themselves with the methodology before trading based on this method. There is no free lunch. Those who do not have the time or inclination to develop a trading strategy based on testing and research should not trade. Trade at your own risk.
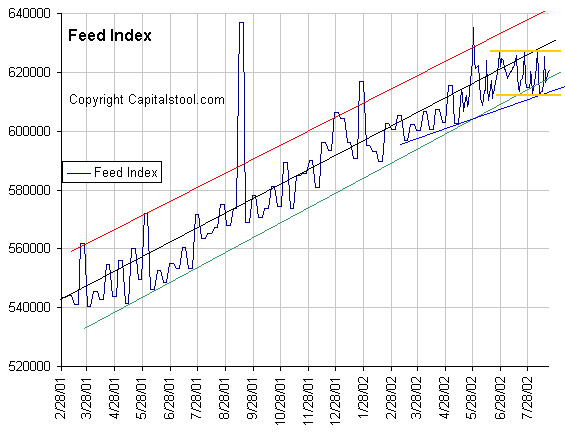
The Golden Calf and Assorted Other Metaphors (8/20/02) Today was the bear's first baby step back. We got a little of what we needed. That was to first stop the upward march of Wall Street's Golden Calf. It's too early to know for sure if this is something significant, but it's a good start. As yesterday's Suctor Watch and Stoolwether review showed, most sectors and leading stocks were testing or breaking key resistance lines. Those lines held and rebuffed the advance. Prices never got close to Monday's close. Still, this rally has a lot of believers among the professionals in The Street's Army of the Golden Calf. Need we remind ourselves that these people are not playing with their own money. They are playing with yours. So how difficult is it for them to believe in something that helps them to hold on to your money and to grab more from other unsuspecting souls. The believers in the Golden Calf, the hopers and dip buyers, are there to keep this market up for as long as possible. It's the only way they can bring in more suckers to replace the ones whose lives and futures they have already destroyed with their false religion. Without a steady stream of new victims, the heartless game by which these people of the Golden Calf live cannot continue. Desperate thieves resort to desperate measures. They will pull out all the stops to keep this rally alive. As Doc sees cyclicality, the first phase of an intermediate cycle up phase is the impulse that comes from the recoil of the bungee. This occurs in the absence of selling in a sold out market. Prices rise rapidly on light volume as shorts cover to take profits, and the sphincters need throw only a little money in the pot to drive the squeezing of the shorts. But then they have to work a little harder, committing more of the cash they picked up in the selloff. This is what Doc thinks of as the residual momentum stage. The bungee recoil begins to run out of steam, there are fewer shorts left to squeeze, and the air gets a little heavier as sellers begin to re-enter the picture. The move slows. The passage of time and higher prices bring forth more sellers. This is the topping phase, where we see the strength of the resistance. Depending on how much fuel the Golden Calf people burned getting to this point, and how many new suckers they can burn, this phase can last for weeks. Six to eight weeks is typical. Looking at the charts, Doc thinks the market may be on the doorstep of that topping phase, but that it hasn't quite gone through that door yet. We're in the residual momentum phase. The Golden Calf people have to commit more cash to keep the game alive. But the going is getting tougher. New victims are getting hard to find. The righteous bearish underground is gathering strength and today conducted its first guerrilla raid. There will be more to come. The battle is not yet won. The hearts and minds of the people have not yet been won over. There will be more raids and pitched battles to be fought along lines yet to be established. At that point the Golden Calf's the supply of new victims to be burned will go dry. The army of the righteous bear will once again drive out Wall Street's golden calf. Doc is counting the days. Literally! The Feed bought $648 million in Treasury Bonds through a coupon pass. Yesterday Doc erroneously reported that $2 billion in 28 day repos expired today. That issue actually expires Thursday. How much the Fed rolls over may be an important signal. There are no expirations Wednesday. The Feed Index, which is the total
of all the Fed's paper holdings, continues to hug the lower line of the 10%
growth channel. The gold lines
indicate that Al is in a cautious, no-growth, holding pattern
over the last two months. The Index will signal a major policy shift if it
drops below the green line and stays there. For now, this may simply be a tactical pause.
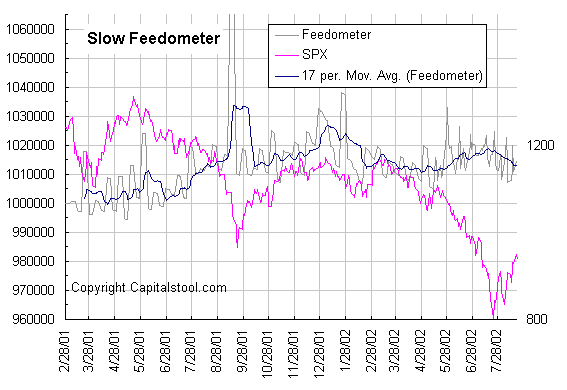
We have to wait to see what happens. The Feedometer,
which theoretically measures excess Feed available for jamming the
market, is sitting dead on the center of its recent downtrend. This
is an uncertain indication, which could go either way. The market's rally
has given Al some leeway to drain, but so far, he's been timid. A drop in
the market may bring forth more pumping. If the market stabilizes here, we
may see more draining, which would indeed precipitate another
collapse.
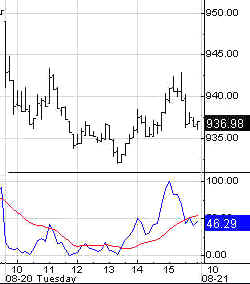
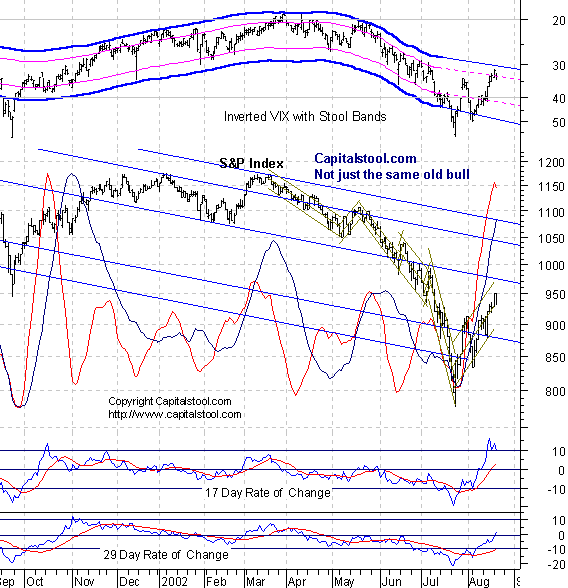
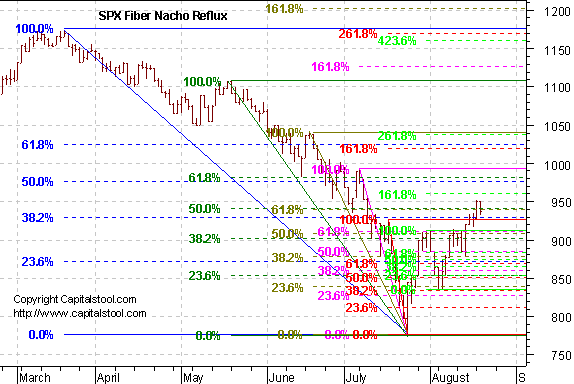
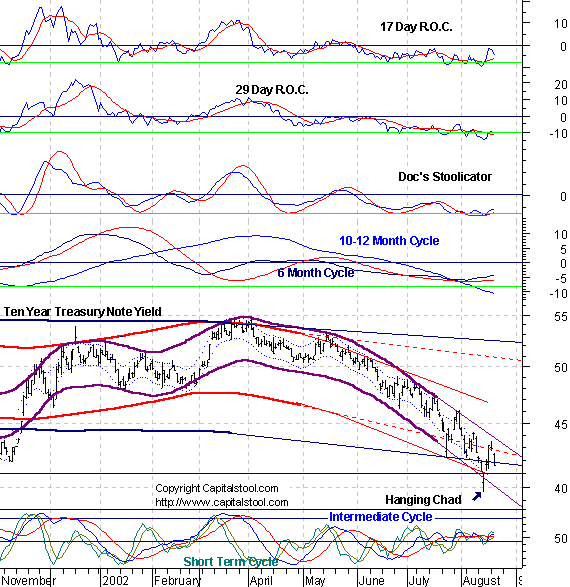
Portfolio Sphincters Index (SPX) and Sentiment
The VIX rose to 32.56. On the
inverted scale chart it is in the top zone of the Stool Band (like a Steel
Band, but without the island music). Ultimately the final peak will
probably not occur until the index and the upper blue band touch. The
superimposed 6-7 week cycle (red line) oscillator turned down, signaling
the peak of that cycle has occurred or is under way. The 10-13 week
oscillator, which normally lags a bit, has yet to confirm. The 17 day rate
of change has made a double peak but the 29 day rate of change is still
rising. These indicators are mirroring the 6-7 and 10-13 week cycle
oscillators. The 6 month cycle is in an up
phase but the index appears to be near the top of the channel (blue) and
through the top of the 10-13 week cycle channel (green). That kind of
blowout often occurs at a top, but all key indicators are still rising.
Until the stoolicator begins to flatten, there's no confirmation of a
high. With the short cycle oscillator heading down, the 4 and 6-7 week
cycles should be going into a down phase, which normally would play out as
a trading range in the early part of a six month cycle. By one
count, shown below, the 10-13 week cycle high could also be now, with a
cmap of 950. An alternative projection puts it 4 weeks out, at 1000. A
down day here would tilt probability more in favor of the first
alternative. Possible cmaps for shorter cycles also have similar
alternatives, as shown in the cycle table. Fiber Nacho Upchuck Levels-
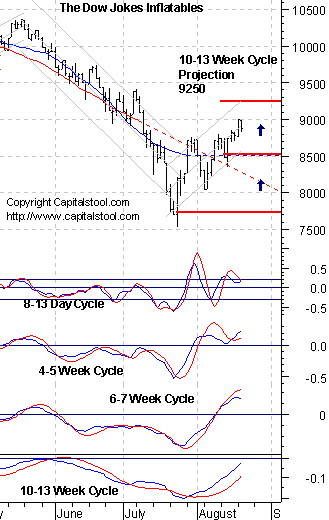
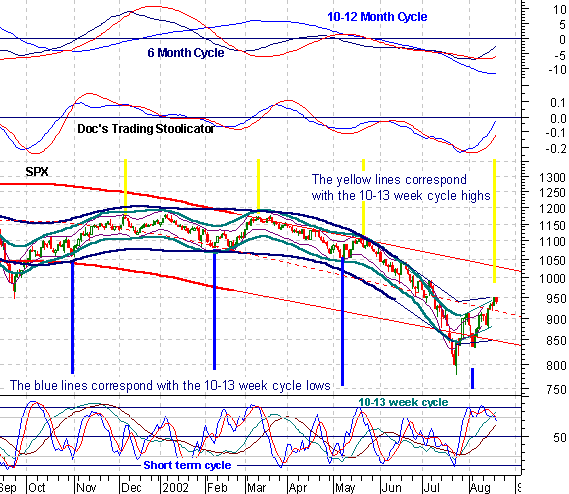
940 was magnetic. The Cycle Conditions tables include cycle phase and a wild guess as to number of periods to the next turn, in days for the shortest cycles, weeks (W) or months (M) for the longer ones. This is a fluid exercise, in other words, the projections are likely to be wrong, but they force us to be vigilant for key turning points, and frequently work well enough to prevent costly misreadings. SPX Cycle Conditions as of 8/20/02
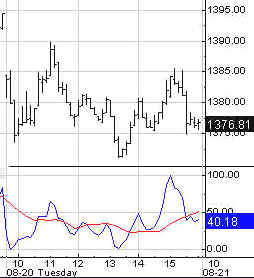
PTT - Periods Till Turn Nasgap Charts The 6 month cycle oscillator rose and the slower 10-12 month cycle oscillator has flattened out of its downward trajectory. A very preliminary upside cmap for the 6 month cycle high is 1445. That is certain to change, either up or down and at this early stage, it should not be given much weight. These cycles are represented by the dark blue and light green channels on the price portion of the chart. Shorter
term oscillators either slowed or dipped, and the 29 day rate of change is
at the level where the March rally peaked. If it blows through here, the
strength will persist for at least several more weeks. If it doesn't, the
10-13 week cycle up phase may be all but over. The top of the 6 month cycle channel
(Blue) and 10-12 month channel (green) could be right here. Short cycle
cmaps are pointing to a top between here and 1425. The 10-13 week ozzie
hasn't reached overbought yet. If the oscillators roll over in the next
week or so, the 10-13 week cycle down phase should go sideways at this
early stage of the 6 month cycle. However, the 8 day waves should be
shortable near the top of the red and dark blue channels, representing the
10-13 week and 6 month cycles.channel.
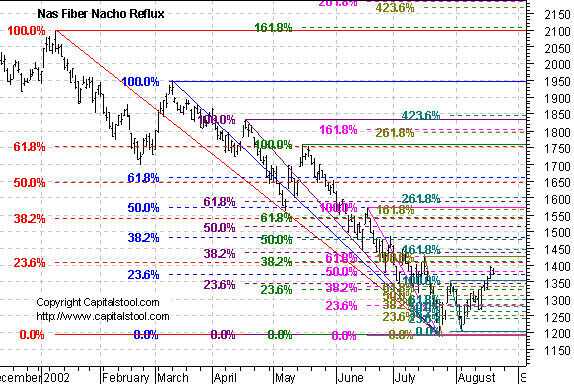
Fiber Nacho Resistance Levels. So far 1375-80 is holding. Nasdaq Cycle Conditions as of 8/20/02
PTT
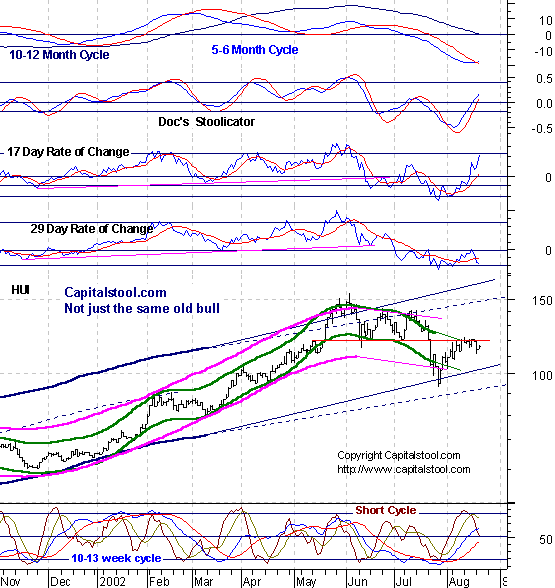
- Periods Till Turn AM Edition Features (Previous) These features are in morning edition, published around 9 AM ET US, or the Saturday Weak End Edition, published, uh, let's see, Saturday! Golden Stool Baby HUI still
has lots of crawling to do before he can stand up and run. Here comes the retest.
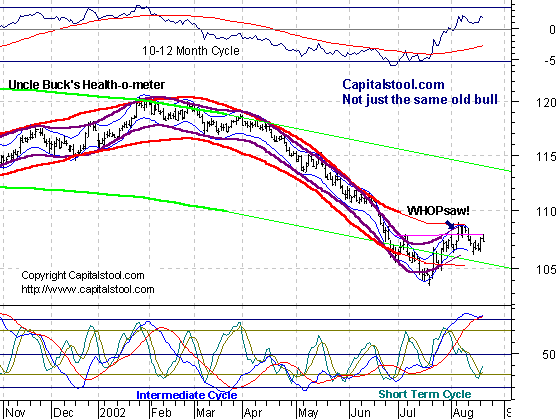
We're about to find out the true nature of last week's low. Uncle Buck's Illness Uncle Buck's intermediate
up phase looks long in the tooth, but the short cycle oscillator says
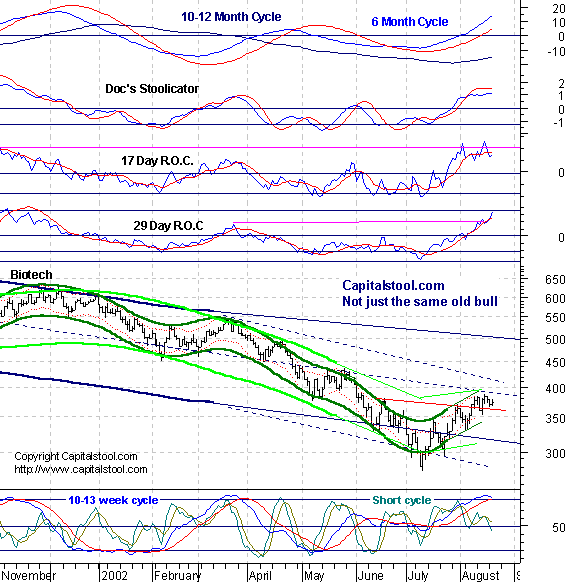
he'll sit up in bed one last time. Biodrech- Top formation
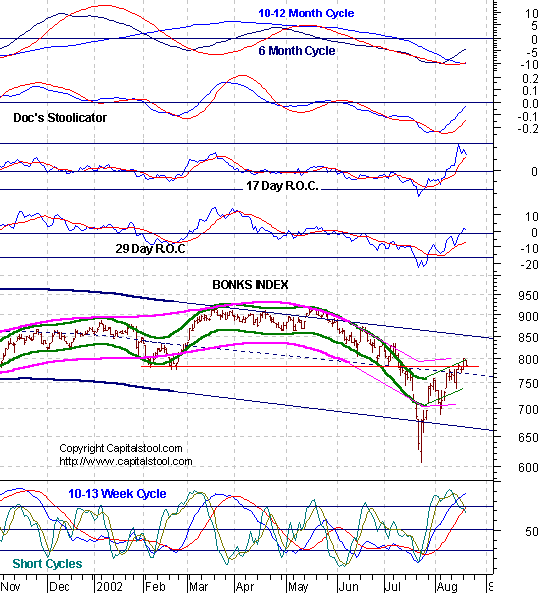
begins. Bonkers- 10-13 week ozzie
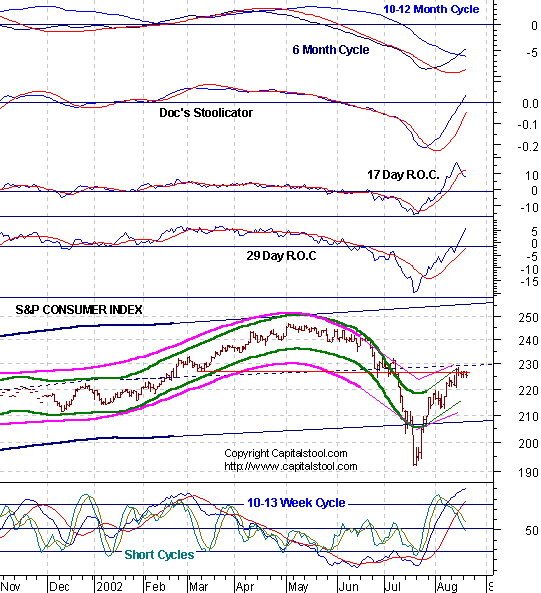
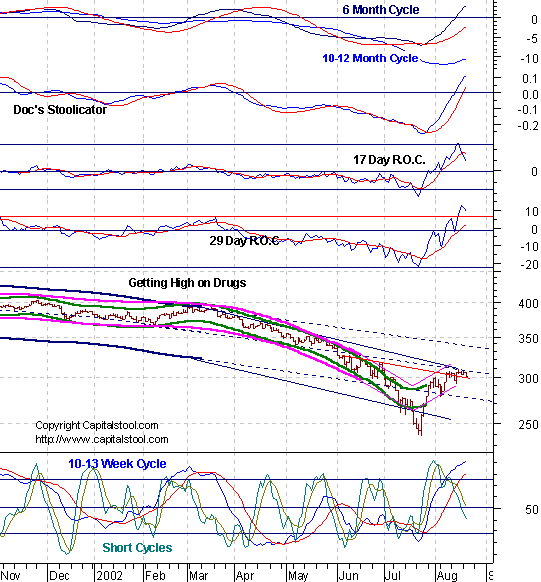
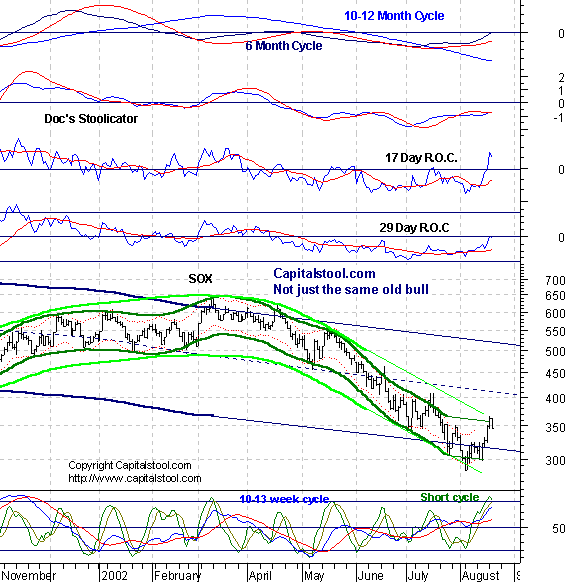
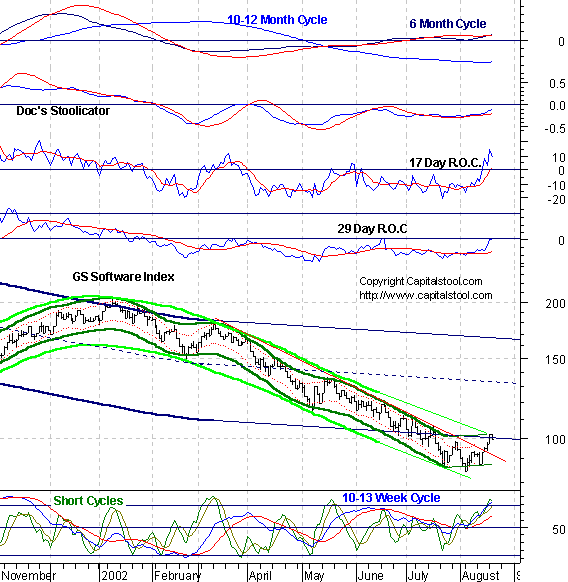
in topping zone. Consumers- Ditto. Drugs- Ditto. SOX- Short cycle toppy,
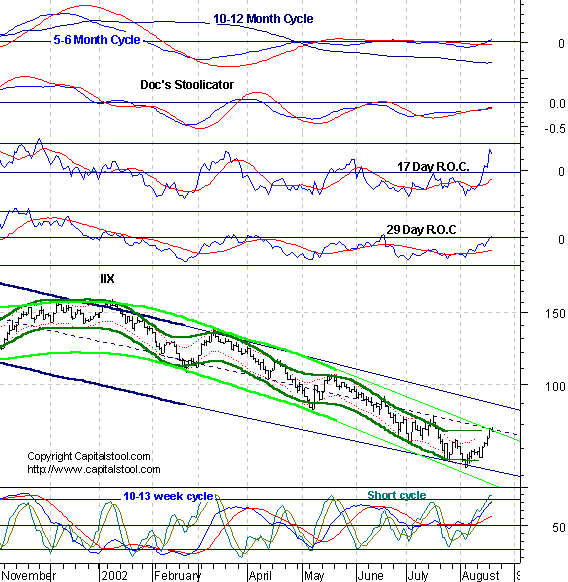
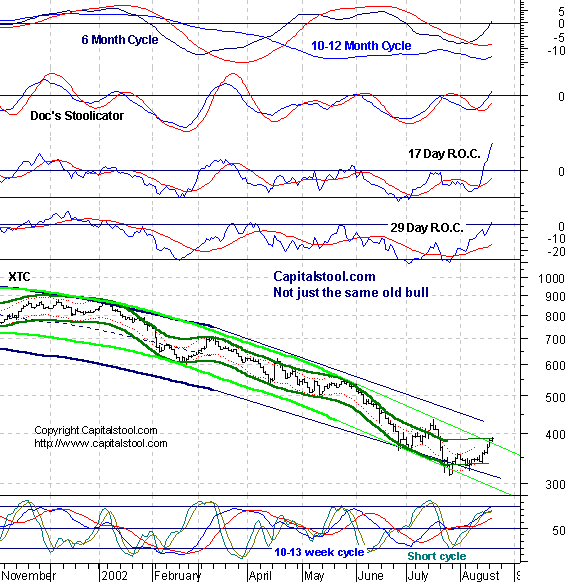
rally looks floppy. Internut- Trouble at top of
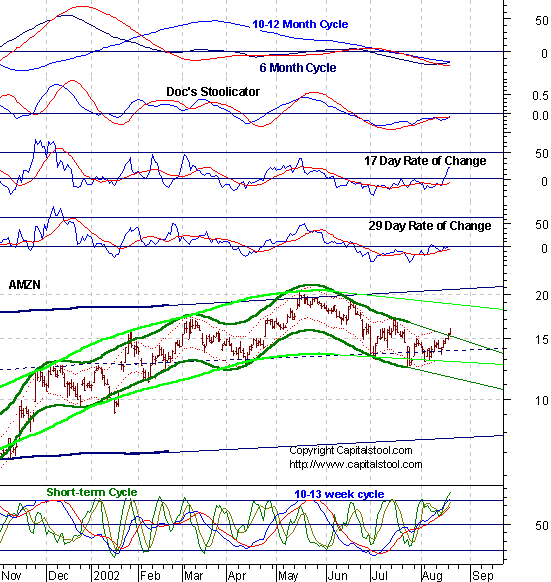
channel. Software- Ditto. Telecoms- Likewise. AMZN- Right
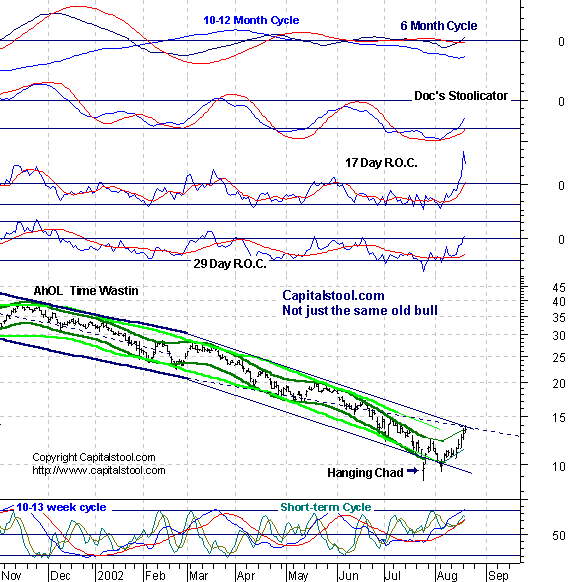
shoulder? AhOL-
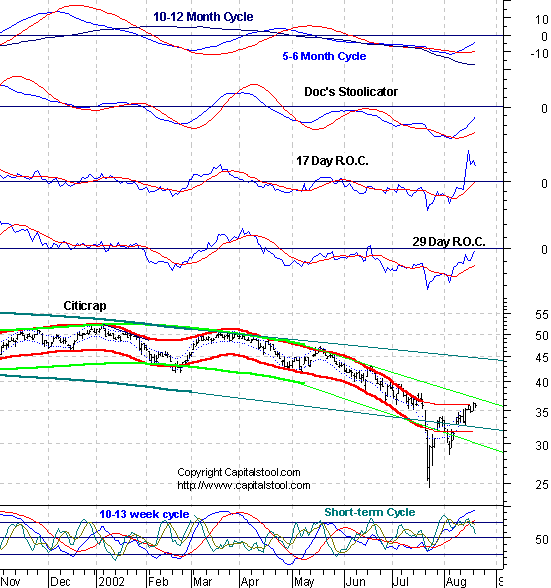
Channel troubles? Citicreep-
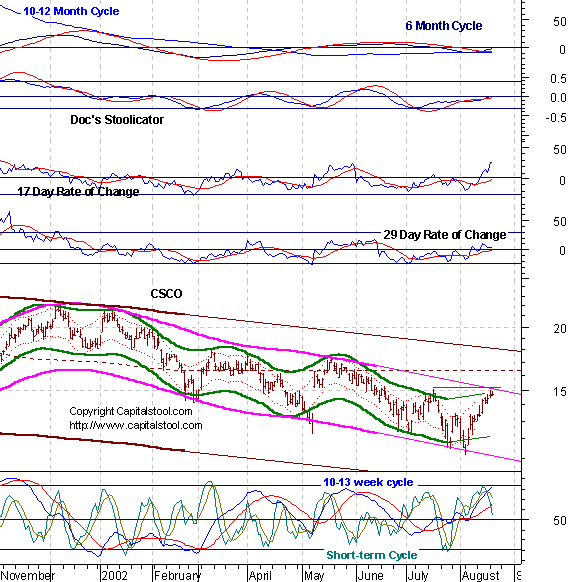
10-13 ozzie is toppy. CSCO- top of
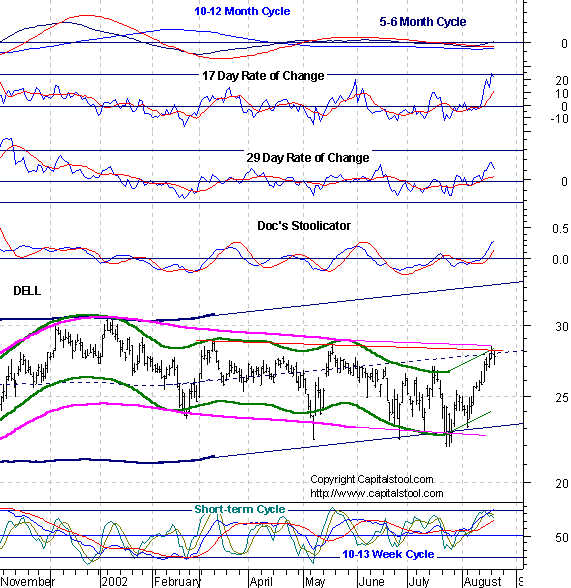
channel. DELL- More
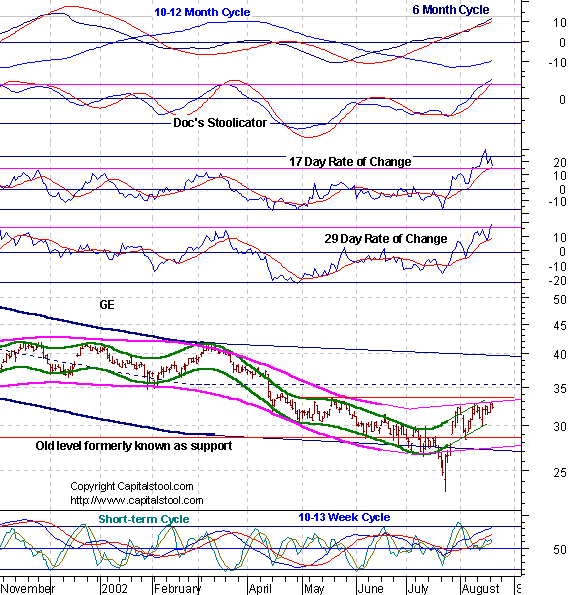
channel troubles? GE- Energy
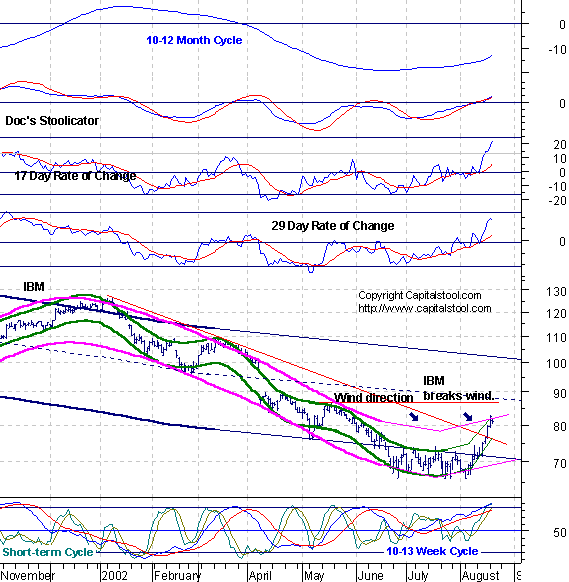
waning as resistance is tested. IBM- 10-13
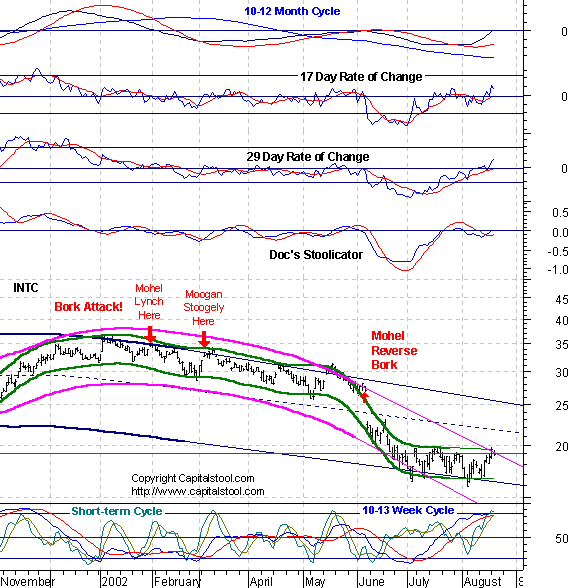
week ozzie enters top zone as top of channel is tested. INTC- Swup
on last laegs? See you in Intraday Stool. Dr. Stepan N. Stool Share your thoughts on the Stool Pigeons Wire.
Renewals Welcome, and thank you for subscribing to the Anals of Stock Proctology. Your trial subscription will run for 90 days. At the end of that period your subscription will renew automatically, unless you cancel. If you wish to cancel your subscription use the button below. If you want to renew your subscription do nothing. Your subscription will renew and your credit card or Paypal bank account will be charged. If you want to renew, be sure your credit card information in your Paypal account is current. Paypal will not renew your subscription if the card has expired! Again, thanks for subscribing!
Explanation of Intraday Commentary-Build charts at http://www.livecharts.com. For custom time bars insert a comma after symbol and number of minutes, e.g. compx,90. This will give you a bar chart of the Nas with 90 minutes per bar. The one day cycle is usually most clear with 8 minute bars and 26/18 stochastics. It varies from day to day. Sometimes 6 minutes works best. Experiment to find the best fit for your trading style, and the market's dominant frequency at the time. The goal here is primarily to monitor the condition of the 8 and 13 day cycles. I typically use 90 minute bars with 26/18 stochastics for the 13 day cycle proxy on the indices during regular trading hours. Other cycles use 26/18 stochastics with the following: 8 days- 60 minute bars On the 24 hour futures charts, use a time per bar approximately 3 to 4 times the above number of minutes, to represent the cycles listed above. ABBREVIATIONS: cma: centered moving average |
||||||||||||||||||||||||||||||||||||||||||||||||||||||||||||||||||||||||||||||||||||||||||||||||||||||||||||||||||||||

![[Most Recent HUI from www.kitco.com]](http://www.weblinks247.com/indexes/idx24_hui_en_2.gif)
![[Most Recent XAU from www.kitco.com]](http://www.weblinks247.com/indexes/idx24_sp500_en_2.gif)
![[Most Recent Quotes from www.kitco.com]](http://kitconet.com/charts/metals/gold/t24_au_en_usoz_2.gif)