|
10 Minute Bar Charts 6/6/02 Dow Jokes Inflatables
Archives 12/30/01, 1/1/02, 1/2/02, 1/3/02, 1/4/02, 1/7/02, 1/8/02, 1/09/02, 1/10/02, 1/11/02, 1/14/02, 1/15/02, 1/16/02, 1/17/02, 1/18/02, 1/22/02, 1/23/02, 1/24/02, 1/25/02, 1/28/02, 1/29/02, 1/30/02, 1/31/02, 2/1/02, 2/4/02, 2/5/02, 2/06/02, 2/7/02, 2/9/02, 2/11/02, 2/12/02, 2/13/02, 2/14/02, 2/16/02, 2/19/02, 2/20/02, 2/21/02, 2/23/02, 2/25/02, 2/26/02, 2/27/02, 2/28/02, 3/1/02, 3/04/02, 3/05/02, 3/06/02, 3/7/02, 3/10/02,3/11/02, 3/12/02, 3/13/02, 3/14/02, 3/15/02, 3/18/02, 3/19/02, 3/20/02, 3/21/02, 3/22/02, 3/25/02, 3/26/02, 3/28/02, 3/30/02 4/1/02, 4/2/02, 4/3/02, 4/4/02, 4/6/02, 4/8/02, 4/9/02, 4/10/02, 4/11/02, 4/13/02, 4/15/02, 4/16/02, 4/17/02, 4/18/02, 4/20/02, 4/22/02, 4/23/02,4/24/02,4/25/02, 4/26/02, 4/27/02, 4/29/02, 4/30/02 5/01/02, 5/2/02, 5/4/02, 5/6/02, 5/07/02, 5/8/02, 5/09/02, 5/10/02, 5/13/02, 5/14/02, 5/15/02, 5/16/02, 5/17/02, 5/20/02, 5/21/02, 5/22/02, 5/23/02, 5/24/02, 5/28/02, 5/29/02, 5/30/02 6/01/02, 6/3/02, 6/4/02, 6/5/02
|
The Anals of Stock ProctologyPublished 5 times
per week by the American Academy of Stock Proctology and PM Update 6/7/02 1 PM This morning's cmaps were almost hit on the NDX and Nas, but the SPX didn't come close. Once the oscillators for the 5 hour and 1 day cycles turn up, that indicates the cycle is up, and the cmaps for the lows then become moot. The lows came early, just before 10 AM, and the up phase is underway and should be peaking around 1:30 PM. If that turns out to be the case, the down phase would project to lows at 3 PM and Monday morning. If the 5 hour cycle ozzie turns down before the upside cmaps are hit, again, the projections become moot. Ditto for the 5 day projections if the 5 day oscillator turns up before the projections are hit. Terms and methodology
6/7/02 10:05 AM Revised cmaps, based on the current index action on this move are SPX 999, Nas 1490 and NDX 1106. AM Update 6/7/02 9:15AM Not much need for this, this morning. The question as to what happens after the opening collapse is the biggy. Doc will take a guess based on patterns in the fucutures, which aren't always reliable.
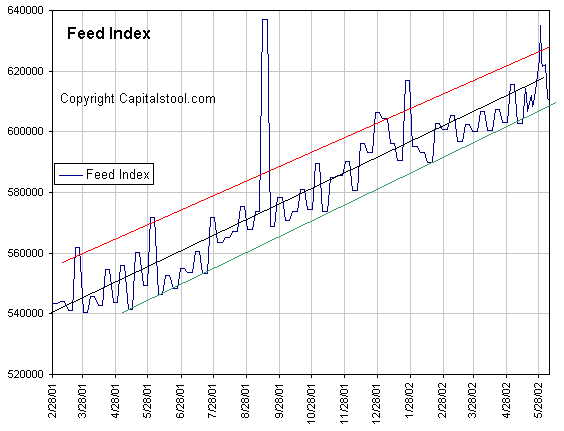
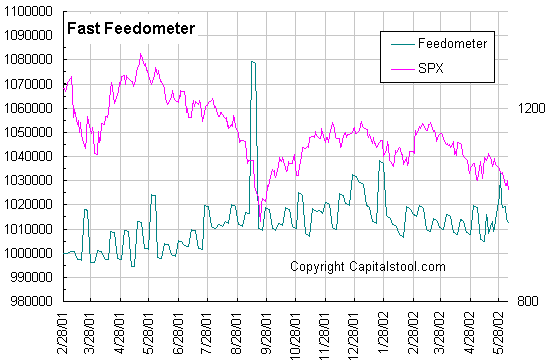
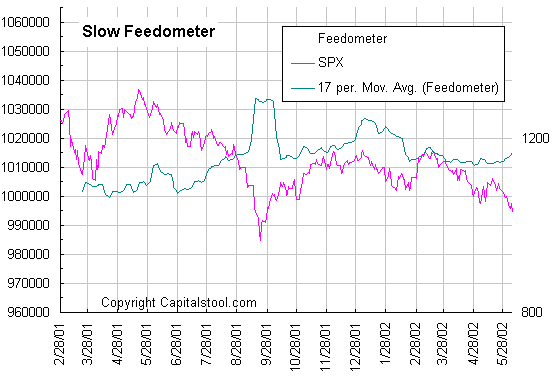
The Stealth Bull Market and Other Jackass Nonsense Excuses (6/6/02) The Feed did $4 billion in 27 day repos today. This was an incomplete rollover of $5 billion in 28 day repos, continuing the draining of excess pus that began immediately after last week's episode of explosive Feedarhea. There's no surprise here. Every single time the Feed has over-pumped, for whatever reason, they spend the ensuing weeks endeavoring to bring the growth of their paper holdings back to or below trend. Keep in mind that when the Feed adds to their portfolio of bonds, bills, notes, and repos, they are pumping money into the system through the Gang of 22, except when they are buying direct from The Treasury. Conversely they drain reserves through the same dealer network. When the dealers have money to play with, they put it to work by buying securities. Some of the money goes into stocks. And when the Feed taketh away, the Gang has to sell something. It's that simple. That's why we often see a direct immediate effect on stock prices. None of this 9 month delay crap that economists and market analcysts love to talk about. The effect on the market is instantaneous, usually the next day, if the Gang so chooses. The Feed Index shows the trend of
total Fed holdings. It's growing like mad, but it's all necessary to keep
the bubble from imploding. Not all of that goes into stocks - only when
there's excess, and only when the Gang of 22 decide it's a good idea to
put it there. The Fast and Slow Feedometers purport to measure the excess
Feed, but they don't tell us whether the gang will use it to trade stocks.
These people are not stupid and they are definitely not in the business of
losing money. They are not going to stand in front of a downhill freight
train. Is it any surprise stock prices
have been weak? In tonight's H.4.1 release, we see that the Fed reduced
it's holdings of loans and securities by an unbelievable $23.9 billion
this week, almost completely reversing the $28 billion they added the week
before. The problem is that most of the $28 billion was hoovered up by the
2 Year Treasury Note sale. Not much of it was available to jam stocks in
the first place. So now that the Fed has taken most of the excess back,
the liquidity situation is far worse than before the Treasury sale. The
Gang of 22 doesn't have the play money it needs to support stock prices,
even if they wanted too, which they certainly don't, at this juncture. My
guess is that they are short up the kazoo, and if they aren't this market
is going to fall a lot farther than it otherwise would. The fact that the market has
continued falling in spite of the slight increase in excess Feed, measured
by the Slow Feedometer, is a clear sign that other sources of funds are
not picking up the slack. The market can only go up if the Feed pumps like
mad for weeks. And they can't do that, and have shown no inclination that
they want to. The collapsing dollar and rising inflation will see to
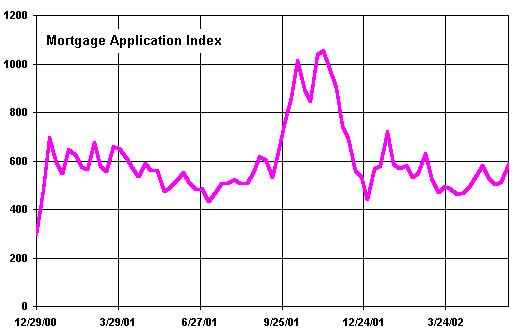
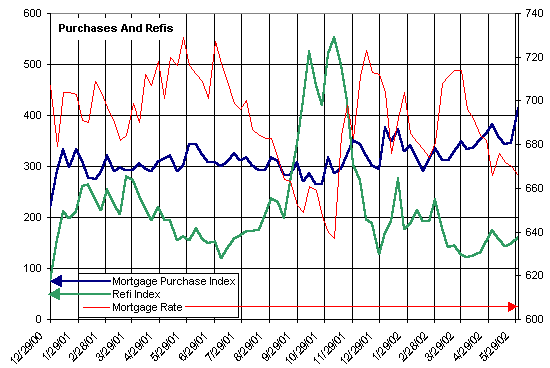
that. Meanwhile the Mortgage Bonkers released their weekly report on mortgage apps on Wednesday. Mortgage growth is the key to the credit bubble. As the mortgage bubble subsides, the financial system will face increasing liquidity difficulties. From the MBAA:
Doc
believes an excessive seasonal adjustment factor for Memorial Day skewed
the results. While the total index remains at high levels it is not responding
to lower mortgage rates. Demand is weaker because most refi demand was met
during the post 9-11 bulge, when the Treasury did away with the Thirty
Year Bond and long rates plunged. the Total index is flat, meaning that
money growth will be flat, and the stock market will sink because is is
the last place people would put the cash out refi money. They'll either
pay off debt or buy more real estate. This is not news. Both M1 and M3 were up only slightly in the week ending May 31. Checkable deposits were also up a bit. The charts were not available as this was written.
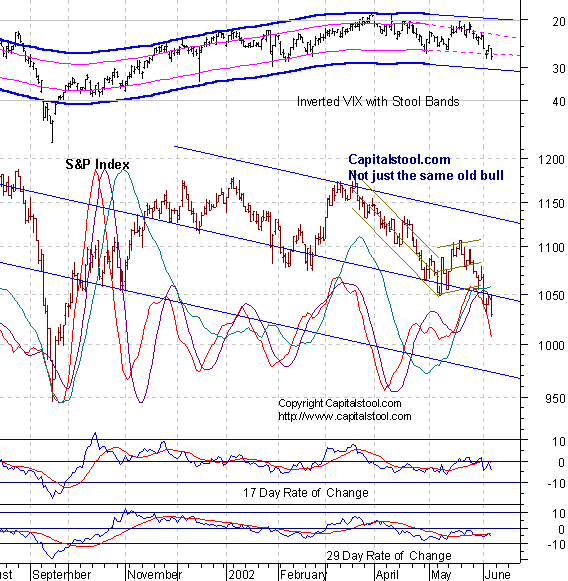
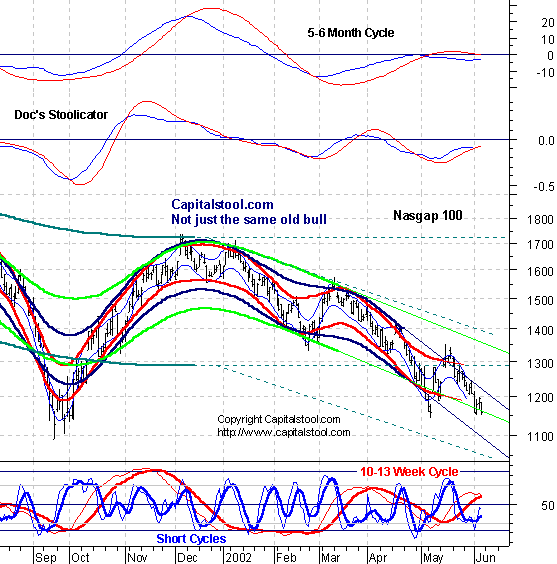
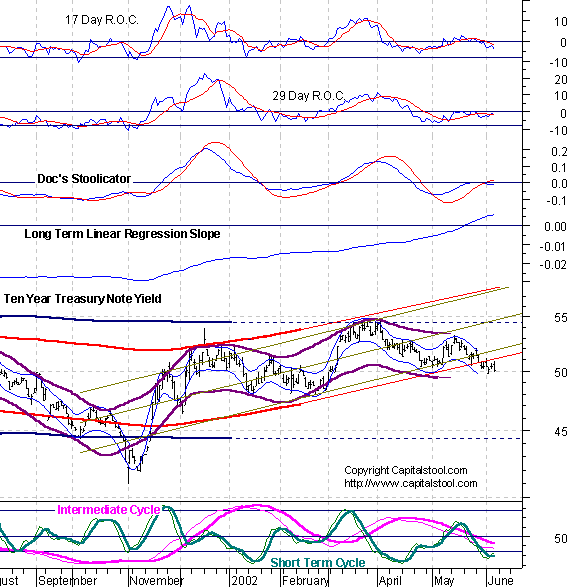
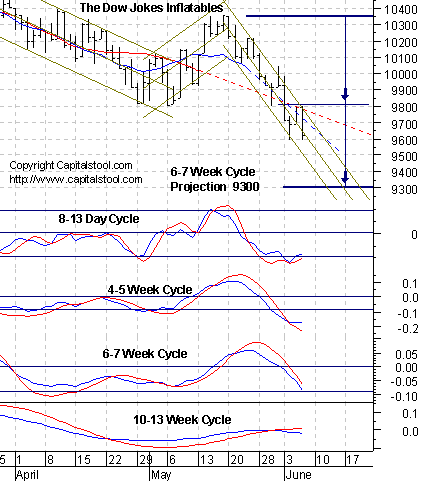
Portfolio Sphincters Index (SPX) and Sentiment The portfolio sphincters had another miserable day in their stealth bull market, down 20, and breaking through a key level formerly known as support (no such thing in a bear market) John Bullinger apparently is in that stealth bull camp, talking tonight about how the majority of stocks are doing well. Every time I see that guy on Crapvision he impresses me even more with his stupidity. Tonight he was pointing out the rising long term trend of new highs versus new lows. A problem there is that the overwhelming number of interest sensitive REIT's and preferreds skew the data. Another problem is the rotation of mental institutional money from one big stock into 10 or 20 small stocks. Ladies and gentlemen, it does not make one damn bit of difference how many slices you cut the pie into. It is still being consumed, and there is less and less of it. These people who site breadth and new high data to support the stealth bull market thesis are full of crap and don't know what they are talking about. But they sure are good at is self promotion. Bullinger Bands are another bunch of nonsense. The movement of stock prices is about waves and cycles, geometry and motion, not the study of static populations. But that's an argument for another time. The 17 day rate of change, which represents the 6-7 week cycle, fell. The 6-7 week cycle oscillator superimposed on the chart (red line with purple smoother) collapsed. The 10-13 week cycle oscillator (teal) still did not complete its top. Bear in mind that it's a lagging, confirming indicator. The 29 day rate of change is also still on the negative side of a topping pattern. If this indicator does not start heading lower, the market could trend like this indefinitely. The VIX rose to 27.46. On the inverted scale chart, VIX is breaking down. Fear is finally starting to build. But the breakdown of the last couple of chart lows indicates that the bigger trend toward complacency has been broken. The Stool Band (Stool Bands, which are smooth, are predictive, unlike some other, unsmooth bands we know.) is beginning to turn down, and what was "extreme" enough in the last couple of cycles to indicate a turning point will no longer be. The blue channel lines are the extension of a linear
regression channel from the February and May 2001 highs. The 6 month cycle oscillator is stalled flat in negative territory. There are two elements to consider when reading any kind of smoothed momentum indicator. One is direction. The other is absolute level. If the direction is flat, but the level is less than zero, the market will trend lower at the same rate. If the line begins to descend, the downtrend is accelerating. The trading stoolicator is starting to turn down. Same interpretation here. Shorter trends are somewhat negative, and beginning to accelerate down. The short cycle oscillator is sitting on the trampoline with the broken springs. There is zero upside impetus off what should have been a short cycle low. The 10-13 week cycle oscillator is only starting to roll over to the downside. The SPX broke a clearly recognizable level formerly
known as support. Looking at this chart, there's a lot of open territory
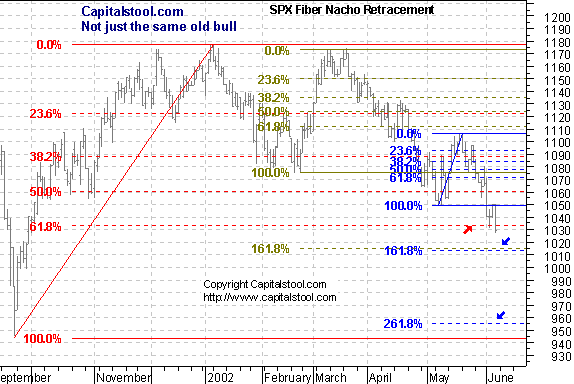
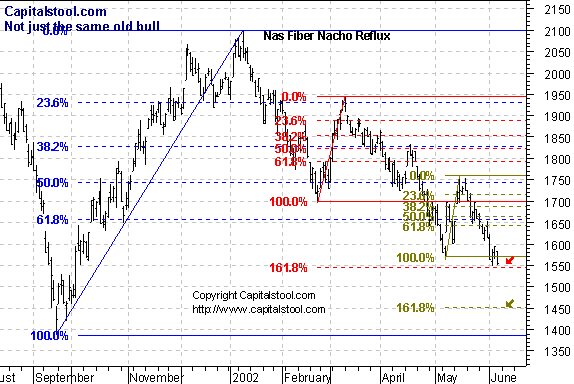
below. We are looking at three digits, soon. They broke the 61.8% retracement level. The
next stop is at 1014 , which is 161.8% of the recent rally. (Seems like
eons ago. All because some jerk didn't pay a little sales tax on a couple
of paintings. What a market, ay?) The Cycle Conditions tables include cycle phase and a wild guess as to number of periods to the next turn, in days for the shortest cycles, weeks (W) or months (M) for the longer ones. This is a fluid exercise, in other words, the projections are likely to be wrong, but they force us to be vigilant for key turning points, and frequently work well enough to prevent costly misreadings. SPX Cycle Conditions as of 6/6/02
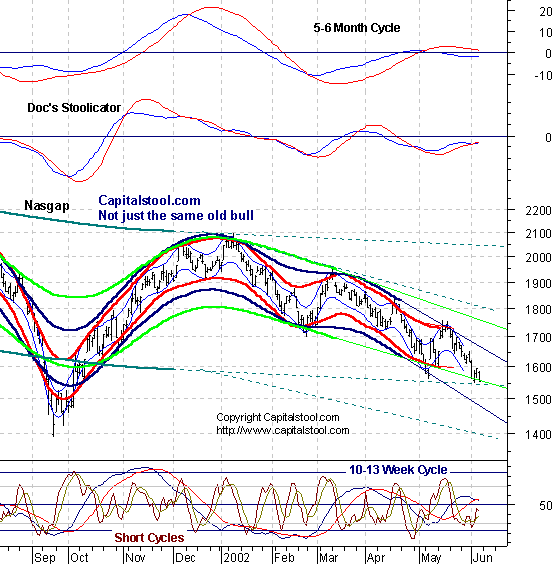
PTT - Periods Till Turn Nasgap Charts Down 40 on the Nasty to a major level formerly known as support. Then Intel after the bell. The Nasgap will live up to its name tomorrow morning. The "support" area is 1545-50. You ARE the weakest link. Goodbye! The 6 month
cycle time series spread is still stalled. Flat below zero is still
negative, no matter how much it looks like a positive divergence. Positive
divergences are a dime a dozen in major bear markets and they never mean
anything. Take a look at 1929-32 with an MACD if you don't believe it. Positive
divergences are worthless indicators in a declining trend, signifying only
a slowing in the downtrend. The 10-13 week cycle
oscillator and the trading stoolicator are flashing initial sell signals. The short
cycle oscillator is fibrillating in negative territory. That 4 week double bottom
is about to become resistance. The
picture is even worse in the Nascrap 100 capital vacuum, where money goes
to disappear forever. It may even break the September lows tomorrow.
Dollar Tree? You gotta be kidding. The Nas
is hanging around a fib level. The next one is at 1450. It would not be
surprising if it got there tomorrow although the shortest cycle cmaps are
only 1500. Nasdaq Cycle Conditions as of 6/6/02
PTT
- Periods Till Turn Looks like yields are headed lower. Portfolio sphincters, in their infinite wisdom , are selling stocks and buying bonds. The uptrend is broken. How low? Anybody's guess, but 4.75 for starters.
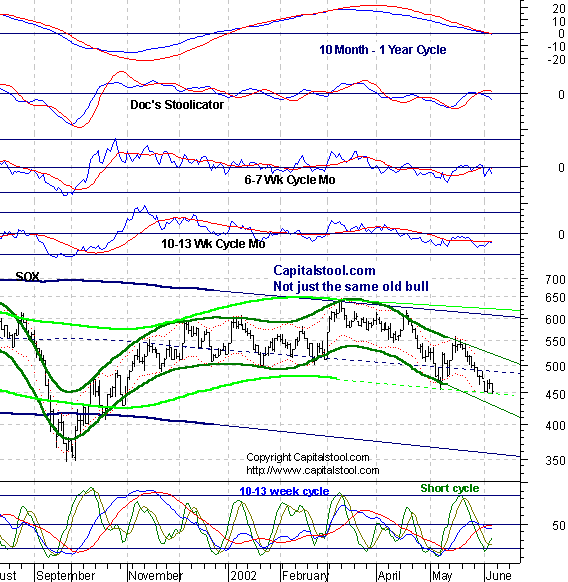
The SOX is going to break
its 10-12 month channel (light green) down. Heading for 350. The Retail sector was one
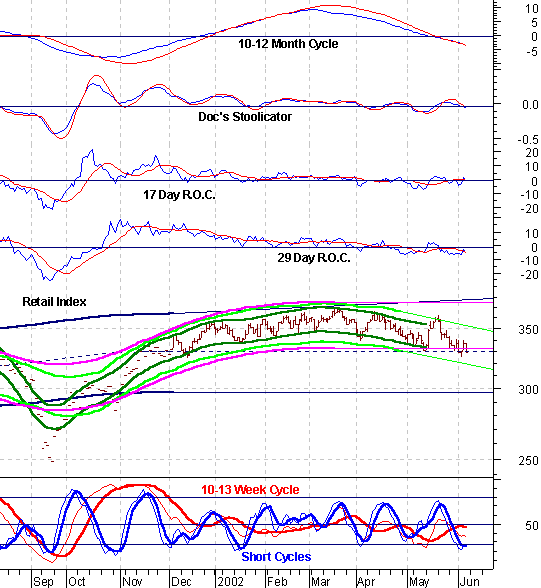
of The Street's "stealth" bull groups. It was bull alright. It
will complete a huge distributional top today. Here's another "Wall
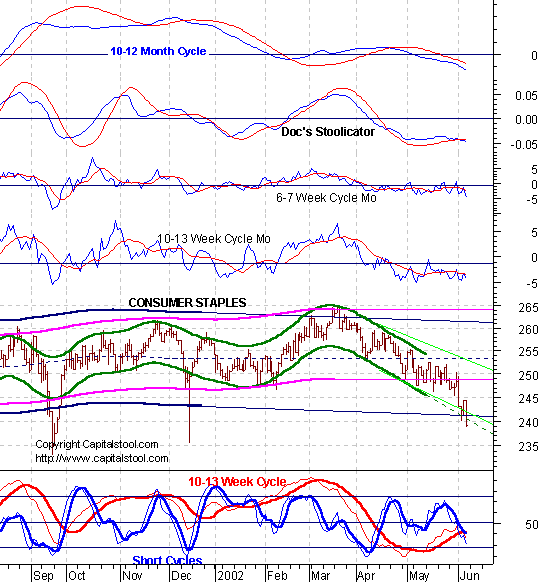
Street "stealth" bull sector. It's beaking down faster than
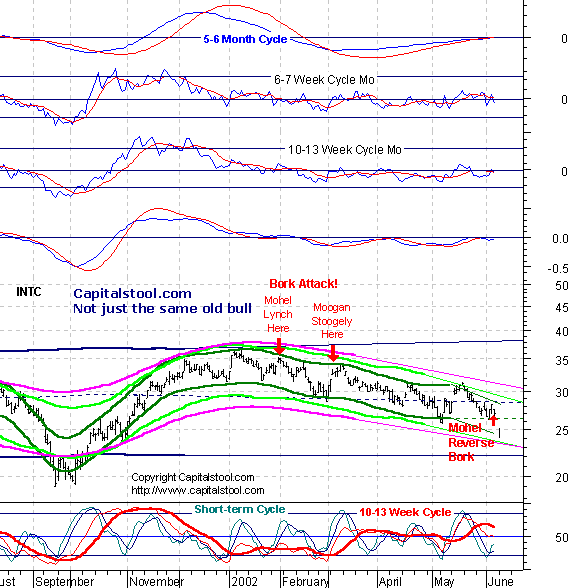
cycle projections can keep up with. All the news this morning
is about Intel. Doc has documented Mohel's track record on this chart.
What a disgrace. They are the best at this. Stock's at 23 1/4 in the
pre-market. It will find buying at that level if the cycle trend
projections are correct. If 23 doesn't hold, we're looking at a 1987, 1929
scenario. Yesterday, they closed
Custer's last stand. This decline is just getting started,.
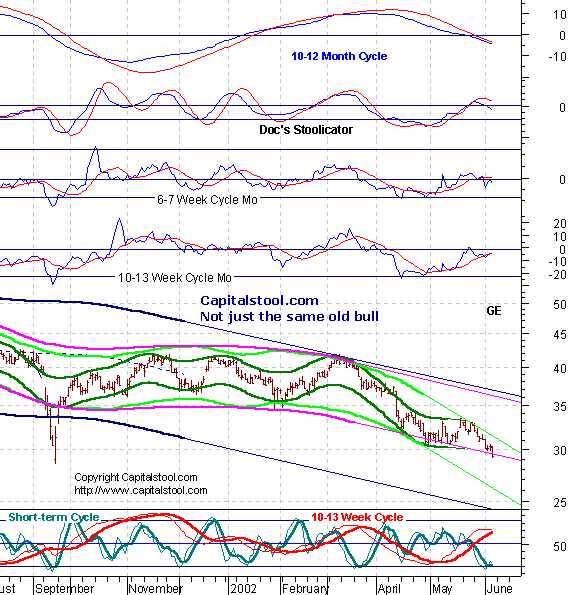
Destination - 24. Thanks to Maxxpain for
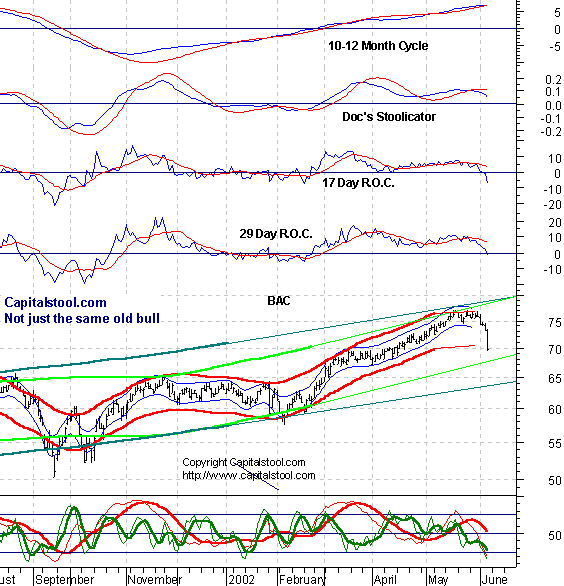
calling Doc's attention to Bonk of America. Everything looked fine a week
ago, but not if you were watching the short and intermediate term
oscillators. This decline is also just getting started and may be the
beginning of a complete collapse. What happens in the 67-68 area is
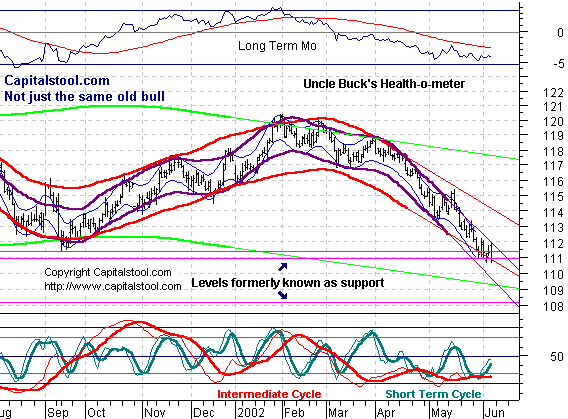
crucial for the outlook longer term. Henceforth and forevermore, if you would like to request a "stocko", please post your request in Dear Dr. Stool. If you have not already registered for the message board, please do so. The only required info is user name and password which you choose yourself, and your email address, which you can keep private by selecting the keep private option. Doc looks forward to featuring your ideas. We've had some good ones! Uncle Buck's Illness The doctors working feverishly
on Buck in room 111 may be losing him, but so far this morning he's holding
on. Help from the PPT. Golden Stool Short term cycle sell
signals point to a consolidation. No sign of a major selloff. If it
happens, it will be surprise to Doc. See you in Intraday Stool. Dr. Stepan N. Stool Let me know what you think on the Stool Pigeons Wire. Previous complete issue with all features Welcome To New Subscribers Welcome, and thank you for subscribing to the Anals of Stock Proctology. You may note some subtle differences in style now that this is no longer a free service. The perspective is still bearish, but it will have a more balanced approach than my message board ravings. You won't see me screaming "BUY" about anything except perhaps gold, but you will see stronger indications of areas and times when I think it might be a good idea to avoid being short. And I promise that I will lose my temper from time to time to keep you entertained! There's also a new feature, Doc's By Request Stock O' The Day. If you have a stock you're interested in, send an email to [email protected], naming the stock, and why you think Doc should look at it, in 25 words or less. 26 words, and you're disqualified! Those that look interesting, Doc will try to feature here within the next day or two. If you have suggestions about other features you'd like to see, send them along to [email protected]. Again, thanks for subscribing!
Explanation of Intraday Commentary-Build charts at http://www.livecharts.com. For custom time bars insert a comma after symbol and number of minutes, e.g. compx,90. This will give you a bar chart of the Nas with 90 minutes per bar. The one day cycle is usually most clear with 8 minute bars and 26/18 stochastics. It varies from day to day. Sometimes 6 minutes works best. Experiment to find the best fit for your trading style, and the market's dominant frequency at the time. The goal here is primarily to monitor the condition of the 8 and 13 day cycles. I typically use 90 minute bars with 26/18 stochastics for the 13 day cycle proxy on the indices during regular trading hours. Other cycles use 26/18 stochastics with the following: 8 days- 60 minute bars On the 24 hour futures charts, use a time per bar approximately 3 to 4 times the above number of minutes, to represent the cycles listed above. ABBREVIATIONS: cma: centered moving average |
|||||||||||||||||||||||||||||||||||||||||||||||||||||||||||||||||||||||||||||||||||||||||||||||||||||||||||||||
![[Most Recent XAU from www.kitco.com]](http://www.weblinks247.com/indexes/idx24_nasdaq_en_2.gif)
![[Most Recent XAU from www.kitco.com]](http://www.weblinks247.com/indexes/idx24_sp500_en_2.gif)
![[Most Recent Quotes from www.kitco.com]](http://kitconet.com/charts/metals/gold/t24_au_en_usoz_2.gif)
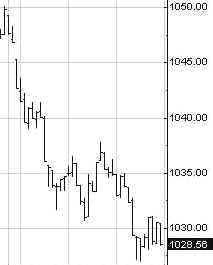
 After
today's drop of 172 points the question on Doc's mind is whether the Dow's
stage managers have now positioned themselves for the Big One. Clearly the
Feed has not been providing enough excess cash to allow a major support
operation. The managers should then have been using recent rallies to
build short positions. Were they able to build big enough short positions
to allow them to step in early when heavy selling finally appear. The odds
are that they did not, and that if they are only moderately net short, or
not at all, they may have to stand aside until the selling exhausts
itself, like they did in September. Keep in mind that the market makers
have had to absorb week after week of net customer selling. While the
opportunities they've had to establish short positions have been spectacular,
they've actually been few and far between. If they are net long as a
result, it is hard to imagine a more bearish scenario.
After
today's drop of 172 points the question on Doc's mind is whether the Dow's
stage managers have now positioned themselves for the Big One. Clearly the
Feed has not been providing enough excess cash to allow a major support
operation. The managers should then have been using recent rallies to
build short positions. Were they able to build big enough short positions
to allow them to step in early when heavy selling finally appear. The odds
are that they did not, and that if they are only moderately net short, or
not at all, they may have to stand aside until the selling exhausts
itself, like they did in September. Keep in mind that the market makers
have had to absorb week after week of net customer selling. While the
opportunities they've had to establish short positions have been spectacular,
they've actually been few and far between. If they are net long as a
result, it is hard to imagine a more bearish scenario.